适用于MetaTrader 4的新EA交易和指标 - 172

Indicator overview Trend indicator usage Moving averages. Highest quality alerts that need no introduction. It is completely loyal to the original algorithm and uses other useful features.
Easy to trade Carry out all kinds of notifications It's not a new paint and it's not a back paint. Setting Indicator SMA50 in Time frame H1 for any pair currency and Gold Spot. EMA200 in Time frame H1 for any pair currency and more than EMA250 for Gold spot. Using it for maximum benefit Set up notificatio
FREE

Indicator overview Trend indicator usage Moving averages. Highest quality alerts that need no introduction. It is completely loyal to the original algorithm and uses other useful features.
Easy to trade Carry out all kinds of notifications It's not a new paint and it's not a back paint. Setting Indicator SSMA50 in Time frame H1 for any pair currency and Gold Spot. EMA200 in Time frame H1 for any pair currency and more than EMA250 for Gold spot. Using it for maximum benefit Set up notificati
FREE

Indicator overview Trend indicator usage Moving averages. Highest quality alerts that need no introduction. It is completely loyal to the original algorithm and uses other useful features.
Easy to trade Carry out all kinds of notifications It's not a new paint and it's not a back paint. Setting Indicator WMA50 in Time frame H1 for any pair currency and Gold Spot. EMA200 in Time frame H1 for any pair currency and more than EMA250 for Gold spot. Using it for maximum benefit Set up notificatio
FREE

Multi Time Frame Indicator acts as a Scanner based on the Ichimoku Trading System. The outcome is displayed on a board. This helps you to make "at a glance" a mental picture of the System without having to open the chart. Up to 10 Currencies can be watched. Scanned elements And Legend "KUMO Futur" - Green : The Kumo Futur is Bullish. "KUMO Futur" - Red : The Kumo Futur is Bearish. "PRICE Cross KJ" - Green : The Price is Above the Kijun Sen. "PRICE Cross KJ" - Red : The Price is Below the Kijun
FREE

Relative Strength Index Cross [RSI Cross] A combination of 2 RSI to create a crossover trading setup Input parameters: signal mode: set it to true if you want to plug it into STAT (Signal Tester and Trader) arrow shift: distance between fast EMA line to arrow on chart price line filter fast RSI period slow RSI period RSI price method price upper level price lower level You can find the best setting for 4 hour EURUSD on this video
FREE

Moving Average Convergence Divergence (MACD) Signal Input parameters: signal mode: set it to true if you want to plug it into STAT (Signal Tester and Trader) arrow shift: distance between fast EMA line to arrow on chart standard entry mode for MACD fast EMA period slow EMA period MACD period MACD price method Standard Entry mode: buy when slow EMA cross and close above fast EMA while above the 0 line sell when fast EMA cross and close above slow EMA while below 0 line You can find the best set
FREE

This indicator is an upgrade of traditional MACD on MT4. Macd Base line cross above Macd signal line the color of histogram change is red color and entry order Sell. Macd Base line cross below Macd signal line the color of histogram change is green color and entry order Buy.
For above histogram of Macd can change color to good looking by can change color above zero line and lower line.
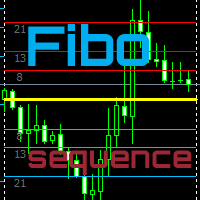
Fibo Sequence EA
The EA Strategy: This EA strategy is based on Fibonacci Sequence number Calculations to produce it's own signals and trade automatically. It was built for those traders who loves and trust Fibonacci Levels. In finance, Fibonacci level is a method of technical analysis for determining support and resistance levels. They are named after their use of the Fibonacci sequence. Fibonacci is based on the idea that markets will retrace a predictable portion of a move, after which they
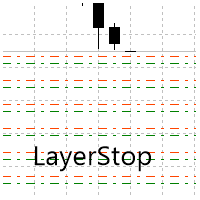
LayerStop EA only performs an action open pending order BUYSTOP or SELLSTOP, thus only monitor the trailing stoploss.
No specific conditions are used to open pending order.
Pending order BUYSTOP or SELLSTOP will generated immediately after an Expert Advisor is attach in the chart.
Suitable for News High Impact.
If you already attach LayerStop EA in the chart, and want LayerStop EA performs new one an action open pending order BUYSTOP or SELLSTOP, you need to remove LayerStop EA from
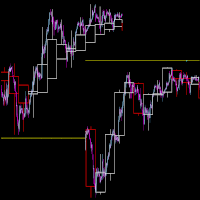
This indi lets you plot higher time frame candle stick (Japanese Candlestick or Heiken Ashi Candlestick). This indicator could greatly help your trading style either its scalping, day trading or swing trading as it shows you the higher time frame candlesticks activity while you are about to pull a trigger on your trade. The candlesticks will only appear on a time frame that is lower than the higher time frame. It won't draw if the current time frame is equal to or higher than the time frame set

OPENING PRICE: $49, 2 COPIES LEFT!
Next price: $149 Final price: $299
This is an expert that is fully automated with fixed stoploss and take profit. You can choose if you want to trade with fixed lots, or lots per amount in balance. This EA is based on pure trend movements.
No martingale No grid
Broker and deposit
Any broker with small spreads is suitable. Recommended deposit: $300 or more. Minimum deposit: $100
Currency pairs and timeframe Recommended pair: EURUSD Recommended t
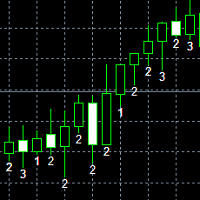
Rob Smith's is a trading method developed over a 30 year career in the market. TheSTRAT is a multi-timeframe strategy that has three major components: Inside Bars - Inside Bars occur when the current candle falls completely within the prior candle. Directional Bars - Directional Bars occur when the current candle takes out one side of the prior candle. Outside Bars - Outside Bars occur when the current candle takes out both sides of the prior candle. #thestrat

OPENING PRICE: $30 (3 copies left) Next price: $59 Final price: $99
Pure Trend EA is a low-risk expert that is fully automated with fixed stoploss and take profit. You can choose if you want to trade with fixed lots, or lots per amount in balance. This EA is based on pure trend movements that is based on Stochastic and MACD.
No Martingale No Grid
Broker and deposit
Any broker with small spreads is suitable. Recommended deposit: $300 or more. Minimum deposit: $100
Currency pairs

Current price: $49
Final price $199
This EA is a professional built EA with fixed stoploss and takeprofit to minimize risk (1/4 ratio). It uses only tools that messures trend and oscillator. It has been a long work to find what tools to combine, to find best results. You can choose if you want to trade with fixed lots, or lots per amount in balance.
No Martingale No Grid
Broker and deposit
Any broker with small spreads is suitable. Recommended deposit: $300 or more. Minimum deposi

This indi shows the following 1. Supertrend 2. Alligator (Not a regular alligator)
3. ZigZag 4. Moving Average 5. Trend Continuation/Mini correction Signal (plotted in X) (See screenshots in green background color
6. Early Signal Detection (See screenshots in green background color)
You may treat Alligator as the lagging indicator
The leading indicator is the supertrend. The zig zag is based on the leading indicator where it gets plotted when the leading indicator got broken to the opposite.

DSProFx Fibo-Momentum Expert Advisor is a fully automated Forex robot.
Concept, Timeframe and Pairs DSProFx Fibo-Momentum works in time frame H1 and H4 . The lower the time frame, the higher the risk will be. It works based on combination of DSProFx Momentum Indicator ( https://www.mql5.com/en/market/product/27348 ) and Fibonacci level . In some cases, it may open multiple trades with martingale system to manage the floating loss trade. The trades will be closed automatically by profit ta

Works best on Daily time frame with any pair but we suggest the following: EUR/USD GBP/JPY CAD/JPY NZD/JPY Requires broker with leverage of at least 1:100 This is a multi level hedging based EA. This EA was developed by using a view point based on a unique multi-level technical analysis and years of experience. By prioritizing the need for accuracy and consistency we were able develop an EA that not only produces profits, but produces them consistently. Verifying the conditions that are pr

For this set of indicators 1. General information - Calculates with high performance mathematical algorithms. - Calculated from the price of candles - The entry point of this order is filtered by the train EMA and the oscillator. - Calculate the integrity of the candle
2. How does it work? - You can see two types of order entry points: the notification on the monitor and the arrow. - You can trust 75-95 percent of this entry point.
3. Settings - A complete candle

For this set of indicators 1. General information - Calculates with high performance mathematical algorithms. - Calculated from the price of candles - The entry point of this order is filtered by the train EMA and the oscillator. - Calculate the integrity of the candle
2. How does it work? - You can see two types of order entry points: the notification on the monitor and the arrow. - You can trust 75-95 percent of this entry point.
3. Settings - Retracement is re

For this set of indicators 1. General information - Calculates with high performance mathematical algorithms. - Calculated from the price of candles - The entry point of this order is filtered by the train EMA and the oscillator. - Calculate the integrity of the candle
2. How does it work? - You can see two types of order entry points: the notification on the monitor and the arrow. - You can trust 75-95 percent of this entry point.
3. Settings - A complete candle

For this set of indicators 1. General information - Calculates with high performance mathematical algorithms. - Calculated from the price of candles - The entry point of this order is filtered by the train EMA and the oscillator. - Calculate the integrity of the candle
2. How does it work? - You can see two types of order entry points: the notification on the monitor and the arrow. - You can trust 75-95 percent of this entry point.
3. Settings - A complete candle

For this set of indicators 1. General information - Calculates with high performance mathematical algorithms. - Calculated from the price of candles - The entry point of this order is filtered by the train EMA and the oscillator. - Calculate the integrity of the candle
2. How does it work? - You can see two types of order entry points: the notification on the monitor and the arrow. - You can trust 75-95 percent of this entry point.
3. Settings - A complete candle

For this set of indicators 1. General information - Calculates with high performance mathematical algorithms. - Calculated from the price of candles - The entry point of this order is filtered by the train EMA and the oscillator. - Calculate the integrity of the candle
2. How does it work? - You can see two types of order entry points: the notification on the monitor and the arrow. - You can trust 75-95 percent of this entry point.
3. Settings - A complete candle

This indicator displays support and resistance at fixed levels. The level won't change regardless how many days or minutes has gone by. There are 7 levels start from green ends at gray color. Imagine it like do (green),re,mi,fa,sol,la,si,DO (green)
Market often goes one octave from do to DO or fa to FA. You will see this occurring at all markets This indicator can be used to spot your take profit or stop loss target. It can be also used to find support and resistance or supply and demand.

Советник, предназначен для торговли инструментами на рынке Forex.Настроен для пары EURUSD. Советник работает прямыми ордерами типа Buy,Sell.Система построена на основе индикаторов мета трейдер 4 , присутствует одноразовое увеличение лота в системе не предусмотрены StopLoss и TeikProfit . Советник закрывает профит в процентах от депозита, При входе в рынок Советник также контролирует объем торговых позиций в процентах от депозита. Советник имеет защиту от сбоев, при восстановлении соединения про

PipJet MT4 EA is a fully automated Expert Advisor. Its advanced price action based algorithm is trying to predict next candle's direction and opens (or not) the appropriate trade. It has a unique number of settings that make it extremely versatile in all market conditions.
Requirements Optimized to work with GBPUSD Timeframe M1. Recommended deposit is $250 for initial lot set to 0.01 , $2500 for initial lot set to 0.10. Any Broker with low spread is recommended to get better results. Co

Retracement Hunter This Indicator based on powerfull daily levels . support and resistance, Buy / Sell entries which is more based on low risk and high reward and winning ratio, Enter trade when you get popup alert , book profit on target1, target 2, target3 levels, most of the trending days it will hit target3, but its always safe to book partial at target1 or target2
Buy best entry when rule 1) look for Buy 2) Emas aligned less than 0.25 3) Main Ema aligned Buy , it will alert when all t

EA WolongVN No1 uses multipair to correlate transactions between pairs. Use data of the stock exchange https://www.nyse.com/ to evaluate the direction of the dollar index Use data of the stock exchange https://www.londonstockexchange.com/ to evaluate the trend of EUR Then compare the correlation between the two data to execute an order XAUUSD, EURUSD, GBPUSD .... EA runs on data of saxo bank and dukascopy bank. So the backtest will not have high accuracy There are of course some constraints, in
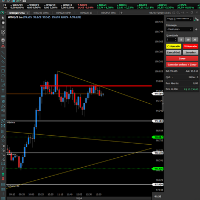
O indicador DonForex é uma das ferramentas mais utilizadas para traçar suporte e resistência automaticamente. Ele traça os melhores níveis de suporte e resistência do gráfico em qualquer tempo. Isso ajuda você a ter uma visão mais amplas para fazer suas operações
As linhas pontilhadas são os pontos mais tocados pelo preço formando assim uma região de suporte ou resistência. Ele também traça automaticamente linhas de tendências de alta (LTA) ou de baixa (LTB) nos dando oportunidade de compra e

This is a script in the entire application that records your trading logs that I created myself to practice trading skills.
The whole set includes: script, and web app: https://myfxjournal.cloud
It is very simple with only two options: Type (select dropdown) and Ticket (input).
If you choose to record open positions, please choose Type = Opening_Trade, otherwise choose Type = Closed_Trading (this is under the Account History tab)
***********This is the part used on the website**********

This advisor enters the market at the opening of London Market . It has a automatic function that give buy (arrow up green) and sell (arrow down red) signal when the indicator met high probabilities requirements.Once the signal is generated it is the trader discretions to start the order button and do trade manually. Stop loss are base on ATR. Recommended Take profit is 20pips. The trading system is suitable for both experienced traders and beginners.
Monitoring and proof of wins : https

SALE NOW! Limited Time Offer! An exclusive indicator that utilizes an innovative algorithm to swiftly and accurately determine the market trend. The indicator automatically calculates opening, closing, and profit levels, providing detailed trading statistics. With these features, you can choose the most appropriate trading instrument for the current market conditions. Additionally, you can easily integrate your own arrow indicators into Scalper Inside Pro to quickly evaluate their statistics and

Trend Power Indicator is an indicator which helps to identify trend direction and its power by using moving averages ZigZag pattern and correlations of tradable instruments. It provides trend power data with user-friendly interface which can be read easily and fast. This indicator by default is configured for trading of Adam Khoo's ( Piranhaprofit ) strategies. It saves mass of time for searching of tradable pairs by his strategies. It indicates when all required moving averages are align

该指标在图表上显示基于前一天计算的经典枢轴水平。 您可以选择从哪个小时计算公式。 在平盘中以反转水平交易。 在趋势市场中,将它们用作目标。 结合您的成功交易策略 。 这些级别是使用缓冲区构建的,并显示在整个可用的报价历史记录中。
输入参数 。
Start Hour - 一天从几点开始。 00 - 默认 。 Show Mid Pivots - 显示中间级别 。
Visual Button - 按钮显示(启用/禁用) 。 Corner - 按钮锚定角度 。 X indent - 以像素为单位的水平填充 。 Y indent - 以像素为单位的垂直填充 。
Label Visual - 显示级别标签 。 Label Font Size - 字体大小 。 Label Shift Bars - 在酒吧的铭文的缩进 。 Label Tooltip - 在关卡上方的光标下显示文本 。
Levels Style - 线条画风格 。 Levels Width - 宽度 。 Levels Color - 颜色 。
Alert - 启用/禁用通知 。 Ale
FREE
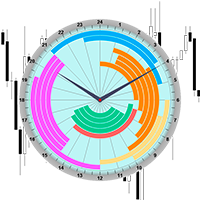
The professional indicator of Trading Sessions is now available in MetaTrader4.
Also the professional BROWSER of the NEWS and Trading Sessions is now available in MetaTrader5.
One dial shows the time of the 18 largest stock exchanges in the world. This makes it possible to trace the characteristic movement of the market at the appropriate time of day.
Thanks to sound and Push notifications, you will never miss the start of trading on the next exchange!
The operating time of each exc

This indicator draws strong price levels (price consolidation levels). The levels are plotted using 2 MA indicators and 1 MACD using a complex algorithm. The algorithm used in the EA is also in personal use.
These levels have 4 variants (colors of the variants can be customized): strong up, weak up, strong down, weak down. In turn, a weak level usually appears and then it can become strong. A strong level can also become weak. Version MT4: https://www.mql5.com/en/market/product/27
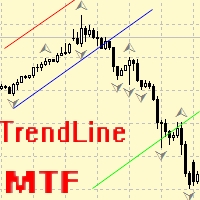
Ea交易用于手动绘制趋势线及其附带的止损和获利。 趋势线的初始构建基于分形指标。 接下来,您需要根据交易通道的方向和宽度或一些重要级别对其进行编辑。 构建后,EA会记住水平,方向和地段。 当您使用计算的价格触摸当前价格时,一个预先选择的参数的订单被打开。 您可以从不同的时间框架中构建和存储多达10个多向水平。 您可以在任何交易工具上使用它。 它与4和5位数的价格正常工作。 您可以从多个交易线创建交易策略,用于交易通道的细分和从中反弹。 您可以设置一个周期,如果市场价格未触及,交易线的所有设置将被删除。 为了方便计算趋势目标,有一个内置的Fibo标尺,设置水平和颜色,但由于事件处理的特殊性,这个功能在测试期间不起作用。

[描述]
入口点指示器将向上/向下箭头显示为买/卖的入口点。该信号基于EMA,MACD和价格走势。
红色箭头表示这是一个很好的出售机会。 绿色箭头表示这是购买的好机会。 [警告和建议]
交易外汇和杠杆金融工具涉及重大风险,并可能导致您投资资本的损失。您不应投资超过承受的损失,并应确保您完全了解所涉及的风险。交易杠杆产品可能并不适合所有投资者。 过去的表现并不能保证将来的结果。 没有人可以预测未来,但是我们只能分析历史数据以构建成功的预测系统。 风险管理非常重要。 建议在具有真实账户的指标之前,先在模拟账户上测试指标。 建议使用止损,尾随止损和带有盈亏平衡的尾随止损。 如果发生金融危机,选举,世界大战,大流行病等异常事件,不建议进行任何交易,请务必适当管理风险。
[主要特点]
红色箭头表示这是一个很好的出售机会。 绿色箭头表示这是购买的好机会。 易于使用和管理。 该指标非常简单直观,即使对于初学者也是如此。 适用于任何交易代码:外汇对,指数,商品,差价合约或加密货币。 噪音过滤。 没有重涂。 该指标显示在“图表窗口”中。 默认情况下,“声音警报”处于启用状态,因此每次出现新
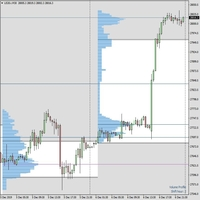
您好亲爱的商人。 我从事交易已有10年了,我认为市场概况是成功进行长期交易的一种方法,并且不会让人头痛。该系统更类似于大型机构的长期交易方式。我广泛使用它来建立标准普尔,纳斯达克,DAX等指数的累积头寸。但这对外汇专业和大宗商品也非常有用。 市场概况最早是由Peter Steidlmayer在芝加哥提出的。他意识到交易量围绕某些价格水平分布,形成了高斯曲线。高斯曲线是数学家高斯引入的,用于研究误差的分布,它是当今使用最广泛的概率模型来预测许多现实生活中的现象,例如天气预报。如果您想进一步研究该主题,我将很乐意向您发送PDF“关于市场的思想”以及其他详细解释“市场概况”的书。如果您购买指标,我也可以只推荐您关于Market Profile的非常好的在线课程。 市场概况将在图表上追踪累计成交量的水平,并将每个最终的成交量峰值标记为“控制量点”,这些价格在将来变得非常合理。观察价格动作如何在这些大交易量形成时发生变化,我们可以预测,如果价格再次回到这些水平,则很有可能至少反弹一些点(例如10至15点)。
市场概况具有自己的时间表,即每日,每周或每月,建议与以下时间表配置一起使用: M30

Check it out and if you like it just enjoy it. Try various values to find the setting that best suits your trading. Upward signal if the indicator is colored lawn green and bearish signal if the indicator is gray. You can use the line itself to trailing stop when you open orders. This is just a tool. A complement. It is not a strategy. Combine it with your own analysis Just download it and try it, it's free.
FREE

Trading is about waiting for the right time. This indicator was created to know what is happening on our charts without having to cover the screen with indicators. In addition, it has several types of alerts that allow us to dedicate our time to other things until something interesting happens. You can use multiple alarms at the same time. It is not a problem.
By default AlterAlert offers us alerts when the following indicators give us a signal:
Moving average (MA crosses) Stochastic Oscill
FREE

Excellent dashboard for market analytics. The panel helps to analyze the values of the Ichimoku indicator and its signals.
With this panel you can: watch the current signal from Ichimoku on all timeframes; watch the current signal from Ichimoku for different symbols; watch the current Ichimoku value; several types of signals for analytics.
Values in a table cell:
Value of Tenkan-Sen Value of Kijun-Sen Value of Senkou Span A Value of Senkou Span B Value of Chikou Span Span A -

这个多时间框架和多符号指示器提醒 Heiken Ashi 平滑颜色变化。作为奖励,它还可以扫描赫尔移动平均线趋势(颜色)的变化。结合您自己的规则和技术,该指标将允许您创建(或增强)您自己的强大交易系统。 特征
可以同时监控您的市场报价窗口中可见的所有交易品种。将该指标仅应用于一张图表,并立即监控整个市场。 可以监控从 M1 到 MN 的每个时间范围,并在识别出颜色变化时向您发送实时警报。支持所有 Metatrader 本地警报类型。 该指示器包括一个交互式面板。当您单击面板中的信号时,将打开带有相关交易品种和时间范围的新图表。请看下面的截图。 选择延迟一个或多个条形的警报以确认颜色(趋势)变化。 该指标可以将信号写入一个文件,EA 可以使用该文件进行自动交易。比如 这个产品 。
输入参数
输入参数的描述和解释可以在 这里 找到。 重要的
请注意,由于具有多功能性,既不会在安装指标的图表上绘制买入/卖出建议,也不会绘制线条和箭头。强烈建议将指标放在干净(空)图表上,不要在其上放置任何其他可能干扰扫描仪的指标或智能交易系统。

Trading is about waiting for the right time. This indicator was created to know what is happening on our charts without having to cover the screen with indicators. In addition, it has several types of alerts that allow us to dedicate our time to other things until something interesting happens. You can use multiple alarms at the same time. It is not a problem. By default AlterAlert offers us alerts when the following indicators give us a signal:
Moving average (MA crosses) Stochastic Oscillat

Hello, >>>>> Download ** FREE TRIAL** from here (You can now perform forward test on DEMO account before Purchase) <<<<<< Discord group for updates and discussion here Telegram channel here Contact Directly here For Live Results of the EA please visit here .
PS Gold Miner is an automatic trading system for MT4 which uses markets fundamentals and trends to open, manage and close trades. With the use of advanced recovery strategy it ensure that it can recover from negative trades with hed

Description
Range Detector is an indicator that identifies ranges in the market and displays their presence on the price chart.
Recommendations
You can use this indicator to determine the flet and, accordingly, to determine the direction of opening a position or closing an opposite position.
Parameters
Maximum History Bars - maximum number of history bars for calculating the indicator. Average True Range Period - ATR indicator period (used to calculate the difference between mov

KT Renko Patterns scans the Renko chart brick by brick to find some famous chart patterns that are frequently used by traders across the various financial markets. Compared to the time-based charts, patterns based trading is easier and more evident on Renko charts due to their uncluttered appearance.
KT Renko Patterns features multiple Renko patterns, and many of these patterns are extensively explained in the book titled Profitable Trading with Renko Charts by Prashant Shah. A 100% automate
Description: AdaptiveGrid is an expert advisor self adaptive that uses price action and grid techniques.
It has very few parameters, making it easy to use.
It has a statistics information panel in the left corner of the graph. It has informative texts of the positions in the right corner of the graph. Open positions will be closed automatically by the expert or manually via the "Close All" button, if desired. Main Parameters: - MONEY AND RISK MANAGEMENTS
Maximum Balance Loss in Percentage

The automated trading system is developed based on the "Comfort Range" theory. According to this theory, the chart of each trading instrument has its own dynamically changing range of movement.
The skill of determining such a range allows you to use this information as a leading indicator and predict price movement in the near future.
The Rapture Expert Advisor determines the "Comfort Range" of the trading instrument and works in the direction of the expected future movement.
The EA does

WhipGold AI - Expert Advisor
Tthe famous gold trading expert, now available in Market MQL5!!! . This is one of the best EA for scalping in XAUUSD (Gold)
Characteristics
- This strategy works very well on Gold (You can do your own tests on other pairs but we recommend use it on XAUUSD) - It's very stable in trends or ranging , this is one of the weaknesses of almost all robots. If they work well in trends they are weak in range times; or if they work well in range they are weak in trend

SALE: -50% FOR A WEEK The Expert Advisor works with the EUR / USD currency pair. Trades are opened almost every day during the opening of the London Stock Exchange. The robot does not use indicators. To protect the account from trading when the spread is widening, the MaxSpread parameter has been added, in which you specify the maximum allowable spread for trading. It is extremely important to adjust the "OpeningOfTheLSE" parameter to suit your time. In it, you must indicate the opening time of

FXC iRSI-DivergencE MT4 指示符
這是一個高級RSI指標,可找到當前交易品種上的趨勢轉折差異。 該指標將RSI和價格走勢之間的背離檢測為強烈的趨勢轉變模式。
主要特點: 高級發散設置
價格基於收盤價,開盤價或最高價/最低價 發出買/賣開放信號
推送通知
郵件發送
彈出警報
可定制的信息面板
輸入參數: RSI Period: RSI指標的周期大小。
RSI Applied Price: RSI指標的適用價格。 可以是:關閉,打開,高,低,中位,典型,加權。
Symbol Applied Price: 當前符號的適用價格。 可以是:關閉,打開,低(B)/高(S)。
Minimum A-B Price Movements (pip): 確定差異的A點和B點之間的最小價格變動。
Minimum A-B RSI Movements (point): 確定散度的A點和B點之間的最小RSI值移動。
Minimum Bars Between A' and B' (bars): A點和B點之間允許的最小條形數量。
Maximum Bars Betw

This indicator calculates buy and sell signals by using MACD indicator on two timeframes. MACD is a trend-following showing the relationship between two moving averages of the closing price. The MACD is calculated by subtracting the 26-period Exponential Moving Average (EMA) from the 12-period EMA.The result of that calculation is the MACD line. A nine-day EMA of the MACD called the "signal line".
This indicator has 2 modes to calculate the buy/sell signals: - MACD crosses 0 line - MACD cro
FREE
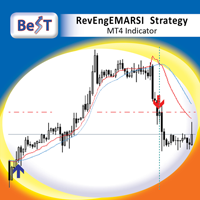
BeST_RevEngEMARSI Strategy is an MT4 Indicator that is based on the indicator RevEngEMARSI by Giorgos Siligardos that was presented in his article " Reverse Engineering RSI (II) " ( TASC_Aug 2003 ) as a new variation of his inverse-RSI indicator and which transforms the Exponential moving average of RSI into a curve in the price graph, simplifying the price projection method and improving its visual representation. BeST_RevEngEMARSI Strategy while implementing the crossings with its Moving Aver

Genaral: Not martingale, not a grid; Use on EURUSD Use on M5
Signals: There is a good rational algorithm. Work of two indicators: CCI and OsMA (from 2 timeframes) (you can set a separate Timeframe for each indicator)
Stop Loss/Take Profit: There is a good money management system (there are several type for trailing stop loss); There is virtual levels of Stop Loss / Take Profit; There is smart lot (percent by risk) or fix lot
Important: EA can work on closed candles, and on current can
FREE

Detailed article about the work of the advisor . The strategy is based on technical analysis. It is based on the technical signal divergence. Divergence is searched for using the MACD oscillator and the Price deviation MA indicator. The main feature is the consistency and stability of the strategy, which is confirmed by 20 years of history tests. Advantage: multicurrency. The Expert Advisor is suitable for any instrument, while launching 15-20 instruments and preferred timeframes on one chart at
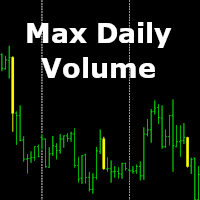
Do you want to trade like a pro? Buy where the professional buys and sell where the professional sells! Our indicator shows the most controversial and heated moment of the day! A moment of the day where a lot of money was loaded in the market and for this "Treasure" the further struggle will go!
And so, the indicator shows the bar in which there was the maximum struggle between the buyer and the seller for the past day, and it is this bar, or its extremes, or itself as a whole, becomes an imp
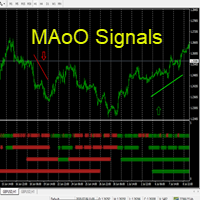
Hello This Indicator will draw Green (Up) and Red (Down) small arrows from Multi TimeFrames based in ( moving average of oscillator) to help you to take decision to buy or sell or waiting If there 4 green arrows in same vertical line that's mean (Up) and If there 4 Red arrows in same vertical line that's mean (Down) and the options contain (Alert and Mobile , Mail Notifications). Please watch our video for more details https://youtu.be/MVzDbFYPw1M and these is EA for it https://www.mql5.com/en/

DYJ GlobalTradeGameTheory(ADX) 是基于 ADX 指标的EA . 它仅仅使用一个货币对某个周期图表运行EA,就能监控全部货币对信号开仓关仓。 DYJ GlobalTradeGameTheory(ADX) 推荐当+DI 是高于-DI时做多, 与当+DI是低于-DI时做空. 它还使用了 Laguerre 滤波器过滤假信号. 我们现在将对每种货币的未来应用了博弈论策略,而不是历史价格图。这是一个更高的层次。动态市场博弈理论是决定货币对开仓后结果一个关键因素,你在任何其他货币强度信号指标中都找不到的!这是一个非常独特的功能。动态市场博弈论策略是基于整个市场活动(全部35对)。 这个EA可以通过我的数学算法修正未来的损失率。 EA的新闻交易是基于经典 动态市场博弈论策略 的。您只需要从EA属性进行新闻时间和入场周期配置,其余部分由机器人自动处理。 EA默认是任何时间都能交易。3段工作时间参数是日内范围的。 例如,如果要设置从19:00 PM到05:00 AM的工作时间,则必须定义两个不同的时间间隔,例如19:00至23:59和00:00至05:00。 例如设置

DYJ GlobalTradeGameTheory(MACD) 是基于 MACD 指标的EA . 它仅仅使用一个货币对某个周期图表运行EA,就能监控全部货币对信号开仓关仓。 DYJ GlobalTradeGameTheory( MACD) 推荐当MACD线是高于信号线时做多, 与当MACD线是低于信号线时做空. 它还使用了随机指标和Laguerre 滤波器过滤假信号. 我们现在将对每种货币的未来应用了博弈论策略,而不是历史价格图。这是一个更高的层次。动态市场博弈理论是决定货币对开仓后结果一个关键因素,你在任何其他货币强度信号指标中都找不到的!这是一个非常独特的功能。动态市场博弈论策略是基于整个市场活动(全部35对)。 这个EA可以通过我的数学算法修正未来的损失率。 EA的新闻交易是基于经典 动态市场博弈论策略 的。您只需要从EA属性进行新闻时间和入场周期配置,其余部分由机器人自动处理。 EA默认是任何时间都能交易。3段工作时间参数是日内范围的。 例如,如果要设置从19:00 PM到05:00 AM的工作时间,则必须定义两个不同的时间间隔,例如19:00至23:59和
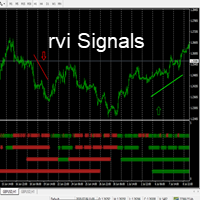
Hello This Indicator will draw Green (Up) and Red (Down) small arrows from Multi TimeFrames based in ( Relative Vigor Index ) to help you to take decision to buy or sell or waiting If there 4 green arrows in same vertical line that's mean (Up) and If there 4 Red arrows in same vertical line that's mean (Down) and the options contain (Alert and Mobile , Mail Notifications). Please watch our video for more details https://youtu.be/MVzDbFYPw1M and these is EA for it https://www.mql5.com/en/market/
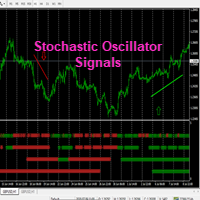
Hello This Indicator will draw Green (Up) and Red (Down) small arrows from Multi TimeFrames based in ( Stochastic oscillator ) to help you to take decision to buy or sell or waiting If there 4 green arrows in same vertical line that's mean (Up) and If there 4 Red arrows in same vertical line that's mean (Down) and the options contain (Alert and Mobile , Mail Notifications). Please watch our video for more details https://youtu.be/MVzDbFYPw1M and these is EA for it https://www.mql5.com/en/ma
DYJ GlobalTradeGameTheory(WPR) 是基于 WPR 指标的EA . 它仅仅使用一个货币对某个周期图表运行EA,就能监控全部货币对信号开仓关仓。 WPR 推荐 指标值介于80%和100%之间,表明市场超卖。 指标值介于0到20%之间,表示市场超买。 它还使用了 Laguerre 滤波器过滤假信号. 我们现在将对每种货币的未来应用了博弈论策略,而不是历史价格图。这是一个更高的层次。动态市场博弈理论是决定货币对开仓后结果一个关键因素,你在任何其他货币强度信号指标中都找不到的!这是一个非常独特的功能。动态市场博弈论策略是基于整个市场活动(全部35对)。 这个EA可以通过我的数学算法修正未来的损失率。 EA的新闻交易是基于经典 动态市场博弈论策略 的。您只需要从EA属性进行新闻时间和入场周期配置,其余部分由机器人自动处理。 EA默认是任何时间都能交易。3段工作时间参数是日内范围的。 例如,如果要设置从19:00 PM到05:00 AM的工作时间,则必须定义两个不同的时间间隔,例如19:00至23:59和00:00至05:00。 例如设置新闻时间是19:59 到

DYJ GlobalTradeGameTheory(Alligator) 是基于 Alligator 指标的EA. 它仅仅使用一个货币对某个周期图表运行EA,就能监控全部货币对信号开仓关仓。 Alligator 推荐 市场进入条件: 多头: Lips#1 > Teeth#1 与 Teeth#1 > Jaws#1 空头: Lips#1 < Teeth#1 与 Teeth#1 < Jaws#1 它还使用了 Laguerre 滤波器过滤假信号. 我们现在将对每种货币的未来应用了博弈论策略,而不是历史价格图。这是一个更高的层次。动态市场博弈理论是决定货币对开仓后结果一个关键因素,你在任何其他货币强度信号指标中都找不到的!这是一个非常独特的功能。动态市场博弈论策略是基于整个市场活动(全部35对)。 这个EA可以通过我的数学算法修正未来的损失率。 EA的新闻交易是基于经典 动态市场博弈论策略 的。您只需要从EA属性进行新闻时间和入场周期配置,其余部分由机器人自动处理。 EA默认是任何时间都能交易。3段工作时间参数是日内范围的。 例如,如果要设置从19:00 PM到05:00 AM的工作
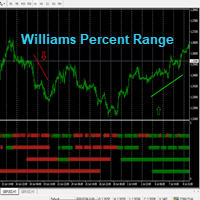
Hello This Indicator will draw Green (Up) and Red (Down) small arrows from Multi TimeFrames based in ( Williams Percent Range ) to help you to take decision to buy or sell or waiting If there 4 green arrows in same vertical line that's mean (Up) and If there 4 Red arrows in same vertical line that's mean (Down) and the options contain (Alert and Mobile , Mail Notifications). Please watch our video for more details https://youtu.be/MVzDbFYPw1M and these is EA for it https://www.mql5.com/e
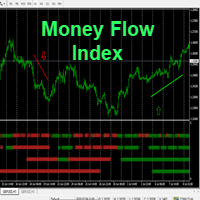
Hello This Indicator will draw Green (Up) and Red (Down) small arrows from Multi TimeFrames based in ( Money Flow Index ) to help you to take decision to buy or sell or waiting If there 4 green arrows in same vertical line that's mean (Up) and If there 4 Red arrows in same vertical line that's mean (Down) and the options contain (Alert and Mobile , Mail Notifications). Please watch our video for more details https://youtu.be/MVzDbFYPw1M and these is EA for it https://www.mql5.com/en/market/p
The EA trades at the beginning of the London session. This non-indicator trading strategy is based on the price movement of a currency pair during that day, the previous day and the entire previous week. The Expert Advisor is equipped with partial closing of a trading lot, a spread filter. The recommend
您知道为什么MetaTrader市场是出售交易策略和技术指标的最佳场所吗?不需要广告或软件保护,没有支付的麻烦。一切都在MetaTrader市场提供。
您错过了交易机会:
- 免费交易应用程序
- 8,000+信号可供复制
- 探索金融市场的经济新闻
注册
登录