 MetaTrader 5
 专家
专家
 指标
指标
 程序库
程序库
 实用工具
实用工具
 窗口小部件
窗口小部件
 规则
规则
适用于MetaTrader 4的新EA交易和指标 - 347
 EA交易自动执行市场交易,而指标可使您更准确地分析报价并预测价格行为。
通过这些应用程序,您将能够更明智地在MetaTrader 4执行交易,抓住更多的交易机会。
EA交易自动执行市场交易,而指标可使您更准确地分析报价并预测价格行为。
通过这些应用程序,您将能够更明智地在MetaTrader 4执行交易,抓住更多的交易机会。 
Friends, join us!
Ask questions and connect with like-minded traders: MetaCOT Public Group
MetaCOT Information Channel: news, CFTC reports, and signals: MetaCOT Channel
Here’s to successful trading and new profitable signals for us all! Attention! Recently, certain countries have been blocking access to the cftc.gov website. As a result, users in these countries are giving the product low ratings. MetaCOT has always adhered to the highest quality standards and is in no way associated with th
This is a medium-term conservative system. It tracks quote movements and defines entry points. The Expert Advisor is completely automated and features the unique algorithm. It has been designed for trading AUDUSD and is based on a range trading strategy. Extreme levels are defined based on history, and the EA starts trading expecting a roll-back. Two limit orders are set in case the price moves further. This product continues the EA Permanent series. Dynamic incoming data filtration method is us
This is a medium-term conservative system. It tracks quote movements and defines entry points. The Expert Advisor is completely automated and features the unique algorithm. It has been designed for trading EURCHF and is based on a range trading strategy. Extreme levels are defined based on history, and the EA starts trading expecting a roll-back. Two limit orders are set in case the price moves further. This product continues the EA Permanent series. Dynamic incoming data filtration method is us

设置止损,获利,追踪止损,盈亏平衡,启用虚拟止损。
Exp Assistant 将帮助您组织职位维护。 此EA交易将为您的头寸设置所有必要的止损和获利水平。 所有Expert Advisor操作都通过图表上的控制面板进行管理。 如果您有未平仓头寸,但您的EA交易无法设置止损,获利,追踪止损或盈亏平衡,如果您手动交易,您可以使用助理。它将自动为您的交易设置止损并获利,将在需要时开启追踪止损或止损至盈亏平衡。它还具有基于抛物线Sar指标的追踪止损。 MT5版本
详细描述 +DEMO +PDF 如何购买
如何安装
如何获取日志文件 如何测试和优化 Expforex 的所有产品 我們助手的9個主要功能 - 開盤買賣; 安裝止損/獲利; 啟用追踪止損; 包括盈虧平衡; 拋物線尾隨停止; 虛擬止損和獲利; 虛擬追踪止損和盈虧平衡; 顯示當前條的結束時間; 顯示有關帳戶的有用信息;
只需在实时图表上单击交易,即可下载 MetaTrader 4的 实用程序 VirtualTradePad 和 MetaTrader 5的VirtualTradePad For strat
FREE

Elliott Wave Counter 是一个面板,用于快速和用户友好地手动标记 Elliott 波浪。可以选择一种颜色和一个级别的标记。还有用于删除最后一个标记和工具制作的整个标记的功能。一键制作标记。点击五次 - 有五波!艾略特波浪计数器对于艾略特波浪的初学者和专业分析师来说都是一个很好的工具。 艾略特波浪计数器安装和输入指南 如果你想得到 关于 EA 添加 URL ( http://autofxhub.com ) MT5 终端的 通知 (见截图)。 MT4版本 https://www.mql5.com/en/market/product/14016 MT5版本 https://www.mql5.com/en/market/product/15081 一般输入: 波形类型按钮: 此按钮允许用户选择他们想要在图表上突出显示的波形类型。可用的选项包括推动波、调整波和其他自定义波模式。 波级按钮: 这个按钮 允许用户选择他们想要在图表上突出显示的波形级别。可用的选项包括初级、中级和次级波级别。 波浪颜色: 这个 按钮 允许用户选择他们想要在图表上突出显示的波浪图
该指标允许您确定当前的价格方向和市场波动。此版本的交易者动态指数消除了历史数据的重绘,优化了算法计算速度,更多的外部参数进行了更精确的调整,并扩展了其功能:增加了初始振荡器的选择和平均线的平滑方法. 参数: Mode Osc - 估计振荡器选择 Period Osc - 所用振荡器的计算周期 Price Osc - 振荡计算的应用价格 Osc volatility bands period - 振荡器的波动周期 Osc volatility bands multiplier - 振荡器的波动率乘数 Smoothing Osc price line period - 主线平滑期 Smoothing Osc price line method - 主线的平滑方法 Smoothing Osc signal line period - 信号线的平滑周期 Smoothing Osc signal line method - 信号线的平滑方法 Use original levels - 允许添加指标的初始水平水平
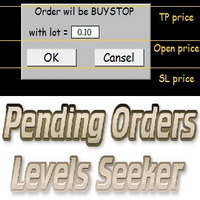
This script is designed for quick and precise placement of pending orders. Just drag and drop it on the chart. Select the position for Open price, TP price and/or SL price. Pending Orders Levels Seeker understands what kind of pending orders you want to place. It warns you if there are incorrect values in Open price, TP price or SL price. Lot can be changed from the panel of the script only at the first launch or if you want to set a new value for it. The script remembers the lot size of the las

The indicator displays the signals of the RSX Oscillator. The main type of signal is given when the oscillator exceeds the 0 value. If the "Sensitivity" parameter increases above zero, the main signal will also be given when overbought/oversold levels are overcome, defined as zero plus sensitivity and zero minus sensitivity. An additional signal is given when the direction of the oscillator line changes. It is optimal to use the indicator signals as signals to open a trade when the price overcom
FREE

The indicator looks for market sentiment impulses and notifies traders accordingly. The indicator can notify of a detected impulse via a sound or alert, as well as emails. You can select the color and display type for bullish and bearish moods. Mood arrow appears on the current bar and remains intact after the bar is formed provided that the bar forming conditions have not changed. At least 100 history bars are required for the indicator operation.
Inputs Period - period of the indicator calcul

Friends, join us!
Ask questions and connect with like-minded traders: MetaCOT Public Group
MetaCOT Information Channel: news, CFTC reports, and signals: MetaCOT Channel
Here’s to successful trading and new profitable signals for us all! Attention! Recently, certain countries have been blocking access to the cftc.gov website. As a result, users in these countries are giving the product low ratings. MetaCOT has always adhered to the highest quality standards and is in no way associated with th
FREE
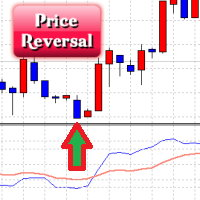
The Price Reversal oscillator identifies the potential price reversal points, while being in the overbought/oversold zones. It also displays the entry signals against the trend (sometimes these points coincide with the beginning of a new trend) (blue and red zones) and the entry points by the trend (gray areas). It consists of two lines. The blue line is the fast line, the red line is the slow one. The market entry is recommended if the value of the fast line is greater than 60 or less than -60,

The indicator displays the standard price deviation from the root mean moving average line in the additional window. The screenshot displays the standard indicator (the lower one) and SqrtDev (the upper one).
Parameters SqrtPeriod - root mean line and standard deviation period. SqrtPrice - applied price (drop-down list). BarsCount - amount of processed bars (reduces the download time when applying to a chart and using in programs).

This indicator depends on High and Low price of Currency in last Month and then i made some secret equations to draw 10 lines.
Features You will know what exactly price you should enter the market . You will know when to be out of market. You will know you what should you do in market: Buy Sell Take profit and there are 3 levels to take your profit Support Resistance Risk to buy Risk to Sell
Signal Types and Timeframe Used You can use this indicator just on H4 timeframe and you have to downloa

Friends, join us!
Ask questions and connect with like-minded traders: MetaCOT Public Group
MetaCOT Information Channel: news, CFTC reports, and signals: MetaCOT Channel
Here’s to successful trading and new profitable signals for us all! Attention! Recently, certain countries have been blocking access to the cftc.gov website. As a result, users in these countries are giving the product low ratings. MetaCOT has always adhered to the highest quality standards and is in no way associated with th

This indicator depends on High and Low price of currency in the last day, and then I made some secret equations to draw 10 lines.
Features You will know what exactly price you should enter the market. You will know when to be out of market. You will know what you should do in market: Buy Sell Take profit, and there are three levels to take your profit Support Resistance Risk to buy Risk to sell
Signal Types and Timeframes Used You can use this indicator just on (M1, M5, M15, M30, H1) timeframe

The indicator displays peak levels of activity formed by the maximum volume, tracks the correlation of the candles on all timeframes (from the highest to the lowest one). Each volume level is a kind of key trading activity. The most important cluster is inside a month, week, day, hour, etc.
Indicator operation features A volume level receives Demand status if the nearest volume level located to the left and above has been broken upwards. A volume level receives Supply status if the nearest volu

The Quantum VPOC indicator has been developed to expand the two dimensional study of volume and price, to a three dimensional one which embraces time. The volume/price/time relationship then provides real insight to the inner workings of the market and the heartbeat of sentiment and risk which drives the price action accordingly. The Quantum VPOC indicator displays several key pieces of information on the chart as follows: Volume Profile - this appears as a histogram of volume on the vertical pr

The indicator detects and displays М. Gartley's Butterfly pattern. The pattern is plotted by the extreme values of the ZigZag indicator (included in the resources, no need to install). After detecting the pattern, the indicator notifies of that by the pop-up window, a mobile notification and an email. The pattern and wave parameters are displayed on the screenshots. The default parameters are used for demonstration purposes only in order to increase the amount of detected patterns.
Parameters z

The Trend Scanner trend line indicator displays the trend direction and its changes. The indicator works on all currency pairs and timeframes. The indicator simultaneously displays multiple readings on the price chart: the support and resistance lines of the currency pair, the existing trend lines, the Highs and Lows of the price, as well as the current direction of the trend. The indicator generates accurate signals, which allow opening trades following the trend. The blue dots on the chart i

The Expert Advisor of the Forex Fraus family, the system is designed for scalping the EURUSD M1 (for five-digit quotes) and adapted for the accounts with fast execution of orders.
Operation Principle Buys when passing 100% of the bearish candle volume and sells when passing 100% of the bullish candle volume; When a signal is received, the orders are opened by injection, using tick data; Positions are closed by Trailing Stop; Not closed positions are closed at the opposite trade; Built-in adjust

Chappie is a smart adaptable robot, Chappie trades based on multiple trading systems using pending orders, the robot manipulates the pending orders, following the price movement of the market and calculates the price movement for the most accurate market entry. Basic EA settings are calculated for EURUSD. Over 1000 tests have been performed on real and history data with 99.9% quality. Chappie is a result of a long term development. The main idea is to preserve capital through unexpected fluctuat

This indicator depends on High and Low price of Currency in last Week and then i made some secret equations to draw 10 lines.
Features: You will know what exactly price you should enter the market . You will know when to be out of market. You will know you what should you do in market: Buy Sell Take profit and there are 3 levels to take your profit Support Resistance Risk to buy Risk to Sell
Signal Types and Frame used: You can use this indicator just on H4 frame and you have to download the h

The Expert Advisor trades by two Moving Average lines. There are also two types of order closing: 1) if there is an opposite signal, 2) closing order by take profit, stop loss, and trailing stop. You can configure Moving Average indicators.
Key Advantages Ability to work with fixed lot and MM. Six trailing stop modifications. Easy to use. Two types of order closing. The EA works with all brokers.
Parameters General Order Type – trade directions. Use_Risk_MM – if true , lot size is increased wh
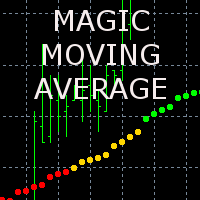
The indicator displays the averaged value of the moving averages of the current and two higher timeframes with the same parameters on the chart. If the moving averages are located one above the other, the resulting one is painted in green, showing an uptrend, in the opposite direction - red color (downtrend), intertwined - yellow color (transitional state)
The indicator parameters MaPeriod - moving average period MaMethod - moving average method (drop-down list) MaShift - moving average shift M
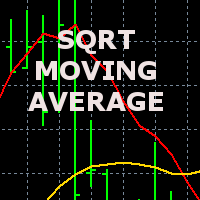
The indicator displays the price movement on the chart, which is smoothed by the root mean square function. The screenshot shows the moving average with period 20, the smoothed root mean square (red) and simple SMA (yellow).
The indicator parameters MAPeriod - Moving average period MaPrice - applied price (drop down list, similar to the standard MovingAverage average) BarsCount - number of processed bars (reduces download time when attaching to the chart and using in programs).

一键式分析工具是 基于键盘快捷键的对象创建 和 MetaTrader 的复制工具。只需单击一下,即可轻松使用 MetaTrader 中的分析工具。使用我们的工具,您可以在图表上快速绘制支撑和阻力位、斐波那契位、形状、通道、趋势线和所有其他对象。只需单击按钮,移动鼠标,一键式分析工具将为您完成剩下的工作。这可以节省您的时间并使您的图表分析更有效率,让您可以专注于根据您的分析做出明智的交易决策。 除了对象创建之外,一键式分析工具还包括 对象复制器 ( c hart sync) ,允许您轻松地将对象从一个图表复制到另一个图表。如果您打开了多个图表并且需要在它们之间复制对象,这会特别有用。 一键式分析工具允许您 对所有符号使用一个图表 在元交易者中。这意味着您可以在同一窗口中查看不同的图表,而无需在多个图表之间切换。当您切换到不同的符号时,一键式分析工具会自动从其他符号中隐藏对象,并在您返回第一个符号时再次显示它们。这可以帮助您节省时间并提高交易效率,让您可以轻松地在同一窗口上比较和分析不同的图表。 一键分析 安装和输入指南 如果您想获得有关 EA 添加 U

The indicator displays market profiles of any duration in any place on the chart. Simply create a rectangle on the chart and this rectangle will be automatically filled by the profile. Change the size of the rectangle or move it - the profile will automatically follow the changes.
Operation features
The indicator is controlled directly from the chart window using the panel of buttons and fields for entering parameters. In the lower right corner of the chart window there is a pop-up "AP" button

The Market Follower indicator displays two types of potential entry points on the chart (by trend and absolute reversal points). The entry point by the trend is displayed by a circle. The indicator qualifies the presence of a trend at a certain interval by a certain algorithm. Then it displays a potential entry point after a rollback (correction). For the successful use of these entry points, it is recommended to use at least M30 timeframe with a confirmation on smaller timeframes. The Absolute

The Expert Advisor of the Forex Fraus family, the system is designed for scalping the EUR/USD pair on the M1 timeframe (for five digit quotes), and adapted for the accounts with fast execution of orders.
Operation Principle Buys at the extreme Lows and sells at the extreme Highs of the Stochastic indicator values. When a signal is received the orders are opened by injection, using tick data. Positions are closed by Trailing Stop Not closed positions are closed at the opposite trade Built-in adj
FREE

EA Innovative PRO is a fully automated EA for Forex trading. It is based on three combined adaptive algorithms. Follows the movement of market price. It was backtested and optimized using real ticks with 99,9% quality. The Expert Advisor has successfully passed the stress test with slippage and commission approximate to the real market conditions. The EA eliminates the extra noise and chooses the most convenient strategy for trading. Dynamically places trailing stop and moves profit to breakeven
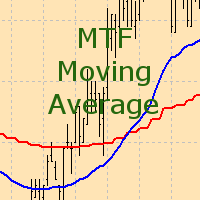
The indicator displays the moving average of a higher timeframe on the chart.
The indicator parameters TimeFrame - time frame of the moving average (drop-down list) MaPeriod - moving average period MaMethod - moving average method (drop-down list) MaShift - moving average shift MaPrice - moving average price (drop-down list)
The indicator displays the data of the Average True Range (ATR) from a higher timeframe on the chart. It allows you to see the scope of the movement without having to switch to another screen terminal
The indicator parameters TimeFrame - time frame of the data (drop-down list) can not be lower than current AtrPeriod - period of the Average True Range indicator a higher timeframe range
The indicator displays the data of the standard ADX indicator from a higher timeframe on the chart. Several indicators with different timeframe settings can be placed on a single chart.
The indicator parameters TimeFrame - time frame of the data (drop-down list) can not be lower than current AdxPeriod - period of the indicator for a higher timeframe AdxPrice - prices for the calculation of the indicator data from a higher timeframe

This indicator depends on Fibonacci lines but there is a secret lines i used them, by using FiboRec indicator you will be able to know a lot of important information in the market such as:
Features You can avoid entry during market turbulence. You can enter orders in general trend only. You will know if the trend is strong or weak.
Signal Types and Frame used You can use this indicator just on H1 frame. Enter buy order in case Candle break out the square area and closed over it, at least 20 pi

IceFX VelocityMeter Mini is a very unique indicator on MetaTrader 4 platform which measures the speed of the Forex market . It is not a normal volume or other measurement indicator because IceFX VelocityMeter Mini is capable to understand market speed movements which are hidden in ticks and those valuable information cannot be read in an ordinary way from the candles. The software monitors the received ticks (frequency, magnitude of change) within a specified time range, analyzes these info and

The indicator detects divergence signals - the divergences between the price peaks and the MACD oscillator values. The signals are displayed as arrows in the additional window and are maintained by the messages in a pop-up window, e-mails and push-notifications. The conditions which formed the signal are displayed by lines on the chart and in the indicator window.
Indicator Parameters MacdFast - fast MACD line period MacdSlow - slow MACD line period MacdSignal - MACD signal line period MacdPric

This EA uses most popular Indicators to test your own strategy and use it to trade. You can combine each Indicator to match your strategy. Many features included like Auto Stop Loss, Take Profit, Trailing Stop, Profit Lock, Pending Orders, Etc. Each Indicator has additional parameters eg. TimeFrame, Signal Method, Reverse Signal.
Indicators Moving Average 1/2/3 Parabolic SAR MACD Envelopes Bollinger Bands Alligator Fractals ADX Stochastic RVI RSI CCI DeMarker Momentum ATR
Additional Indicators

Follow the trail of the comet to know the development of the trend. This indicator helps you to determine the evolution of the price depending on how these astronomical objects are shown in the chart. When the comet seems to stop, it opens its tails considerably and warns us of a possible change in trend. On the contrary, when it seems to get speed (looks thin because lines of tail are grouped) demonstrates safety and continuity in trend. The head or comet nucleus will show red or green accordin
FREE

If you wish to draw Support and Resistance lines, view: daily market opening, classical pivot levels, Fibonacci pivot levels, trend lines, Fibonacci levels, the remaining time to candle closing, and current spread. If you seek to place your orders with the exact lot that meets your desired stop loss risk. If you wish to do all this and more with just one click, then this is the perfect tool to use. This tool will allow you to feel more relaxed when deciding to open orders, as well as predicting

The HeLL_Cat Expert Advisor is a powerful trading tool, suitable both for professionals and beginners. Its arsenal includes various strategies - the HeLL_Cat mode, the Safe mode and the News mode. The HeLL_Cat mode uses the adaptive trading strategy based on a neural network consisting of 4 interconnected logical cores. A distinctive feature of this mode is the strategy of partial overlap and construction of an orders grid with an adaptive lot ratio increase depending on the behavior of the mark

Currency Correlation Plus is an expensive version of the indicator. It is equipped with the signal and is more equipped than its cheaper brother. The indicator helps us understand and see a correlation. Second chart makes it easy to analyze and trade multiple currencies. On the chart, you can post multiple pairs. Type in the selected currency pair in the settings and add it to the chart.
Inputs One indicator on chart=True / two or more=False Alert Signal buy and sell for first chart and second
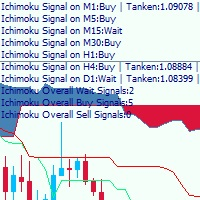
This is a multi-timeframe Ichimoku Kinko Hyo signal analyzer indicator. As you know, Ichimoku consists of 5 lines (Tenkan-sen, Kijun-sen, Chikou Span, Senkou Span A & B which create the Kumo Cloud). Ichimoku is a simple indicator like Moving Average, but the method they use makes it a very good tool in detecting market conditions and trend with which you can open trades in the best location and stay in the trade till the most profitable price. As this indicator has lots of lines and we should co

Skynet Pro Fx works with a simple strategy breaking resistance and support levels in Times Frames H1 and M30. For reliable and safe trading on charts recommend using H1. The strategy used in Skynet Pro FX is a simple strategy but the system includes many internal parameters and controls that are not user modifiable. We wanted to create it as simple as possible for all users both advanced and novice with parameters fitted to all Forex Brokers. The expert version is available only for rent because

The Expert Advisor only sells. Recommended currency pairs : EURUSD; GBPUSD; USDCHF; USDJPY; USDCAD; AUDUSD; EURGBP; EURAUD; EURCHF; EURJPY; GBPCHF; CADJPY; GBPJPY; AUDNZD; AUDCAD; AUDCHF; AUDJPY; CHFJPY; EURNZD; EURCAD; CADCHF; NZDJPY; NZDUSD. Timeframe: H1. Percent% manages closing both loss-making and profitable deals based on the account overall status. Using the EA on 23 symbols mentioned above allows the robot to cope with the drawdown in case of a long trend. While positions on some pairs

This is an innovative intelligent system consisting of 4 strategies, which detects high-probability entries for price action breakouts on the H1 timeframe. The Expert Advisor includes 3 complex technical strategies and a scalping strategy. The Expert Advisor is fully optimized and ready to use! It is possible to disable each strategy or use them all together. The EA uses a very small SL so the account is always protected from equity drawdown with a very low risk-per-trade. The potential accumula
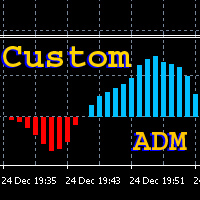
The indicator shows the direction of the current trend based on the calculation of the Average Directional Movement Index, but has two important differences from the standard ADM indicator: it presents the results as a simple and intuitive oscillator, and allows to set a custom sensitivity threshold to cut off the market noise. The histogram shows the value and sign of the difference between the +DI and -DI lines: on an uptrend the +DI is higher, the difference is positive, and its value is disp
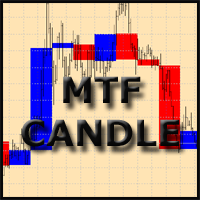
The indicator displays the data of the candles from a higher timeframe on the chart. Only the candle body (by the open and close prices) is displayed. The candlesticks are colored depending on the difference between the open and close prices. After removing the indicator from the chart, the objects used by it are deleted automatically.
Indicator Parameters TimeFrame - time frame (drop-down list) BearColor - bearish candle color (standard dialog) BullColor - bullish candle color (standard dialog
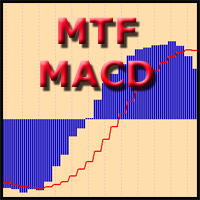
The indicator displays the data of a standard MACD indicator from a higher timeframe. The product features notifications of crossing the zero or signal line by the histogram.
Parameters TimeFrame - indicator timeframe (dropdown list) MacdFast - fast line period MacdSlow - slow line period MacdSignal - signal line period MacdPrice - price type (dropdown list) AlertCrossZero - enable notifications of crossing the zero line AlertCrossSignal - enable notifications of crossing the signal line UseNot
The indicator displays harmonic ABCD patterns, as well as the market entry points, which allows the trader to make trading decisions quickly. Harmonic ABCD Universal is one of the few indicators that predict price movement by determining pivot points with a rather high probability long before the pivot itself. It supports sending push and email notifications, as well as alerts. The indicator scans all possible combinations on the chart for the current moment, and also in history, with the help o
Object Synchronizer : Better focus/analysis of the price chart in many time frames. Are you bored to save and load template many times for the same symbol for many chart time frames? Here is the alternative. With this indicator, you enjoy creating objects across many charts, you can modify the same object in any chart, you can delete the same object in any chart. All objects that you created/modified always are synchronized across all chart windows (with same symbol). Save your time, you can foc

The indicator displays the data of the Stochastic oscillator from a higher timeframe on the chart. The main and signal lines are displayed in a separate window. The stepped response is not smoothed. The indicator is useful for practicing "manual" forex trading strategies, which use the data from several screens with different timeframes of a single symbol. The indicator uses the settings that are identical to the standard ones, and a drop-down list for selecting the timeframe.
Indicator Paramet
28 symbols, multi-time frame powerful Dashboard for the full market view Customizable Buy/Sell alerts, push alerts, email alerts, and visual on-screen alerts. Marked buy/sell signals Two color trend histogram. The commodity channel index (CCI) is an oscillator originally introduced by Donald Lambert in 1980. CCI measures current price level relative to an average price level over a given period of time. CCI is high when prices are above the average price, and low when the prices are below the a
FREE

The one and only function of this indicator is to show a moment when the price trend has changed. If a Green line is crossing a Red line down up then the price trend will go up with a very high degree of probability. If a Red line is crossing a Green line down up then the price trend will go down with a very high degree of probability. The indicator can be used on any time frames and currency pairs.

The indicator is a full-fledged trading system based on four indicators. It consists of several lines indicating trend direction and power. Smooth lines mean strong trend, while broken lines indicate a weak one. Sell if the line appears above the price and buy if it appears below the price. Absence of lines indicates flat market. If the market is uncertain, there are no indications, or the line is yellow. This is a good period for closing orders or waiting for an opposite signal. The indicator h
The Flying Volume indicator is a specialized volume indicator. It deciphers the volume data after heavy proprietary number crunching. When a main signal is found Flying Volume will look for possible continuation points. The main signal is shown by arrows, the continuation points by dots. Volume indicators are most often used on higher timeframes.
Features Main Buy or Sell signals Continuation signals No repainting One signal per bar
Settings Flying Volume default settings are good enough most

The Expert Advisor contains multiple trading strategies, including news trading, use of indicators, price velocity and various built-in filters. The EA places pending orders. It has successfully completed stress testing. No Martingale No Arbitrage No any other risky strategy inside No scalping Working currency pair/timeframe: EURUSD H1. Optimized. You can adjust the Expert Advisor to any currency pair!
Key Features: It can work with a small deposit. Only pending orders. Every trade has a tight

[EA] EMAGIC is a MetaTrader (MT4) Expert Advisor designed for use with two basic currency pairs EUR/USD and GBP/USD. With individual settings, it can work very well on other currency pairs as well. The EA implements complete, fully functional and exact mechanical trading strategy, with no place for emotions. It is based on standard MT4 indicators "EMA" and "Stochastic Oscillator". The strategy is working on Timeframe M5 only. It is very easy to set up and supervise. [EA] EMAGIC has a set of uniq

EG104 EA, originally ExpandGrid, is a collection of grid styles that have been optimized by intense tests, results from demos and real accounts and results from studies and parameter variations. It is delivered with the default parameters, so the trader does not need to change them to use the EA, just drop it to the chart, enable the style setting magic number and let it play. This EA works with its default values out of the box, but flexibility has always been a priority during developing it. I
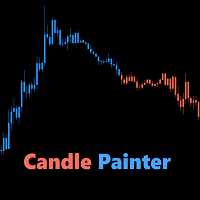
Candle Painter is a 13 in 1 indicator that paints indicators such as all the oscillators, right on top of your chart candles. You can choose from a long list of indicators and follow the trend of the colored candles, or get warned by the overbought/oversold color on the candles. Uptrend and downtrend levels can be set for the oscillators. Oscillators with main and signal lines, such as MACD, Stochastic and RVI, also have the option to follow trend by crossings. Overbought and oversold levels can

MyNewsTrader is a powerful and fully automatic EA that trades during news times. Due its heavy customization ability you can make it trade on your own your pre-defined strategy using market, stop or limit orders, advanced targets and different trail types. It is designed to run as a 'set and forget' EA meaning you don't have to type in any event times to trade, but you can also use it as a manual trader with its on chart buttons. There is built in event scanner that will look for string matches

Was: $299 Now: $99 Supply Demand uses previous price action to identify potential imbalances between buyers and sellers. The key is to identify the better odds zones, not just the untouched ones. Blahtech Supply Demand indicator delivers functionality previously unavailable on any trading platform. This 4-in-1 indicator not only highlights the higher probability zones using a multi-criteria strength engine, but also combines it with multi-timeframe trend analysis, previously confirmed swings

The SCRIPT opens , modifies , and deletes all types of orders: BUY, SELL, BUYLIMIT, SELLLIMIT, BUYSTOP, and SELLSTOP.
Features Orders can be opened both by comments and magic. Order grids. Take profit and stop loss modification. Orders can be removed by type, magic, and comments. Market orders are deleted if magic = 0. Notification window appears after orders are opened, modified or removed. Multi-task script. Modification is performed after opening orders.
Parameters Orders_Tip - consists of

The trading system utilizes a real breakout strategy with an intelligent calculation engine to eliminate bad signals. The EA has only been developed and optimized for EURUSD H15. We recommend choosing a broker with a fixed spread of 5 to 20 points, with a zero STOPLEVEL and five-digit quotes. You can change the settings and try other pairs for better results. Trades are always protected with STOPLOSS, Smart Trailing and Breakeven. This EA is very easy to use. No grid No martingale МetaТrader 5 v

ADX Pointer is an indicator which is based on "Average Directional Index" and draws three numbers in chart window depending on the value of ADX. In ADX Pointer you can set "ADX_Period" which is of course period of Average Directional Index and you can also set 3 levels. When ADX value exceed first level ("ADX_Level1") in chart window appears number "1", when ADX exceed second level ("ADX_Level2") appears "2" and when ADX exceed third level ("ADX_Level3") appears "3". Simple. ADX Pointer works on

Semiautomatic EA for trading based on the averaging and locking strategy. The trader sends signals for opening grids by using the buttons on the chart. The EA opens a market order, places a grid of limit orders in the same direction with lot multiplication according to specified parameters and a locking stop order in the opposite direction with the volume equal to the sum of all the previous ones. Once the price passes the specified breakeven level, the EA places a stop loss at the open price+sp

CCI Pointer is an indicator which simply draws arrows on chart window when value of CCI (from parameter CCI_Period) is above CCI_Level (red downward pointing arrow) or below negative CCI_Level (green upward pointing arrow). CCI Pointer works on all timeframes and all currency pairs, commodities, indices, stocks etc. CCI Pointer has only two parameters, CCI_Period and CCI_Level . For example, if you set CCI_Period=25 and CCI_Level=200 indicator will draw arrows for values below -200 (oversold) an
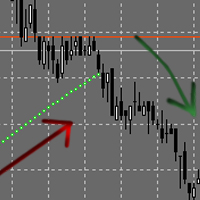
The Expert Advisor places orders based on the points of the Parabolic Sar indicator. If your trading strategy utilizes this indicator, the EA will save you from the necessity to move your pending orders after every candlestick (e.g. 5 minutes or 1 hour) and will do it automatically. You can set the EA to open only BuyStop or only SellStop or both. Buy default both Buy and Sell are enabled. The EA does not use any indicators other than Parapolic Sar. Therefore you are to decide the time to run th
FREE
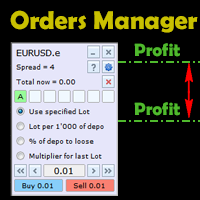
This is an irreplaceable assistant for manual trading providing maximum automation of daily routine calculations, convenient system of opening and maintaining trades and also their closure on reaching a specified adjustable level. The untility provides maximally clear and complete information on the current situation of each instrument separately and features the convenient trading panel as well as many additional functions in one program. The product works correctly with all instruments (Forex,

Searches on every symbol on MT4 MarketWatch. System Stoller% uses Williams% and StarcBands to calculate trend, entries and exits. Works only for H1 timeframe.
Input parameters: Period: Number of bars to search. Refresh_min: Number of minutes to wait between searches. ShowTrendChanges: Signals on trend changes. ExtendPeriod: Extend period to calculate signals order. UseADXFilter: Confirm entry using ADX on M15. BullColor: Font color on buy entries BearColor: Font color on sell entries.
Results

RSI Pointer is an indicator which simply draws arrows on a chart window when the value of RSI (from parameter RSI_Period) is below RSI_Level (green upward pointing arrow) or above 100-RSI_Level (red downward pointing arrow). RSI Pointer works on all timeframes and all currency pairs, commodities, indices, stocks etc. RSI Pointer has only two parameters, RSI_Period and RSI_Level . For example, if you set RSI_Period=7 and RSI_Level=20, the indicator will draw arrows for values below 20 (oversold)
MetaTrader市场是独有的自动交易和技术指标商店。
阅读MQL5.community用户备忘更多地了解我们提供给交易者的独特的服务:复制交易信号,自由职业者开发的自定义应用程序,通过支付系统完成的自动付款和MQL5云网络。
