 MetaTrader 5
 专家
专家
 指标
指标
 程序库
程序库
 实用工具
实用工具
 窗口小部件
窗口小部件
 规则
规则
适用于MetaTrader 4的新EA交易和指标 - 349
 EA交易自动执行市场交易,而指标可使您更准确地分析报价并预测价格行为。
通过这些应用程序,您将能够更明智地在MetaTrader 4执行交易,抓住更多的交易机会。
EA交易自动执行市场交易,而指标可使您更准确地分析报价并预测价格行为。
通过这些应用程序,您将能够更明智地在MetaTrader 4执行交易,抓住更多的交易机会。 
Was: $299 Now: $99 Supply Demand uses previous price action to identify potential imbalances between buyers and sellers. The key is to identify the better odds zones, not just the untouched ones. Blahtech Supply Demand indicator delivers functionality previously unavailable on any trading platform. This 4-in-1 indicator not only highlights the higher probability zones using a multi-criteria strength engine, but also combines it with multi-timeframe trend analysis, previously confirmed swings

The SCRIPT opens , modifies , and deletes all types of orders: BUY, SELL, BUYLIMIT, SELLLIMIT, BUYSTOP, and SELLSTOP.
Features Orders can be opened both by comments and magic. Order grids. Take profit and stop loss modification. Orders can be removed by type, magic, and comments. Market orders are deleted if magic = 0. Notification window appears after orders are opened, modified or removed. Multi-task script. Modification is performed after opening orders.
Parameters Orders_Tip - consists of

The trading system utilizes a real breakout strategy with an intelligent calculation engine to eliminate bad signals. The EA has only been developed and optimized for EURUSD H15. We recommend choosing a broker with a fixed spread of 5 to 20 points, with a zero STOPLEVEL and five-digit quotes. You can change the settings and try other pairs for better results. Trades are always protected with STOPLOSS, Smart Trailing and Breakeven. This EA is very easy to use. No grid No martingale МetaТrader 5 v

ADX Pointer is an indicator which is based on "Average Directional Index" and draws three numbers in chart window depending on the value of ADX. In ADX Pointer you can set "ADX_Period" which is of course period of Average Directional Index and you can also set 3 levels. When ADX value exceed first level ("ADX_Level1") in chart window appears number "1", when ADX exceed second level ("ADX_Level2") appears "2" and when ADX exceed third level ("ADX_Level3") appears "3". Simple. ADX Pointer works on

Semiautomatic EA for trading based on the averaging and locking strategy. The trader sends signals for opening grids by using the buttons on the chart. The EA opens a market order, places a grid of limit orders in the same direction with lot multiplication according to specified parameters and a locking stop order in the opposite direction with the volume equal to the sum of all the previous ones. Once the price passes the specified breakeven level, the EA places a stop loss at the open price+sp

CCI Pointer is an indicator which simply draws arrows on chart window when value of CCI (from parameter CCI_Period) is above CCI_Level (red downward pointing arrow) or below negative CCI_Level (green upward pointing arrow). CCI Pointer works on all timeframes and all currency pairs, commodities, indices, stocks etc. CCI Pointer has only two parameters, CCI_Period and CCI_Level . For example, if you set CCI_Period=25 and CCI_Level=200 indicator will draw arrows for values below -200 (oversold) an
The Expert Advisor places orders based on the points of the Parabolic Sar indicator. If your trading strategy utilizes this indicator, the EA will save you from the necessity to move your pending orders after every candlestick (e.g. 5 minutes or 1 hour) and will do it automatically. You can set the EA to open only BuyStop or only SellStop or both. Buy default both Buy and Sell are enabled. The EA does not use any indicators other than Parapolic Sar. Therefore you are to decide the time to run th
FREE
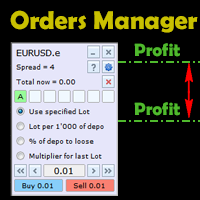
This is an irreplaceable assistant for manual trading providing maximum automation of daily routine calculations, convenient system of opening and maintaining trades and also their closure on reaching a specified adjustable level. The untility provides maximally clear and complete information on the current situation of each instrument separately and features the convenient trading panel as well as many additional functions in one program. The product works correctly with all instruments (Forex,

Searches on every symbol on MT4 MarketWatch. System Stoller% uses Williams% and StarcBands to calculate trend, entries and exits. Works only for H1 timeframe.
Input parameters: Period: Number of bars to search. Refresh_min: Number of minutes to wait between searches. ShowTrendChanges: Signals on trend changes. ExtendPeriod: Extend period to calculate signals order. UseADXFilter: Confirm entry using ADX on M15. BullColor: Font color on buy entries BearColor: Font color on sell entries.
Results

RSI Pointer is an indicator which simply draws arrows on a chart window when the value of RSI (from parameter RSI_Period) is below RSI_Level (green upward pointing arrow) or above 100-RSI_Level (red downward pointing arrow). RSI Pointer works on all timeframes and all currency pairs, commodities, indices, stocks etc. RSI Pointer has only two parameters, RSI_Period and RSI_Level . For example, if you set RSI_Period=7 and RSI_Level=20, the indicator will draw arrows for values below 20 (oversold)

Free informative Indicator-helper. It'll be usefull for traders who trade many symbols or using grid systems (Averaging or Martingale). Indicator counts drawdown as percent and currency separate. It has a number of settings: Count deposite drawdown according equity value and send e-mail or notifications to user if DD more than set; Sending e-mail when max open orders reached; Shows price and remaining pips amount before MarginCall on current chart and Account generally; Display summary trade lot
FREE

The EA opens orders using the Wolfe waves indicator, also uses the Martingale and smart Trailing Stop, Stop Loss and Take Profit. Trades are always protected with STOPLOSS, Smart Trailing and Breakeven. This EA is easy to use. The EA has proven results on EURUSD M5, however you can change the settings for better results on other currencies.
Settings Setting EA - Settings of the Advisor. Invest More - at the value 'true' the lot size increases as the account balance grows.( Risk Management ). In

The indicator automatically sets trendlines on the really important points directly on the chart. Timeframe, color and style of the lines can be adjusted. Notification of a breakout above or below the line via a smartphone is possible.
Input Parameters TimeFrame : Choose timeframe AppliedPrice : Choose close , open, high, low, median, typical or weighted price Formation : Choose swing, Shoulder head shoulder or long term formation Alerts : true = alert is on SendEmail : Send message to email ad
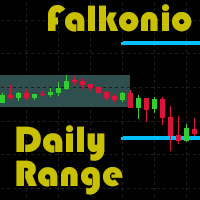
The indicator highlights the affected period taking the highest and the lowest prices into account. It is possible to choose any time period from 1 hour to 24 hours. It also optionally shows the target levels when trading at the breakout of the range in any direction. The target level value is given in percentages of the width of the previous range. The indicator is the improvement and extension of the free version . It works on timeframes from M1 to H1. It warns at the higher timeframes.
Setti

The script greatly simplifies trader's work with pending stop orders (BuyStop, SellStop). The script places any number of pending orders at a user-defined distance (in points). Order expiration time in seconds can also be specified. It is also possible to place only Buy Stop or only Sell Stop orders. All stop orders are accompanied by user-defined take profit and stop loss levels. Volume is customizable as well.
Parameters Open BuyStop - place a pending Buy order Open SellStop - place a pending
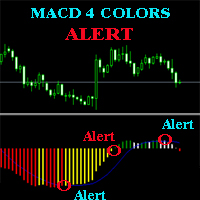
The MACD ALERT 4 COLORS is an indicator, that helps you to check MACD's value changes easily with 4 clear colors: when MACD grows up and above 0, it will have green color when MACD goes down and still above 0, it will have white color when MACD goes down and below 0 value, it will have red color when MACD grows up and below 0 value, it will have yellow color The indicator also generates alerts for you, with two alert types (see screen shot): Alert1 : (true/false) the alert will trigger when MACD

它使用称为 Swinger (Pendulum, Cheburashka) 的著名策略模型 - 交替放置增加手数的挂单。 策略在于放置两个相反的挂单。当价格向某个方向移动时,触发一个挂单,同时增加另一个订单的手数。 EA 提供三种类型的挂单(TypeofTrade)
放置后自动开仓(即时开仓AutoTrade)
手动开仓后的开仓管理(Manual opening ManualTrade)
按高/低水平开盘(过去的 TFTrade 柱线的高低) OCO(一个取消另一个)订单是一种由两个订单组成的条件订单。如果第二个订单被执行,第一个订单就会自动取消。 Swing - 完整说明 MT5 version 如何购买
如何安装
如何获取日志文件 如何测试和优化 Expforex 的所有产品 这个怎么运作?
开始时,EA 发出两个订单 - 买入止损 和 卖出止损 ,距离当前价格的距离为 StopOrderDeltaifUSE。 如果 Buy Stop 触发,则 Sell Stop 将被删除,并且将放置一个交易量为 BuyStop * Martin 的 Sel
FREE

指标 VR Calculate Martingale 是一个强大的工具,可以无风险地初步计算任何交易策略。由于该指标使用虚拟订单,交易者可以提前计算交易账户上事件的任何发展。您不再需要EXCEL表格和计算器,您不需要了解不同交易手数的多向头寸的平均公式。一切都会帮助你计算 VR Calculate Martingale. 设置、设置文件、演示版本、说明、问题解决,可以从以下位置获取 [博客]
您可以在以下位置阅读或撰写评论 [关联]
版本为 [MetaTrader 5] 该指标于 2015 年开发,旨在计算头寸网络中的交易,现已在全球范围内进行了重大更新。感谢大量的评论和建议,该指标得到了改进和更新。 计算器的基本功能 VR Calculate Martingale 创建虚拟订单,无交易风险 直接在图表上方便地编辑虚拟订单 网络上的仓位分组,最多可以创建 7 组订单 将虚拟订单附加到现有市场头寸 按订单组单独核算利润 止盈和止损水平的损益分开核算 虚拟市价订单和已平仓订单的利润分开计算 抵押品要求的计算 追加保证金水平显示 按价格和时间均匀分布持仓 能够设置您自己的存款金额、点值、

SAFETYLOCK for MetaTrader 4 是一款高级交易保护工具,可在市场突然反转时自动放置反向安全订单,从而保护已开仓位。
一旦交易者或 Expert Advisor (EA) 开立仓位, SAFETYLOCK for MT4 就会在相反方向创建对应的挂单(Buy Stop 或 Sell Stop)。 如果市场朝着原始交易的不利方向运行,该挂单将被触发并形成保护锁仓,帮助交易者控制回撤,更高效地组织恢复逻辑。 该 Expert Advisor 允许您灵活管理仓位:关闭原始交易、对已激活的安全仓位进行追踪、以更大的手数扩展锁仓,或根据市场条件组合多种安全管理方案。 SAFETYLOCK for MT4 还支持动态移动挂单价格,使保护结构能够实时跟随市场,并在价格走势变化时保持有效。 使用 SAFETYLOCK 升级您的 MetaTrader 4 保护逻辑——这是一款面向 2026 的高级解决方案,可实现更智能的锁仓、更清晰的恢复管理以及更强的交易控制。 Exp5 SafetyLock PRO for MT5 完整说明 +DEMO +PDF 如何购买
如何安装
如何

VR Alert 该实用程序以指标的形式制作,旨在告知交易者价格达到给定水平。信号电平不仅可以水平设置,还可以以一定角度设置。因此,交易者有机会接收来自倾斜趋势水平的通知。由于VR Alert实用程序,您将不再需要坐在显示器附近很长时间。你可以放心地做你的家务,履行工作职责,花时间与你的家人。你的任务是简单地设置水平,并选择通知的四种方法之一。该实用程序能够向智能手机发送警报,电子邮件,显示标准警报窗口和声音,并将图表绘制为红色。该实用程序的所有管理都是用图表上的鼠标完成的。 建议: 配置终端发送推送消息到您的智能手机,说明在博客中。 配置终端向邮件发送邮件,博客中的说明。 只需用鼠标将指标从导航器拖动到图表。您将看到指标的名称和用于设置级别的面板,启用警报。 选择要显示的行所需的向上或向下级别,然后选择通知方法。 当价格达到指定水平时,VR Alert将以选定的方式通知您。 您可以根据自己的喜好自定义该实用程序的配色方案。 该指标不能在策略测试器中工作,只需租用程序一小段时间来检查它的运行。 如果您不仅需要从当前价格接收警报,还需要从其他指标接收警报,请使用MetaTrader5和m

Was: $249 Now: $99 Market Profile defines a number of day types that can help the trader to determine market behaviour. A key feature is the Value Area, representing the range of price action where 70% of trading took place. Understanding the Value Area can give traders valuable insight into market direction and establish the higher odds trade. It is an excellent addition to any system you may be using. Blahtech Limited presents their Market Profile indicator for the MetaTrader community. Ins
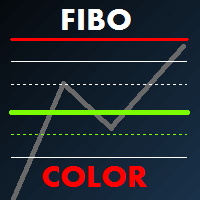
Fibo Color Levels is an amazing tool for Fibonacci lovers. You can customize your preferred values, styles and formats of each level and set the color levels according to their importance. Fibo Color Levels Not add object fibonacci retracement automatically . The purpose of this indicator is not it. So you need to manually add the Fibonacci Retracement in your chart, as usually already do. Use the standard tool Fibonacci Retracement in your MT4, draw the Fibo according to the swing-high and/or s
Volume Volatility Dashboard is a great tool for quickest possible analysis of multiple currency pairs in terms of extremely high and extremely low accumulation to distribution ratio in comparison to values from past. The number of displayed symbols is 30 and the name of each symbol can be edited in the parameters, so we are able to analyze not only predetermined currency pairs, but also other ones, commodities, equities, indices, currency pairs with prefixes and suffixes etc... This analyzer is

OBV Divergence Formation (hereinafter "Diver") is based on On Balance Volume technical indicator (OBV) that is a momentum indicator that relates volume to price change. Classic (regular) and Reversal (hidden) Divergences - at your choice. Adjustable sizes and all parameters Flexible settings including VOID levels (additional alert function, arrows on price-chart show in which direction to trade) No re-paint / No re-draw (set CalcOnOpenBar =false) "SetIndexBuffer" available for all variable
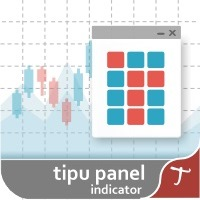
Tipu Panel series is set of innovative indicators created to consolidate indicators in form of a panel. As a trader, indicators can easily create a cluster on the chart and distract you from the bigger picture. It can also be overwhelming and visually exhausting. Tipu Panel simplifies this by displaying each indicator in a beautifully boxed panel. You can customize the panel to display indicator signals for multiple time frames and also to quickly switch time frames. There are two types of indic
FREE

Stufic is a result of the long way of development. It was created for use in the management of capital of trading groups. The main idea is to preserve capital through unexpected fluctuations of the markets. It is one of the system that can perform on 90% of currency pairs. It's a participant on World Cup Trading Championship 2016 with real 10K USD. Stufic was also between top five traders in real money contest organized by Fidelis Capital (November 2015, Gain +48%).
Why should you have to choos

The Price Action Dashboard is an innovative tool to help the trader to control a large number of financial instruments. This tool is designed to automatically suggest signals and price conditions. The Dashboard analyzes all major Time Frame suggesting price action conditions with graphic elements. The Dashboard can suggest you the strength of the trend identifying directional movement, it is an indispensable tool for those who want to open position themselves using market trends identifiers. The
RSI Alert Pro is a highly configurable RSI indicator with rich alerts and RSI level monitoring features.
Input Parameters Parameter Permitted Values Description
Use Alerts Pro Voice Synthesis module true/false Provides voice synthesized alerts for Traders with the Alerts Pro module (additional purchase required) Enable Push Notifications true/false If set to true the system will send push notifications to any MT4 mobile platform the trader is licensed for RSI Period Integer values from 1 upw
RFX Forex Strength Meter is a powerful tool to trade 8 major currencies in the Forex market, U.S. Dollar ( USD ) European Euro ( EUR ) British Pound ( GBP ) Swiss Franc ( CHF ) Japanese Yen ( JPY ) Australian Dollar ( AUD ) Canadian Dollar ( CAD ) New Zealand Dollar ( NZD )
The indicator calculates the strength of each major currency using a unique and accurate formula starting at the beginning of each trading day of your broker. Any trading strategy in the Forex market can be greatly improved b
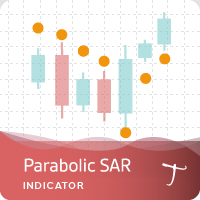
Tipu Parabolic SAR Panel is the modified version of the original Parabolic SAR indicator published by MetaQuotes here . Dashboard Panel (multi symbol) version for this indicator is available here .
Features An easy to use Panel that shows the Parabolic SAR trend and signals of selected timeframe. Customizable Buy/Sell alerts, push alerts, email alerts, or visual on-screen alerts. Customizable Panel. The panel can be moved to any place on the chart or minimized to allow more space. To enable the
FREE

Introduction The Weekly pivots indicator calculates and displays weekly pivot levels on MT4 charts. The indicator allows the trader to adjust the calculation window so that the pivots can be synchronised with the market the trader is active within. So traders looking to trade the London open or the US open can adjust the calculation basis of the pivot system so that the pivots on their chart are the same as the majority of the market participants. All the FX AlgoTrader pivot systems use HOURLY d

Introduction The Monthly pivots indicator calculates and displays monthly pivot levels on MT4 charts. The indicator allows the trader to adjust the calculation window so that the pivots can be synchronised with the market the trader is active within. So traders looking to trade the London open or the US open can adjust the calculation basis of the pivot system so that the pivots on their chart are the same as the majority of the market participants. All the FX AlgoTrader pivot systems use HOURLY

Overview This is the WOODIE version in the Verdure Pivot Trail Series. Verdure Woodie Pivot Trail plots WOODIE pivot levels for every bar on the chart. Pivot levels are great at determining turning points in the market and when period pivot levels are compared to daily pivot level, these turns can be accurately predicted and timed.
Features Dynamically calculates and draws Pivot levels for every bar on the chart (Central Pivot Point, R1, R2, R3, S1, S2 and S3) Pivot level can be used to trail p

The MACD Turbo indicator provides a highly configurable enhanced MACD indicator with histogram, push notifications, pop-up and email alerts. Traders can customize the MACD calculation parameters to meet their needs and also control the alert system based on their requirements. The alert module produces alerts when the MACD line crosses the 'Watermark' or zero level and also when the MACD and Signal lines crossover. Traders can choose the nature of the crossover modes which can be 'Printed' - whe

This indicator shows the time before the new bar or candle opens. Examples of how much is left before a new bar opens: An example for the M1 timeframe: 05 = 05 seconds. An example for the H1 timeframe: 56:05 = 56 minutes and 05 seconds. An example for the D1 timeframe: 12:56:05 = 12 hours, 56 minutes and 05 seconds. An example for the W1 timeframe: W1(06): 12:56:05 = 6 days, 12 hours, 56 minutes and 05 seconds. МetaТrader 5 version: https://www.mql5.com/en/market/product/13602 Settings color_ti

Grid Trading EA is a semi-automated one-click trading EA for both Normal Trading and Grid/Martingale Trading . Normal Trading Simply click Buy or Sell directly from the chart. The EA will automatically manage trades by: Setting Stop Loss and Take Profit Managing Trailing Stop Grid / Martingale Trading When Grid Trading mode is enabled, the EA will automatically open additional grid orders at specified distances while increasing the lot size based on your settings. Inputs & Settings Lots — Initia

BearTradeEA - is a safe MetaТrader 4 trading robot working autonomously on a VPS server or on your computer. The good results are achieved on EURUSD and other pairs, but it can work with all pair.
Trading strategy The Expert Advisor is designed for normal operation and for the reverse mode operation, does not use martingale, and can increase the deposit. The EA trades only the market orders. Trading according to the strategy is performed on H1 and H4 timeframes (as H1 and H4 timeframes are less

Limit and reverse MT4 is a flat Expert Advisor with no indicators.
Trading Strategy Limit and reverse MT4 trades any currency pair and any timeframe. The strategy is based on accompanying an open position with a trailing profit and reversing it when the trailing profit is activated. The first position is opened with the triggering of the SellLimit or BuyLimit order above and below the current price. Additional control is placing a SellStop order much below the current price - new orders cannot

Hello, I am Ayman from Egypt, I want to present an interesting indicator to you. It depends on Ichimoku Kinko Hyo, but there is a secret that i use in it. By using my indicator, you will be able to know a lot of important information in the market such as: Live Signal : https://www.mql5.com/en/signals/821024
Features You can avoid entry during market turbulence You can enter orders on the general trend only You will know if the trend is strong or weak If you entered an any orders by the help of

The Daily pivots indicator calculates and displays daily pivot levels on MT4 charts. The indicator allows the trader to adjust the calculation window so that the pivots can be synchronised with the market the trader is active within. So traders looking to trade the London open or the US open can adjust the calculation basis of the pivot system so that the pivots on their chart are the same as the majority of the market participants. All the FX AlgoTrader pivot systems use HOURLY data for their p
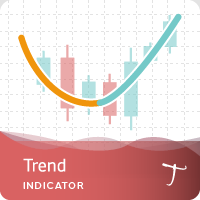
Tipu Trend is a non-lag, non-repaint, smart indicator, that shows the trend of selected time frames.
Features Customizable Buy/Sell alerts, push alerts, email alerts, or visual on-screen alerts. As easy to trade indicator that smooths the noise in the price action. Highlights ranging markets. Add Tipu Panel (found here ) and unlock the following additional features. An easy to use Panel that shows the trend + signal of the selected time frames. Customizable Panel. The panel can be moved to any
FREE
The FX AlgoTrader Advanced Moving Average Crossover Alert System is a highly configurable MT4 indicator which incorporates a fully automated alert system for monitoring two trader defined moving averages. Automatic display of fast and slow moving averages Integration with Alerts Pro package - Voice synthesized alerts system - allows complete freedom from the screen (requires Alerts Pro package) Simple, Exponential, Smoothed and Weighted Moving Average options. Configurable calculation price i.e
WindFlow HTF is a useful tool suited to use in conjunction together with my WindFlow indicator. This indicator will give you a background vision about the price action trend on a higher timeframe, so when it runs with the WindFlow indicator you have an almost complete trading solution. At this point, you only need some support/resistance analysis and a bit of focus to become a consistent trader.
The metaphorical "wind's ballet" Professional traders know that every timeframe is governed by its o
FREE
The RBCI hist indicator is an adaptive trend histogram, that eliminates noise using a Low-pass filter, which passes the lower frequencies and cuts off hight frequencies of the price fluctuations. The signal (depending on the strategy chosen by trader) is the intersection of the zero line by the indicator, as well as the change in the histogram color. The change in the histogram color serves as an early signal for opening positions towards the trend. The position of the indicator relative to the
Concept Mean reversion is a concept in trading based on prices eventually returning to their mean or average level after a period of divergence or departure from the historical mean. Traders deploying mean reversion techniques typically wait for assets to diverge significantly from their mean values and then place trades on the assumption the price will return to the mean at some point in the future- this is also known as re-coupling or convergence. There are several mean reversion based trading

The indicator displays trend strength, including showing the transition from buy to sell and visa versa. It is ideal for trend following strategies and also highlights possible reversals/flattening trend with a yellow X on the indicator window. By default, the indicator does not repaint/flicker, however, there is an option to calculate on the live candle but even then the indicator will not repaint unduly. The indicator can also be used for exit.
Usage Enter long/buy trade when the indicator tr
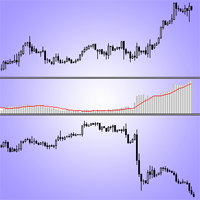
This is an indicator of trading instruments' correlation. It shows the difference of price values of two symbols. The increase in price divergence and the reduction of price divergence can be seen as signals to transactions. The indicator can be used for hedge strategies. The indicator sends Alerts and Push-notifications to the mobile app about the crossing of the moving averages of Envelopes. The indicator has a simple setup. You need to put him in the window of the traded instrument and choose
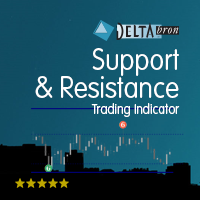
Better Support & Resistance shows the best support and resistance lines and zones. It is based on Fractals with the factor of your choice. All fractals are assembled, weighted, extended and merged into a clear set of support and resistance lines. The immediate nearby lines are shown as zones when price is in that zone. Better Support & Resistance gives you the best overview of the important price levels.
Settings Better Support & Resistance's default settings are good enough most of the time. N
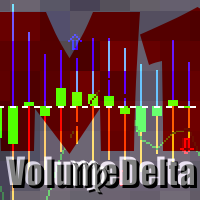
This indicator provides tick volume delta analysis on M1 timeframe. It monitors up and down ticks and sums them up as separate volumes for buys and sells, as well as their delta volumes, and volume clusters on price scale within a specified number of bars. This indicator complements VolumeDelta , which uses similar algorithms but does not process ticks and therefore cannot work on M1. VolumeDelta can show its signals on entire history because it reads M1 volumes for calculations on higher timefr
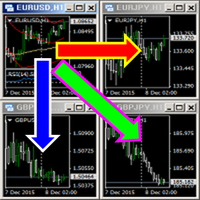
This indicator changes the timeframe and chart profile for multiple charts. If you dispatched many charts (10~20 or more) in single MetaTrader terminal, it is very boring and difficult work to manage the timeframe and chart profile individually. If the indicators you use in a chart are numerous and the setting values are different from the default one, you might give up adding all the indicators to all charts. The changing of timeframes on multiple charts has the same problem, too. Whenever you

RSI Dashboard is a great tool for quickest possible analysis of multiple currency pairs at the same time in terms of Oversold or Overbought .
All displayed and used by indicator symbols are freely to choose and are specified using a space separated list in parameters you're able to analyze not only predetermined ones, but everything that your broker offers, also commodities, equities, indices, ones with prefixes, suffixes etc.
There are 3 types of alerts: alert notifications in the MT4 termin

Interceptor - professional volume and price extremes indicator. Interceptor is a powerful indicator, which thanks to a combination of four different types of normalized indicators in one algorithm can correctly identify extremes of the price leading to retracements and reversals in the trend. Algorithm is based mainly on combination of Accumulation/Distribution , On Balance Volume , Money Flow Index and Relative Strength Index . The first parameter of Interceptor is Interceptor_Depth which defin
This is a medium-term conservative system. It tracks quote movements and defines entry points. The Expert Advisor is completely automated and features the unique algorithm. It has been designed for trading CHFJPY, EURCHF, and USDJPY.
Features It does not use Martingale; No grid; No scalping; No excessive parameters; Fixed lot; No complicated settings. Trades are usually opened infrequently. Orders may remain open for a few days for obtaining greater profit. Amount of trades per month – from 5 t
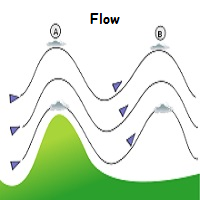
WindFlow is a powerful solution for manual traders that will drive your trading decisions in no time. I designed this indicator taking into account three main concepts: momentum, break of recent trend and volatility. Just like the wind's flow any trend can have small correction or major change in its direction based on the main trend's strength, so at glance you can have a very good idea on the next "wind's direction" when you look at your charts.
How to properly use WindFlow? WindFlow is the p

PipsMinerFast is mainly a trend follower with a bit of price action. At first sight, you will think: "Oh well, one more indi showing everything I've missed today but not giving a clue about what will happen..." Okay, you can believe this when just looking at it but start a test it and you will see that PipsMinerFast: Shows you the trend immediately Is not repainting Has minimum lagging Counts pips immediately Adapts to your spread level Works from M1 to H1 Is heading in the right direction 90% o

Divergence Formation Hurst (hereinafter "Diver") is based on Hurst exponent used as a measurement of long term memory of time series. Classic (regular) and Reversal (hidden) Divergences - at your choice. Adjustable sizes and all parameters Flexible settings including VOID levels (alert function in place, arrows to show in which direction to trade) No re-paint / No re-draw (must set CalcOnOpenBar =false) "SetIndexBuffer" available for all variables (can be used in EA) Auto-detect 4- and 5-digit p

Divergence Formation BBands (hereinafter "Diver") is based on Bollinger Bands Technical Indicator (BB). Classic (regular) and Reversal (hidden) Divergences - at your choice. Adjustable sizes and all parameters Flexible settings including VOID levels (alert function in place, arrows to show in which direction to trade) No re-paint / No re-draw (must set CalcOnOpenBar =false) "SetIndexBuffer" available for all variables (can be used in EA) Auto-detect 4- and 5-digit price function Lite (does not
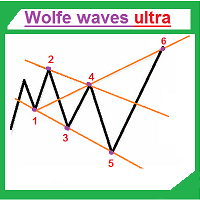
Wolfe waves ultra draws Wolfe Waves automatically. The indicator searches for the Wolfe Waves on three timeframes. This indicator is especially accurate because it waits for a breakout in the wave direction before signaling the trade, resulting in a very high winning ratio.
Features Amazingly easy to trade. The indicator is able to recognize all Wolfe Wave patterns in a specified interval. Thus, we check each extremum for the potential 1,2,3,4,5 points apart from ZigZag vertices. The indicator

The Correct Entry indicator displays specific points of potential market entries on the chart. It is based on the hypothesis of the non-linearity of price movements, according to which the price moves in waves. The indicator displays the specified points based on the price movement of certain models, and technical data.
Indicator Input Parameters: Сorrectness – The parameter characterizes the degree of accuracy of the entry signals. Can vary from 0 to 100. The default is 100. Accuracy of sig

System Introduction Fx TrendRider is an amazing EA that takes pips as easy as the market itself because it rides with the trends and masters the trend direction and market conditions as it is at any point in time.
Money Management The default lot size setting is 0.10, you can start with that first and see how it goes, then you can increase your lot according to your account balance but do not trade with the money you cannot afford to lose even though with time, you will discover that you can us
This is a medium-term conservative system. It tracks quote movements and defines entry points. The Expert Advisor is completely automated and features the unique algorithm. This demo version trades USDJPY.
Features It does not use Martingale; No grid; No scalping; No excessive parameters; Fixed lot; No complicated settings. Trades are usually opened infrequently. Orders may remain open for a few days for obtaining greater profit. Amount of trades per month is from 5 to 20. Deals are closed by T
FREE

The strategy of this Expert Advisor is based on the assumption that the price sooner or later will come out of range. You will make a profit regardless of the price direction. It is recommended to activate the EA in turbulent days or before the release of important news. Features
You will need a broker with low spreads and fast execution of orders. Testing was conducted on the pair EURUSD. Recommended maximum order size is 0.01 lots for each $150. The EA can be placed on any chart and use it

3-SMA-Spread - 通过构建可视化 iChannel(参见下面的公式)来显示 3(三)种不同工具的市场价差的跨工具指标,该 iChannel 根据每个工具的输入按比例更改其宽度(基于 SMA 的“统计套利”) 。
核心原则:每次出现差异后,跟随“它们的”符号价格的价格线不断趋向于回到“合成”中心的总和。 换句话说,由 3 个“相关”工具//对组成的系统不断努力恢复其平均值(所谓的“均值回归”效应)。
适用于任何仪器/TF(必须打开所有使用的仪器的图表/TF) 同步到位。 当前栏关闭后 -- 不重新绘制/不重新绘制 “SetIndexBuffer”适用于所有变量(可在 EA 中使用) 自动检测 4 位数和 5 位数价格 以下公式用于构建 iChannel:
价格线符号 1 - 指标打开的图表 价格线符号 2 - 加上负相关工具的“reversal=true”模式 价格线符号 3 - рplus "reversal=true" 负相关工具的模式 中线 М =“合成”中央 (S1 + S2 + S3)/3(黄色虚线) iChannel = (S1-M) + (S2-M)

3-Hull-Spread - 通过构建可视化 iChannel(参见下面的公式)来显示 3(三)种不同工具的专业跨工具指标,该通道根据每个工具的输入按比例改变其宽度(“统计套利”基于 船体MA=HMA)。
核心原则:价格线在每次出现差异后跟随“它们”符号的价格,不断趋向于回到“合成”中心的总和。 换句话说,由 3 个“相关”工具//对组成的系统不断努力恢复其平均值(所谓的“均值回归”效应)。
适用于任何仪器/TF(必须打开所有使用的仪器的图表/TF) 同步到位。 当前栏关闭后 -- 不重新绘制/不重新绘制 “SetIndexBuffer”适用于所有变量(可在 EA 中使用) 自动检测 4 位数和 5 位数价格 以下公式用于构建 iChannel:
iChannel = (S1-M) + (S2-M) + (S3-M)(红点和绿点) 中线 М =“合成”中央 (S1 + S2 + S3)/3(黄色虚线) 在哪里 价格线符号-1:指标打开的图表) 价格线符号-2(反转=真/假 - 对于具有负相关性的工具) 价格线符号-3(反转=真/假 - 对于具有负相关性的工具) 该公式允许在一
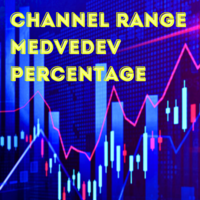
This indicator is a logical extension of the product at https://www.mql5.com/en/market/product/12526 . The only difference is that price movement is displayed using a histogram with levels, allowing to assess the direction and strength of the movement. How to interpret the signal: 0 - the middle of the channel; above 0.5 - the breakdown of the channel up; below -0.5 - the breakdown of the channel down. Both indicators are displayed in the attached screenshots. Install the indicator and you will

The Expert Advisor (EA) generates an advanced trading tool to place a pending or market order on any currency pair symbol , as selected from a drop-down menu in the panel. A market order is placed by clicking appropriate Sell or Buy button. On the other hand, a pending order is placed by selecting a pending order type and thereafter clicking Place button. Moreover, the panel provides various options to define exact parameters for every order before placing it. For instance, the triggering price

产品描述: 这是一个实现在图表上展示历史交易的指标,通过这个指标可以很直观的显示您最近所有的交易,回顾和总结您交易出现的问题,在后续的交易中可以优化和改进交易思路,避免出现类似的错误,对不断提高您的交易水平有很大的帮助,通过指标可以让您的交易变得更加清晰。这个指标可以非常灵活的进行参数定制,让您可根据自己的喜好,定制开仓和平仓点的颜色,以及盈利和亏损线的颜色,圆点的大小和线的粗细都可以根据您的喜好随意定制,在添加指标的时候可以更改,也可以编辑中更改。默认开仓的颜色是绿色,平仓的颜色是红色,盈利的订单显示蓝色的线,亏损的订单显示红色的线。默认显示的是本月的交易历史,如果想显示更多,可以自定义显示更多历史交易,此指标适合所有时间周期图表,如果您不希望一直显示交易历史,可以在图表上的指标列表里删除指标。 输入参数: CircleSize 买卖点圆圈大小,默认是7 LineWidth 交易线宽度,默认是1 BuyColor 开多单圆点的颜色,默认是绿色 SellColor 开空单圆点的颜色,默认是绿色 CloseColor 平仓圆点的颜色,默认是红色 ProfitColor 盈利订单的颜色,

Tipu Heikin-Ashi Panel is the modified version of the original Heiken Ashi indicator published by MetaQuotes here . A professional version of this indicator is available here .
Features An easy to use Panel that shows the Heiken Ashi trend of selected timeframe. Customizable Buy/Sell alerts, push alerts, email alerts, or visual on-screen alerts. Customizable Panel. The panel can be moved to any place on the chart or minimized to allow more space. Heikin means "the average", and Ashi means "foot
FREE
The indicator presents reversal points by Fibo levels based on the previous day prices. The points are used as strong support/resistance levels in intraday trading, as well as target take profit levels. The applied levels are 100%, 61.8%, 50%, 38.2%, 23.6%. The settings allow you to specify the amount of past days for display, as well as line colors and types. Good luck!

And stop and reverse MT4 is a trend Expert Advisor which uses no indicators.
Trading Strategy: And stop and reverse MT4 trades any currency pair and any timeframe. The strategy is based on accompanying an open position with a trailing stop and reversing it when the trailing stop triggers. The first position is opened with the triggering of the Buystop or Sellstop order above and below the current price. On Friday at 23:00 terminal time all positions and orders are closed for the weekend. Additi
MetaTrader 市场 - 在您的交易程序端可以直接使用为交易者提供的自动交易和技术指标。
MQL5.community 支付系统 提供给MQL5.com 网站所有已注册用户用于MetaTrade服务方面的事务。您可以使用WebMoney,PayPal 或银行卡进行存取款。
