 MetaTrader 5
 专家
 指标
 程序库
 实用工具
 窗口小部件
 规则
适用于MetaTrader 4的新EA交易和指标 - 328
 EA交易自动执行市场交易,而指标可使您更准确地分析报价并预测价格行为。
通过这些应用程序,您将能够更明智地在MetaTrader 4执行交易,抓住更多的交易机会。

ScalTradeAssistPro: Empowering Manual Forex Traders with Enhanced Support
The tool presents itself as a solution tailored to address specific scenarios, such as instances where brokers impose limitations on setting Stop Loss (SL) values in close proximity to the initial position value. Notably catering to the needs of scalping traders, ScalTradeAssistPro steps in with a unique capability—the ability to establish "virtual SL/TP" points. This innovative feature calculates both the Stop Loss and T

Expert Advisor Overview and Advantages The strategy is based on the support and resistance breakout principle; The EA uses Take Profit and Stop Loss; Supports multi-currency trading; Easy to use. Even for beginners; Wide choice of suitable currency pairs; Minimum initial deposit.
Trading Recommendations To start trading, drag the Expert Advisor onto the chart with recommended settings; I recommend using the multi-currency trading option by launching the EA on required currency pairs. Use Traili
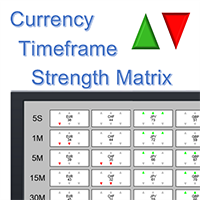
What is it? The Currency TimeFrame Strength Matrix is a simple and comprehensive Forex map that gives a snapshot of what is happening in the Forex market at the very present time. It illustrates the strength and momentum characteristics of each single currency (AUD, CAD, CHF, EUR, GBP, JPY, NZD, USD) with respect to different time frames (5 seconds, 1m, 5m, 15, 30m, 1h, 4h, 1d) independently. The most unique visualization, encompassing multi currency, multi time frame and multi trend analyses al

Biwavelet is an indicator for harmonic forecast of the market based on one-dimensional wavelet transform functions. Wavelet transforms are one of the main tools of digital algorithmic trading. This is due to their ability to analyze and predict processes occurring in two independent basic dimensions - price and time. Wavelets have significant advantages over the Fourier transform, because wavelet transform allows evaluating not only the frequency spectrum of the price signal, but also the time a

The Bollinger R (Bollinger Reversals) is designed to recognize short term high profitable counter trend patterns from the chart. This system combines both Bollinger Bands and mean reversion to define positions where the market could potentially reverse direction. Description Bollinger Bands are well known in the trading community. General concept with Bollinger method is selling when the price touches the upper band and buying when the price touches the lower band. Even though it works perfectly
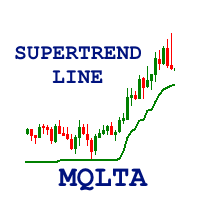
The Supertrend Line indicator shows you the trend using calculation based on the ATR.
How does it work? The Supertrend draws a line following the current trend, this line is the result of calculation made with the ATR. A Line under the candle means a likely bullish trend A Line above the candle means a likely bearish trend
How to trade with CSL indicator Buy when the Supertrend line is below the price, Sell when the Supertrend line is above the price. It is strongly suggested to use this indic
FREE
The AllClosedMT4 utility in the form of an expert. The utility is designed for closing all open positions simultaneously based on the total profit (in the deposit currency) of all open positions. The utility can be attached to any chart with any trading instrument.
Parameters Profit - the total positive profit in the deposit currency, at which all open positions are closed (profit). Stop - the total negative profit in the deposit currency, at which all open positions are closed (loss). The valu
FREE

The Percent Pivot indicator is a simple indicator that calculates the main percentage values. The graphical layout makes it very similar to the traditional pivot but its internal computing system is unique and irreplaceable. Every day, the market creates new bullish or bearish rates. This indicator help you to identify possible supports or resistance levels. The main values such as 0.25% and 0.50% are good reference points to use as potential target or reversal levels. This indicator has been de

An automated Expert Advisor developed for Forex trading. - Expert Advisor is suitable for all types of accounts and with any type of spread.
- The number of decimal places in quotes is determined automatically.
- The EA does not require stopping during the news releases.
- The timeframe of the chart does not matter. This parameter is defined in the settings of the EA.
- The EA always uses Take Profit and thus it is less sensitive to the speed of the broker.
- The EA have two trailing stop modes.
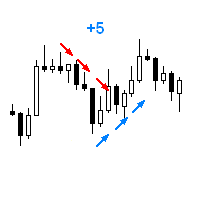
The Expert Advisor opens a trade in the specified direction at the specified time. If the price moves in the profit direction, additional trades are opened after a preset step. Trade are closed by a Stop Loss or upon reaching a target profit. The Expert Advisor trails the stop loss order, and is provided with multiple breakeven and trade closing functions (See the description of the parameters). Test and optimize the EA in the Tester using M1 open prices. The EA parameters can be controlled via

This expert is a tool which helps every trader to see the historical results by magic number or orders' comment.
You can to get source code from here .
Parameters MagicNumber - Here we put the orders' identifier ID we want to analyze. OrdersComm - Here we put the orders' comment we want to analyze.
How use it Add file in "expert" folder. Attach expert on a chart with your settings (MagicNumber or OrdersComm).
FREE

This unique Expert Advisor utilizes a neural network. It is able to learn, analyze the options and choose the most efficient trading strategy.
Advantages Multifunctional (it can be trained to trade any currency pair). The minimum amount of initial investment is 50 USD or higher. The EA uses a protective stop loss. It prevents the risk of losing all funds on the account. Reliability (does not use high-risk strategies). Easy to use. Customer support and consultation.
Operation Principle The EA i

This strategy is based on Bollinger Band to open the first position, if the position moves to the opposite side out of the Hedging Range, then a locking position is opened with an increased volume to help get out of the opposite trend. Real monitoring signal will be published soon. Recommended 0.01 Lot for each 3000$ Balance.
Input Parameters Starting lot size - First open position size Use autolot - Use auto calculation of starting lot size based on balance Balance - Use to calculate auto star

HLC Bar indicator is a market analysis tool. Unlike standard bar chart (Open-High-Low-Close), this indicator shows High-Low-Close prices only. Therefore, trader would focus on key elements of price action. It's very easy to use, no complicated setting, apply to any financial instrument, like Forex, CFD etc. Just open symbol chart, load indicator then enjoy.

We are happy to present you the "Info Trader" information indicator. As we are traders ourselves, we create software that we primarily use in our own trading practices. During intraday multicurrency trading we were constantly in need of a "ready to use" info panel. You have probably noticed that it is necessary to make a decision on taking profit on the account with consideration of profit on multiple instruments. To do this, you need to see the whole picture of each trade in detail. “Info Trade

Non-repainting , signal channel indicator. It helps traders visually define the trading direction. When the price forms the internal trend-following channel using signals (arrows and diamonds), the indicator recommends possible trend continuation of the price movement direction. The signal of the price crossing the external channel warns that the regression line has been reached and correction or reversal is possible. The indicator prompts a trader to close orders fully or partially. The indicat
MMM Heiken Ashi Special Series strategy: The robot uses its built-in Heiken Ashi improved and tested indicator all the time and does a calculation to determine the prices trends. It sends an order, closes or moves the Trailing Stop loss position as the indicator works. Perfect for Scalping; It will not send an order unless the calculations determine a good trend of profit; Like all MMM products, it is also programmed to minimize your losses and protect your money from the hostile market. We have

A mathematical multicurrency trading system based on the principle of a neural network. It uses several thousand of the most stable trading algorithms in its work. Before getting into the "А2М1" general database of algorithms, each block of conditions has passed the testing for stability with the identification of certain market dependencies for that block. A network created in such a way allows the EA to automatically select the most optimal variant of response to the market situation from seve

The BuySellArrows is a seemingly simple and very persistent indicator. All traders had come across indicators that contain numerous input parameters that will change Buy and Sell position when you change those parameters value. Many traders asked what parameter's value will be more accurate. So, I decided to make an universal indicator without any input parameters. In this case you will have very stable indicators without any worries that you put some wrong numbers. This indicator will show Buy

We-Trend MT4 indicator made by the We-Trading team is designed to study supports, resistances and trend filters. We-Trend is the tool that works also as a trend filter on all major trading strategies. We-Trend write for you horizontal lines (supports or resistances) on all timeframes.
UP Trend, Down and FLAT The We-Trend helps to understand the direction of the trend. Red or Green Horizontal lines show supports and resistances Trend comment show the main trend of the current TimeFrame, and othe

The EA generates signals about changes in the trend. Signals can be generated using different RSI-based strategies. When a position is opened, it is equipped with a take profit and a stop loss. If the position becomes profitable, a dynamic stop loss based on the specified values (TrailingStep and DistanceStep) is set for it and constantly trailed. This allows you to always close positions in profit.
Parameters Main Settings LotSize = 0.01 - fixed position volume. LotAutoSize = false - enable dy

The EA generates signals about changes in the trend. Signals can be generated using different RSI-based strategies. When a position is opened, it is equipped with a take profit and a stop loss. If the position becomes profitable, a dynamic stop loss based on the specified values (TrailingStep and DistanceStep) is set for it and constantly trailed. This allows you to always close positions in profit.
Parameters Main Settings LotSize = 0.01 - fixed position volume. LotAutoSize = false - enable dy
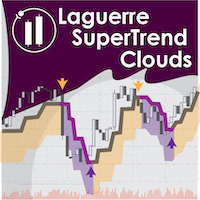
Laguerre SuperTrend Clouds adds an Adaptive Laguerre averaging algorithm and alerts to the widely popular SuperTrend indicator. As the name suggests, Laguerre SuperTrend Clouds (LSC) is a trending indicator which works best in trendy (not choppy) markets. The SuperTrend is an extremely popular indicator for intraday and daily trading, and can be used on any timeframe. Incorporating Laguerre's equation to this can facilitate more robust trend detection and smoother filters. The LSC uses the impro
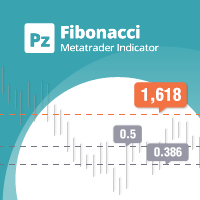
Are you tired of plotting fibonacci retracements or extensions manually? This indicator displays fibonacci retracements or extensions automatically, calculated from two different price points, without human intervention or manual object anchoring. [ Installation Guide | Update Guide | Troubleshooting | FAQ | All Products | Get Help ] Easy to use Manual anchoring is not needed Perfect for price confluence studies The indicator evaluates if retracements or extensions are needed Once drawn, yo
FREE

Abyss EA is a long-term Expert Advisor using the breakthrough of price levels in its algorithm. The EA sets the buy stop and sell stop orders at certain levels. All trades are accompanied by stop losses exceeding the expected profit several times. Profitable trades are accompanied by a trailing stop triggered when the order reaches a certain profit. All trades are closed on the selected day of week, so there is no sitting out the losses. You are also able to use the auto lot. The EA does not use
FREE

Same behavior of https://www.mql5.com/en/market/product/25552 but fixed lot 0.01 The EA waits for a spike according to a specific logic and opens a position in spike direction setting stop loss and take profit. When positions are in profit they are managed with smart trailing mechanism based also on elapsed time from opened position. It works with 5-digit and 4-digit broker. Must be used on the M1 chart. Does not need historical data. It does not use Martingale Grid Hedge
Parameters spikeFilte
FREE

Ichimotor EA — это мультивалютный трендовый советник , работающий по пересечению двух индикаторов - облака Ichimoku и Alligator с настраиваемыми параметрами. Входные параметры. Метод входа Ожидание тренда : советник дожидается совпадение тренда и стрелки на основе двух значений senkouspan. Мгновенный : советник входит сразу при появлении стрелки. Метод SL/TP Статический: стоп-лосс и тейк-профит равны значениям, указанным в параметрах “SL in Points” и “TP in Points”. SenkouSpanA Стоп-лосс равен р

The indicator builds the ranges of the probable price movement according to the specified timeframe. The range is built starting from the Open level of the specified timeframe and extended to the timeframe's Close, shifting relative to the extremes. The upper boundary is laid from the minimum and moves only downward when the Low is updated. The lower border is laid from the maximum and rises only when the High is updated. When the price approaches the range boundaries, the probability of movemen

This Expert Advisor is based on advanced neural networks. The main EA feature is the depth of the neural analysis. Monitoring of my accounts: https://www.mql5.com/en/signals/author/mizrael
Features and operation principles After training, the EA recognizes the ascending, descending and sideways trends . After calculating the neural network, the EA places a market order with a fixed Take Profit and Stop Loss . The EA sets the Take Profit and Stop Loss levels on its own. But Take Profit is alway

The LexusBO indicator is recommended for trading binary options . Signals are generated when the RSI, ADX, CCI indicators cross the customizable levels. The indicator displays signals using "up/down" arrows on the chart. Their values are available in the buffer arrays (buffer with index 0 - "up" arrow, with index 1 - "down" arrow). This makes the indicator easy to use for automated trading through specialized Expert Advisors. The recommended timeframe is M5. The indicator has a built-in counter
FREE

Hamster Scalping 是一个全自动交易顾问,它为剥头皮和鞅爱好者使用两种模式。 RSI 指标和 ATR 过滤器用作输入。
可以在此处找到对实际工作以及我的其他发展的监控: https://www.mql5.com/en/users/mechanic/seller
一般建议
具有良好执行力和 2-5 个点差的经纪商,您需要一个非常快的 VPS 服务器,最好 ping 不超过 3。
此处优化设置
输入参数
EA 适用于四位数和五位数报价。在输入参数中,我们以点为单位表示5个字符的值,它会自动按4个字符重新计算所有内容。
选择策略——可以在用户的选择中加入网格算法; 新周期 - 开/关。如果 New Cycle 关闭,则 EA 在关闭一个系列后不会打开一个新的; 交易买入 - 顾问只能交易买入; 交易卖出 - 顾问只能交易卖出; 周期指标1 - 第一个指标的周期; Up level - 第一个指标的上限,顾问将在其上方打开卖出; Down Level - 第一个指标的较低水平,低于该水平 EA 将开始买入; Period indicator2 - 第二个指标

True Choppiness Direction determines if the market is choppy (trading sideways) or if it is trending, as well as the trend direction and strength (green=up, red=down, grey=no trend) . The underlying algorithm is designed to detect trend movements even in the presence of noisy market data, please see screenshots. Trend strength is indicated by taller or shorter red/green fill. Choppiness index is range-bound between -50 (very trendy) and +50 (very choppy). This is a custom algorithm designed by u

本指标用于绘制水平通道和信号区域,检测极值突破、反弹以及基于可自定义斐波那契水平的目标(可选声音提醒)。它会自动将您选择的斐波那契水平应用到这些极值上。当价格突破在设置中启用的斐波那契水平时,指标可播放声音、显示消息、向移动终端发送推送通知或发送电子邮件(若已启用)。
功能: 按时间范围自动构建通道,例如用于检测夜间区间的突破 自动跟踪新的反弹 反转斐波那契水平刻度 显示/隐藏/折叠控制面板 从 5 种面板界面语言中选择 为斐波那契水平添加容差,使其成为更宽的信号区域而非线条 在多个时间周期上绘制水平线和斐波那契,可保留或删除其他时间周期的通道 按 High/Low 或 Open/Close 价格构建通道;通道自动贴合价格 锁定通道(设为不可选)以防误删
设置 --------- 语言 ----------- Interface Language — 指标面板语言。English(英语)、Russian(俄语)、Spanish(西班牙语)、German(德语)、Italian(意大利语)。 --------- 设置 ----------- Auto build channel b

目前八折优惠!
对任何新手或专家交易者来说都是最好的解决方案!
这个仪表板软件适用于28种货币对。它基于我们的两个主要指标(高级货币强度28和高级货币冲动)。它对整个外汇市场提供了一个伟大的概述。它显示高级货币强度值,货币运动速度和28个外汇对在所有(9)时间段的信号。想象一下,当你可以使用图表上的单一指标观察整个市场,以确定趋势和或剥头皮的机会时,你的交易将得到改善
我们已经在这个指标中建立了一些功能,使你更容易识别强势和弱势货币,同时识别和确认潜在的交易。该指标以图形方式显示货币的强势或弱势是增加还是减少,以及它在所有时间段的表现。
增加的新功能是动态市场斐波那契水平,它适应当前的市场条件变化,这是一个已经在我们的高级货币强度28和高级货币冲动指标中使用的成熟的加分项。
在交易时,总是将弱势货币和强势货币配对,这个新指标将帮助你做到这一点。
用户手册:点击这里 https://www.mql5.com/en/blogs/post/708783
特点 显示每个时间段的ACS28和GAP-speed(冲动)的货币强度值。 列:颜色代码以7种颜色显示货币强度:强势

Shark Surfer is a new generation Expert Advisor applying a well-established trend-following trading. The trade period recommended by the developer is H1. The product is good both for scalping, as well as medium- and long-term trading. Shark Surfer always sets take profit and stop loss to its deals. It provides the option to force close all open trades at the specified time before the market closes, which helps avoid unnecessary gaps on Monday. Shark Surfer trades on all symbols and timeframes. I

The Pivot Point indicator automatically calculates and displays the pivot point line and support and resistance levels. Pivot can be calculated according to the Classic, Floor, Fibonacci, Woodie, Camarilla or DeMark formula. It is also possible to select the period for calculating the indicator. A trader can choose from daily, weekly, monthly, or user-defined periods.
Types of pivots Classic Floor Fibonacci Woodie Camarilla DeMark
Main features The indicator shows the current and historic
FREE
Double Bollinger Bands is a method of following a trend. Two deviation at the time with fill color between them, ideal for traders who like visual style of trading.
Parameters Length - сenter averaging period line length. Deviation 1 - number of standard deviations from the main line 1. Deviation 2 - number of standard deviations from the main line 2. Color - optional.
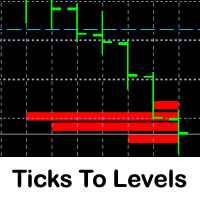
This indicator counts ticks and graphically displays the price levels, on which the greatest number of them was detected. Thus, it sufficiently accurately determines the levels of support and resistance. The indicator will be useful for traders who trade breakout or scalping strategies.
Features Technical analysis provides several ways for finding levels of support and resistance. Ticks to Levels provides another, fairly accurate, way of determining these levels empirically. The criterion for d

这个EA是基于经典的趋势跟踪系统监测入场信号的。它是基于ATR和CCI指标与移动平均线指标 DYJ TwoMACrossAlarm ,它使用2条移动平均线交叉查找信号,2个平均线分为一个快速和慢速移动平均线,这个EA使用了动态分配移动平均线MA1和MA2的周期,平均线周期使用了斐波那契数列,例如5,8 或 13,21 或 21,34 或......;当快速MA1向上穿越慢速MA2与CCI值向上穿越0线时,建立多单。当快速MA1向下穿越慢速MA2与CCI值向下穿越0线时,建立空单。ATR指标用于自动计算止损。如果有相反信号以及止损,止盈,追踪止损退出. 输入参数
MA Setup IsAutoAllocationMA = true - Dynamic allocation Period Fast MA Setup Period =5 - period of Faster Moving Average (value 5 ),if not automatic allocation period . Mode = EMA - type of Moving Average (SMA, E

The Fibonacci indicator automatically displays the Fibonacci retracement levels, representing significant support and resistance. The range for calculating the indicator can be taken from the previous day, week, month, year or user-specified session.
Levels 100 % (High) of the range from the previous session. 0 % (Low) of the range from the previous session. 76,4 % of the range from the previous session. 61,8 % of the range from the previous session. 50 % of the range from the previou
FREE

This is an arrow indicator for binary options. It does not redraw, arrows do not disappear. The indicator implements an optional tester for visual monitoring of the number of signal and win rate. Does not require adjustment or fitting. Works on all pairs and gold. The signal appears at the close of a candle. Entry is made on the next bar. Optional alert. For trading with robots, there is a setting for the number of bars in history. If 0, the entire history is used. The EA operation time: 24/5 Wo
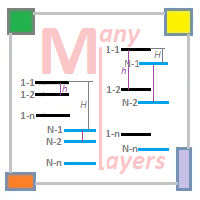
Trading is performed using multiple independent layers - number_of_commercial_layers . Flexible customization system of market entry signal - UNIT_INDICATORS . The use of the Moving Average , RSI and Envelopes indicators allows configuring any parameter of the indicators and enabling/disabling them. Signals are generated based on cumulative analysis of indicators from different timeframes . It is possible to control the equity level - CONTROL_EQUITY . Two danger levels: the first level activate
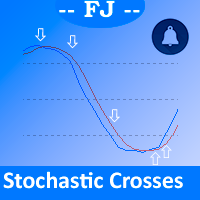
This indicator is intended to solve all kind of lines K and D crosses to generate different alerts when needed, and multicolored K line.
Features You can define an Stochastic as you could do on MetaTrader native Stochastic indicator, all the parameters are copied to get it. You can show all the K and D lines crosses You can select from all the K and D crosses only those that accomplish a minimum angle to filter crosses that aren't made with enough strength You can generate alerts when Oversold

MArket Wave EA is an Expert Adviser which is trend based and trades using multiple moving averages and Bollinger Band . Signals are generated when there is intersection between multiple moving averages and Bollinger Bands.
Input Parameters Distance from the Highest Sell Allowed - If a sell signal comes, price must be above the highest open sell order, plus this distance in points (even higher) Distance from the Lowest Buy Allowed – If a buy signal comes, price must be below the lowest open buy

This indicator is designed for determining the trend direction and price reversal points. This indicator is a heavily modified version of Parabolic SAR. Does not repaint/redraw Calculation on an current candle If the price is above the indicator, trend is ascending. If the price is below the indicator, trend is descending. Trade: If the color and the trend direction changed, open a position and close it by take profit, or hold it until the next trend change. It is also possible to trade rebounds

iMACD in iMA is indicator to change color in iMA if iMACD is upper of zero (up trend) or lower of zero (down trend). It is a useful tool to track when the upside and the downside iMACD on iMA.
You can to get source code from here .
Parameters MA_Periods — Period for iMA. MA_Method — Method for iMA. MACD_FastEMA — Fast EMA for MACD. MACD_SlowEMA — Slow EMA for MACD. MACD_SignalSMA — SMA signal for MACD. MACD_ApliedPrice — Price used for MACD. BarsCount — How many bars will show the line. Revers
FREE

This utility is designed for level trading.
Parameters buy level, sell level - type of the placed order. open price level - price level of the order. open Lot - order volume. Magic - magic number of the order. TakeProfit - take profit of the order in pips, (0.00001) for 4- and 5-digit quotes, (0.001) for 3- and 2-digit quotes. StopLoss - stop loss of the order in pips, (0.00001) for 4- and 5-digit quotes, (0.001) for 3- and 2-digit quotes. repeat open orders as a Limit Order: on, off - enable t

Moving Band EA is an Expert Adviser which is trend based and trades using the intersection of Moving Averages and Bollinger Bands.
Input Parameters Distance from Highest Sell Allowed : If a Sell signal appears, price must be above the highest open sell order, plus this distance in points (even higher) Distance from the Lowest Buy Allowed : If a Buy Signal appears, price must be below the lowest open buy order, minus this distance in points (even lower) Total Open Sells Allowed : Maximum number

This indicator shows the trend based on two configurable moving averages. A custom calculation shows market volatility in the lower frame. Higher bars mean higher volatility. The chart also shows suggestions for buy, sell or close with the help of arrows. It is possible to set minimum volatility for entry points and to set time filtered alerts. This indicator is useful to judge trends or market volatility, for example to catch good periods for scalping.
Parameters Volatility Period - volatility
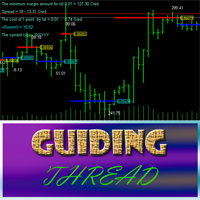
Guiding Thread is based on the standard RSI with a customizable period. The market entry signal is triggered after the indicator crosses a certain level. The event is marked by an appropriate line (blue - going long, red - going short) and the price label having the appropriate color . In other words, if the previous signal was for going short (red line and price label), the next one indicates the upcoming reversal and the necessity to go long (blue line and price label). A trading signal is pre

Eliminator EA is a professional and fully automated scalper. Easy to use, proved strategy many years and just focused on GBPCAD. This EA uses some calculated price and time actions with 6 indicators' confirmations. No need for unnecessary EA parameters. The EA sets everything automatically.
Advantages NO Grid, NO Martingale, NO Averaging and high risk strategies. The EA always uses Stop Loss and Trailing. No needs to enter stop loss or take profit manually. Dropdown style Money Management can b

Scalper Zoom is a new trading system designed to facilitate the process of Forex trading both for beginners and professionals. The Scalper Zoom indicator uses an adaptive method of operation and analyzes the market using multiple trading algorithms, while selecting the most efficient one for the given currency pair and timeframe. Working with this indicator is very simple. When a red vertical line appears, open a sell order. Close it when a blue vertical line appears. Follow the opposite steps f
The BinaryLuck indicator is a powerful indicator for trading binary options with any expiration times. This indicator will be especially useful for trading short-term binary options with an expiration time of 30-60 seconds. This is a complete ready, self-contained trading system. The indicator predicts the maximum High and minimum Low for the current candle. Then it calculates the path the price has passed on the current candle as a percentage of the predicted High/Low range ( Range of candles )
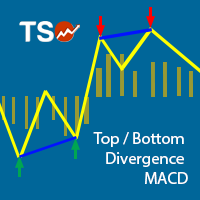
This indicator combines double bottom and double top reversal chart patterns together with detection of divergences between the price chart and the MACD oscillator.
Features Easily detect strong reversal signals Allows to use double top/bottom and MACD divergence signals combined or independently Get email and/or push notification alerts when a signal is detected Custom colors can be used The indicator is not repainting Can easily be used in an EA (see below)
Inputs ENABLE Double Top - Bottom:
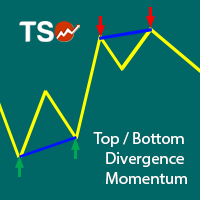
This indicator combines double bottom and double top reversal chart patterns together with detection of divergences between the price chart and the Momentum oscillator.
Features Easily detect strong reversal signals Allows to use double top/bottom and Momentum divergence signals combined or independently Get email and/or push notification alerts when a signal is detected Custom colors can be used The indicator is not repainting Can easily be used in an EA (see below)
Inputs ENABLE Double Top -

This is a unique multi-currency trading strategy developed for trading on H1 timeframe, which allows you to determine the global market entry points and obtain the maximum profit for each transaction. The market entry point is calculated using a variety of author equations and algorithms. We recommend using the indicator simultaneously on several trading instruments . A huge advantage of Big Deals System is an information panel in which the user can see the current information on potential entry
ISO Trend Line Pending Expert is a unique professional tool which can turn any selected Trend Line, Support Line and Resistance Line on your chart into a pending order line or Alert line with different trigger methods. With various order types including Price Touch , Price Break Out and Candle Close Break Out . The Order History feature will let you to have a quick access to all other charts which an order has been executed. It’s truly designed to help traders easily trade and manage many charts

The indicator does not repaint support and resistance levels. It shows daily, weekly and monthly percentage change of previous close with respect to actual price. It works well for Forex, indices and futures.
Settings Time Frame - select D1, W1 or MN. History - number of history for displaying the levels of a chosen period. Levels - number of current levels for displaying a chosen period. Levels value % - percentage difference between one level and another. Open color - open color from the chos

The Custom Market Watch ( CMW ) is a professional grade trading application which allows you to operate effortlessly with large number of symbols and multiple open positions simultaneously from one chart. The Custom Market Watch shows the most essential daily technical information for each symbol in combination with very simple and easy to use trading interface where you can monitor the net exposure for each symbol and you can open and close positions with one click. The app is automatically syn
Underlying assets with expiration date can change automatically to next date in the chart. Some brokers offer underlying assets with expiration date. For example to March, June, September, or December. This tool switches automatically to the next date. Expert Advisors, indicators, charts, or templates receive automatically the new contract. Automatically supported formats: NameMMMYY (Jp225Mar17) or NameMMYY (SugarMr17). Use as an indicator. Path \MQL4\Indicators.
Example From UsaIndJun17 , UsaI
MMM High Low Special Series strategy: The robot uses its built-in High Low indicator all the time and does a calculation to determine the prices trends. It sends an order, closes or moves the Trailing Stop loss position as the indicator works and indicates. Perfect for Scalping; It will not send an order unless the calculations determine a good trend of profit; Like all MMM products, it is also programmed to minimize your losses and protect your money from the hostile market. We have protections

Algo Candle is a very good indicator that permits to see, through the candle color, the strength of the algorithmic study chosen. In input you can choose your favorite algorithmic calculations such as: RSI, Vortex, MACD, Momentum, Stochastic and ATR. The candles are colored based on the levels of the chosen indicator. This indicator eliminates too many oscillators or indicators on your charts and gives you very useful information. Algo Candle is an excellent operating ally, allowing you to get m

MetaTrader 5 version available here: https://www.mql5.com/en/market/product/25794 FFx Pivot SR Suite PRO is a complete suite for support and resistance levels. Support and Resistance are the most used levels in all kinds of trading. Can be used to find reversal trend, to set targets and stop, etc.
The indicator is fully flexible directly from the chart 4 periods to choose for the calculation: 4Hours, Daily, Weekly and Monthly 4 formulas to choose for the calculation: Classic, Camarilla, Fibonac
As all momentum indicators this oscillator is measuring the speed and change of price movement. Momentum indicator is using an overbought and oversold conditions. The SmoothingOscillatorBands indicator is using a curve bands to show those conditions instead of constant levels. If the Yellow line is over a Blue line then we have an Overbought condition and when the Yellow line start to break out below the Blue line then we have a good opportunity to go Short. If the Yellow line is under a Red lin
Call/Put Ratio is one of the most well-known indicators of the market sentiment. The indicator has been developed by Martin Zweig. It is based on real volumes of the CBOE option market. As we know, a Call option gives its owner the right to buy the underlying asset at a predetermined price. A Put option gives the right to sell it. Thus, increasing volumes for Call options indicate the increasing demand. The growth of Put option volumes shows that supply starts exceeding demand. If we divide the

Activity Meter is designed to identify the activity of sellers or buyers, to detect the current trend, and to search for extrema, where the price may reverse and the current trend may be replaced by the opposite one. The indicator works with any symbol provided that you have sufficient history data for a timeframe the indicator is launched at. It is recommended to launch Activity Meter on M1, М5, М15.
Alerts Alerts are activated when the indicator histogram crosses the dynamic level upwards for
YOU CAN NOW DOWNLOAD FREE VERSIONS OF OUR PAID INDICATORS . IT'S OUR WAY OF GIVING BACK TO THE COMMUNITY ! >>> GO HERE TO DOWNLOAD
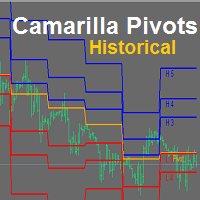
Camarilla Pivots Historical plots the historical data of the camarilla pivot point levels on the chart. The Camarilla Pivot levels was originated in 1989 by Nick Scott. The levels are used as primary support and resistance levels by Intraday traders. The levels are calculated with the following formula: R4 = C + RANGE * 1.1/2 R3 = C + RANGE * 1.1/4 R2 = C + RANG
FREE

MIG Scalper is very simple but powerful indicator. This is a very useful indicator, combined with a panel for fast trading will give you many satisfaction. This indicator can be used in any currency pairs and on any time frame, It fits at every speed of trading. Moreover, it's relatively easy to trade with MIG Scalper indicator. Arrows appear at the opening of a bar and do not disappear. This indicator produces two signals: BUY Signal: arrow aqua SELL Signal: arrow red
Indicator parameters MIG_

The indicator is designed to determine the pivot level for a group of candlesticks and the trend direction. no repainting calculation is done on an active candle if candlesticks are above the main line, the trend is upward if candlesticks are below the main line, the trend is downward breakdown of the main line signals a trend change or a price rebound two display modes, normal and with acceleration (ModeLite) an auxiliary line displays the resistance line
Configurations BarsHistory - how many
FREE

Harvesting is an Expert Advisor (EA) that works by sending orders automatically based on the best positions it detected. This EA also sets Stop loss value that can dynamically change following the price, when the order moves to more profit. And this EA cannot be run on its own, traders need to take part in monitoring and taking action to close all profitable orders, as in harvesting.
Pairs and timeframes This EA tested on GPBUSD pair and M1 timeframe as in screenshots. Therefore Harvesting coul
FREE
MetaTrader市场是 出售自动交易和技术指标的最好地方。
您只需要以一个有吸引力的设计和良好的描述为MetaTrader平台开发应用程序。我们将为您解释如何在市场发布您的产品将它提供给数以百万计的MetaTrader用户。
