 MetaTrader 5
 专家
专家
 指标
指标
 程序库
程序库
 实用工具
实用工具
 窗口小部件
窗口小部件
 规则
规则
适用于MetaTrader 4的新EA交易和指标 - 323
 EA交易自动执行市场交易,而指标可使您更准确地分析报价并预测价格行为。
通过这些应用程序,您将能够更明智地在MetaTrader 4执行交易,抓住更多的交易机会。
EA交易自动执行市场交易,而指标可使您更准确地分析报价并预测价格行为。
通过这些应用程序,您将能够更明智地在MetaTrader 4执行交易,抓住更多的交易机会。 
This is standard ZigZag indicator with some cool additional features - colored range, amount of pips between highs and lows and also amount of candles between indicator range.
Default ZigZag indicator variables depthZigZag deviationZigZag backstepZigZag
Bullish market variables lineUpColor - line color lineUpStyle - line style lineUpWidth - line thickness textUpColor - color of text with amount of pips and candles textUpFont - font of text with amount of pips and candles textUpSize - size of t

Uses an advanced grid algorithm with no martingale or limited Martingale (default) (version for MT5: GS grid5 ) . Defines and control the current trend; It switches himself its parameters in accordance with the current market conditions ;
Flexible customizable grid algorithm with or without martingale; Drawdown reduction algorithm (DD Reduction Algoritm); Hedge algorithm; Interactive trade control buttons; The ability to open / close orders manually; News filter to prevent trading during news

DotaScalping is a semi-automated trading system for scalping. The indicator shows recommended moments for opening Buy/Sell trades as dots on the chart. Signals are generated based on the algorithm for price amplitude smoothing. The indicator tries to accurately calculate the moments of the maximum peak price values and produces signals based on the smoothed correlation. The indicator determines the High and Low price values and generates signals based on the trend direction. The indicator is v
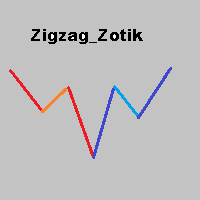
The Zigzag Zotik indicator displays the price movement in the form of a zigzag based on the AO_Zotik indicator values. The Zigzag Zotik indicator displays the trend movements and their corrections. The AO_Zotik indicator consists of three lines moving relative to "0": "main" line; "support and resistance" line; "balance" line. The "main" line crossing the "support and resistance" line indicates the end of one wave and the beginning of the other. The Zigzag Zotik indicator displays this on the ch

CCI 行动专家顾问 是一个强大的工具,旨在自动化 CCI(商品通道指数)策略 ,允许交易者利用 CCI 水平触及。凭借其用户友好的设置和强大的风险管理系统,该 EA 为希望将 CCI 指标纳入其交易方法的交易者提供了可靠且高效的解决方案。 该 Expert Advisor 的主要特点之一是其适当的风险管理系统,可帮助交易者保持对其交易资本的控制。通过指定手数和最大风险占总保证金的百分比,交易者可以有效地管理他们的市场敞口并保护他们的投资。 EA 完全自动运行,根据预定义的 CCI 级别参数执行交易。当达到指定的 CCI 水平时,EA 相应地打开订单,允许交易者利用 CCI 指标识别的潜在市场变动。这种自动化为交易者节省了时间和精力,因为他们不再需要手动监控市场的 CCI 信号。 为了保障利润,EA 交易会自动调整止损水平,随着交易的顺利进行将其移至盈利方。此功能有助于保护收益并确保利润得到保障,同时最大限度地减少潜在损失。此外,隐藏的止损水平通过防止其他市场参与者成为目标而增加了额外的安全层。 EA 结合了基于流行规则的信号过滤,使交易者能够通过将其与特定的 CCI 指标信号对齐来增
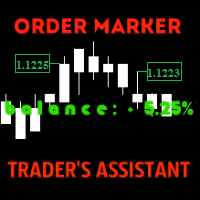
The utility is created to assist traders. How it works
Changes in the balance are displayed as a green or red line on the screen. The market entry moments are displayed on the chart both for current deals and deals in history. If there are several orders of the same type, the utility calculates the average price and marks it with white dashes. The utility can send a report on balance change to the user's email.
By user's command Modification of all TP (SL) of Selected orders on the Current pair

This Expert Advisor's main strategy is based on the usage of two kind of indicators: two built-in shifted RSI to measure the asset prices oscillations and a Parabolic SAR to check the prices trends. It combines these indicators signals in order to get stronger signals and ensure the EA will do good trading operations. The second strategy consists of sending a new opposite order against a losing order since it reaches the minimum negative profit defined by the "Minimum Loss Value to Reverse (in c

SDX is our latest and most advanced dashboard for manual trading. The app is based on our proven grid platform and offers unique trading opportunities for both experienced and new traders. This unique combination of innovative tools is designed to simplify the trading process and to give you real advantage. The system is ideal for short term trend following, counter-trend trading and scalping on the Forex market.
Main Features Ability to work simultaneously with 10 pairs from one screen. Abilit

Simulator for Risk / Reward ratio calculator We-RiskReward is a MT4 indicator made by the We-Trading team to simulate an order with Risk / Reward calculator.
Horizontal Lines This indicator show you 3 horizontal lines that are: Open line Take Profit line Stop Loss line You can move the lines and you will see R/R and Lots calculation in real time. You can use it to simulate Long and Short positions.
Indicator parameters As input parameters you need to check only the Risk for trade. For e.g. you
FREE

ATR通道 根据海龟交易法则对MT4自带的ATR指标进行了修改,并根据当前K线的开盘价和ATR值生成一个通道。 ATR通道 指标可用来识别市场的超买和超卖条件。
计算方法 通道上轨 = Open + r1*ATR 通道下轨 = Open - r2*ATR
其中: Open为当前K线的开盘价 ATR为当前K线的ATR值 r1,r2为ATR值乘以的比例
设置参数 ATR Period - 设置指标的计算周期,默认周期为14。 ATR Up Ratio - 设置通道上轨r1的值,默认为1.0。 ATR Low Ratio - 设置通道下轨r2的值,默认为1.0。
如何交易 基本上 ATR通道 指标是用来识别市场的超买和超卖条件的,当市场价格突破通道上轨,市场处于超买条件( 卖跌 区 ),相反,当市场价格突破通道下轨,市场处于超卖条件( 买涨区 )。 注意 : 当持仓止损出局后,下一笔交易避免在同一个方向开仓。 例如: 当价格突破上轨后,你卖出一单,然后这单止损出局,之后市场价格再一次突破上轨,此时应避免开空仓,应耐心等待价格突破通道下轨后开多仓。
FREE

This panel is designed for quick visual search for the price action patterns on several instruments simultaneously. It is possible to add and remove instruments. Clicking the signal button allows you to quickly move to the chart with the identified pattern and timeframe. The panel searches for 8 candlestick patterns: PIN-BAR, EXTERNAL BAR, INSIDE BAR, DOJI, LEVEL, HIGH/LOW OF N BAR, FAKEY, ONE-WAY N BAR. Any of the patterns or the periods can be disabled by clicking its title. It can also search
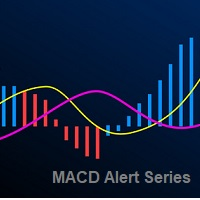
The Moving Average Convergence Divergence Indicator (MACD) is both a trend–seeking and momentum indicator which uses several exponential moving averages set to closing prices to generate trading signals. We added several types of alerts to aid in your search for better opportunities in the market.
Product Features Email Alert Sound alert Push Notification (Alerts can be sent to your mobile phone) Signs on chart Alert box Possibility to work with both histogram and visual line Alert on zero hist
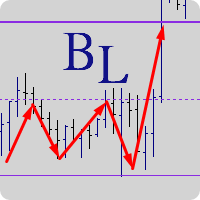
"Balance cost" analysis method Created by Trader AFI_man. The BalanceLines indicator plots balance levels for a given time interval. The balance line divides the market volume into sellers (above the balance level) and buyers (below the balance level). In any movement, if the price is fixes above the balance level, there comes a moment when sellers are unable to hold off buyers, which leads to a growth. Similarly, when the price is fixed below the balance level, there comes a moment when buyers
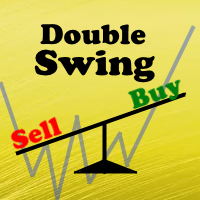
The Expert Advisor's operating algorithm is based on a priori known truth 'The price does not stand still'. We add math and logic to this truth and receive an Expert Advisor, which allows catching almost all the movements in the market. When an order is opened, a breakout Stop order of a larger volume is set instead of Stop Loss. If the price reaches this order, another pending Stop order of a larger volume is placed. This approach is called Swing or Pendulum Swing . Double Swing uses this appro

Schrodinger trading machine is an Expert Advisor (robot) for any financial instrument on MetaTrader 4 platform. Both main input parameters (N and M) are optimized for EURUSD H1 . Of course, you are able to optimize these parameters for any currency pair and timeframe. For example, the main input parameters for GBPUSD H1: N = 5.0 and M = 12 The main input parameters N and M can be any positive numbers. These are input parameters (weight coefficients) of the one layer neural network. N is a double

SFO Trend Racer system is a trend indicator created by the CEO and Founder of " Simple Forex Options ", Tevin Marshall . It serves 6 different functions all in one. It shows the trader the entry signals as well as exit signals, whether it is a take profit or a stop loss. It also uses trend filters and signal confirmations so that the trader is able to make the most logically fit decision. Trend Racer uses various filters and specific settings from a plethora of indicators. The beauty in this ind
This specific indicator is designed to solve one specific problem : In case the connection to the broker's server is lost, remember when the connection was lost, and at what time the connection was resumed. Thus, the user sees the time when there was no connection to the broker's server . An Alert box is displayed on the screen, which records when the connection was lost and resumed. Of course, the indicator will not react to slight losses of packets. For better visualization of the indicator op

This indicator calculates and draws lines over the chart. There are two types of trends: Trend A: the line is drawn using local lows for uptrends and local highs for downtrends Trend B: the line is drawn using local highs for uptrends and local lows for downtrends There are a few conditions, which have to be fulfilled and can be changed by the parameters (see also picture 4): MinBarAge : the count of bars to the last base point of a line is called BarAge and has to be greater than the parameter
FREE

Automated medium-term Expert Advisor. It is based on Bollinger Bands . The EA is optimized for EURUSD H1 . The robot should be optimized for use on other instruments. The Expert Advisor does not use hedging, martingale, grid, arbitrage etc. The results obtained in the strategy tester are identical to the results of real trading. Since the results for Control points are close to results of optimization in every tick mode, the EA allows for quick optimization using Control points .
Parameters Mod
FREE
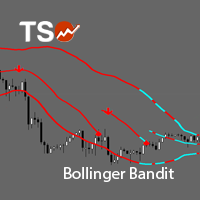
TSO Bollinger Bandit Strategy is an indicator based on the Bollinger Bandit Trading Strategy as presented in the book Building Winning Trading Systems with TradeStation by G. Pruitt and J. R. Hill. SCANNER is included . Now with Scanner you can find trading opportunities and setups easily and faster.
Features A complete entry and exit strategy for trending markets. Get email / push notifications when an entry signal occurs. The indicator is not repainting. Can easily be used in an EA. (see For

The Momentum Channel indicator works according to the daily price index. The indicator is used to analyze the parity price. This analysis is done through channels. channels are used to find trend return points. The indicator has 3 channel lines. these are the lines at 30, 50, and 70 levels. The 70 level is the overbought territory. Price movements in 70 and above indicate that the chart will fall in the near future. Price movements at 30 and below indicate that the chart will rise in near future

Turbo Scalp is a scalper based on mathematical analysis of the market situation, for working under any market conditions. The scalper moves along the expected trend line and closes positions at a trend reversal. The EA uses an algorithm based on rough mathematics to determine the expected trend line. The EA does not use any indicators. The EA trades around the clock. When deals in one direction is closed, it opens deals in the opposite direction.
The EA is most suitable for working on the EURUS

InvestorPRO is a stable Expert Advisor for professional traders. The EA trades in a fully automated mode. The trading algorithm of the EA is based on analysis of numerous factors that affect the dynamics of an instrument. This EA has been created to provide the trader with a comfortable environment for investment in the financial instruments of the Forex market.
The EA is installed in the usual way and is suitable for trading any trading symbols. The EA is designed for trading on the D1 timefram

This robot uses its own built-in oscillator and other tools to measure market movements (volatility, speed, power, and direction). At an appropriate time, it places an invisible pending order on the market, which it continues to work with according to the set TradingMode. It is recommended to use a fast broker with low fees, accurate quotes and no limitation of stop loss size. You can use any timeframe.
Features spread protection slippage protection no grid no martingale a small SL for every tr

The Average Daily Range shows the dynamic levels of average pip range on a pair measured based on the daily Highs and Lows over a certain periods. You can use the ADR to visualize potential price action outside the average daily move. When ADR is above average, it means that the daily volatility is higher than usual. The ADR can be helpful in setting targets for positions. If the ADR shows you that a pair has an average daily range of 80 pips, then it might be wise to tighten up your target

Compas - is a fully automatic intraday trading robot, that trades mainly in the Pacific session. The EA Compas is safe and trades one order with a fixed Stop Loss. EA Compas is suitable for investment accounts that require reduced risks. The performance of EA Compas should be evaluated over long distances.
The default settings are for GBPCAD M1
Setting For the operation to be correct, follow the instructions: To download the news list, it is necessary to add http://ec.forexprostools.com to th

GUME Simple Entry indicates the buy and sell entry points of all instrument by analyzing the market movement. It is designed to indicate entry points for any currency pair and all trading periods. It is optimized for M5 for scalping and M15 and higher periods for long term trading. It is also optimized for EURUSD, GBPUSD, GBPJPY, EURJPY and XAUUSD. It is designed to display a colored arrow up or down for buy or sell signal respectively for convenience and ease of use.
Indicator Parameters time

该指标显示其他(和非标准)时间范围的最高价/最低价/开盘价/收盘价 - 年、6 个月、4 个月、3 个月、2 个月、月、周、日、H3-H6-H8-H12 小时 M45 M90。 您还可以设置打开蜡烛的班次并构建虚拟蜡烛。 这些时间范围之一的“周期分隔符”以垂直线的形式提供。 可以针对当前或先前水平的突破(突破昨天/上周的高点/低点等)配置警报。 您还可以将所有级别向右移动一个周期。 也就是说,当前周期将显示前一周期的最高价/最低价.
参数 Number of levels to calculate (0-all) — 屏幕上将显示多少条。 Change the opening of bars (hours) — 将蜡烛的开盘移动 n 小时。 该指标将根据新的开盘时间绘制虚拟柱。 MN1 以上的周期不会改变。 Move the levels to the right — 将所有级别向右移动一格。 您将看到当前蜡烛的先前水平。 Period Separator (vertical lines) — 显示垂直线、周期分隔符。 Show High Lines (trigger for

Crossover Action Expert Advisor 是一种高级工具,旨在自动执行最流行的交易策略之一,即 移动平均线交叉策略 。凭借其直观的界面和强大的功能,该专家顾问消除了手动交易的复杂性,并根据移动平均线交叉自动执行交易。 该专家顾问的主要特点之一是其适当的风险管理系统,确保以适当的手数和最大风险限额执行交易。这有助于保护您的交易资金并最大程度地减少潜在损失。 专家顾问完全自动运行,无需人工干预。它利用潜在的趋势逆转或延续,在移动平均线交叉处开单。此外,随着交易的进行,它会自动调整止损水平以保护利润。止损水平是隐藏的,为您的交易增加了一层额外的安全保障。 为了增强信号的可靠性,专家顾问应用了先进的过滤技术。这些过滤器有助于消除错误信号并提高交易策略的准确性。通过合并这些过滤器,专家顾问确保只对最可靠和高概率的交易机会采取行动。 专家顾问的用户友好设置使配置和适应您的特定交易偏好变得容易。您可以自定义参数,例如手数、最大风险、移动止损、止损、获利等等。这种灵活性使您能够根据您想要的风险回报概况和交易风格调整专家顾问。 总之,Crossover Action Expert

This long-term trading system works on 9 pairs and timeframe. The Expert Advisor uses various trading systems, such as trend trading, counter-trend trading and others. The EA has the built-in smart adaptive profit taking filter. The robot has been optimized for each currency and timeframe simultaneously. It does not need arrival of every tick and high execution speed. The EA works with all brokers. EA uses economic news. No martingale, grid and other risky strategies. Use multicurrency testing

NC Strength EA 是一个趋势EA系统,支持单一货币或多货币操作。 根据价格走势判断趋势反转完成订单。 可灵活设置风险等级,当然了,风险与利润往往是成正比的。
参数 MoneyManagementType:资金管理模式 Risk:资金风险的百分比 Lots:订单手数 MagicNumber:图表唯一标识(多图表请设置为不同数值) RiakLevel:风险级别,分为Low,Standard,High三种模式,级别越高风险越大,可能获得的利润也相对越高 StopPercentage:最大亏损控制
设置 当MoneyManagementType设置为Auto时,将按照Risk自动设置订单手数 当MoneyManagementType设置为Fixedlot时,将按照Lots固定设置订单手数 RiskLevel设置为Lowlevel时可能发生的回撤最低,但是利润也会相对变少 RiskLevel设置为High时可能发生的回撤最高,但是利润也会相对较多
推荐货币对和图表 H1:AUDCAD,CADCHF,AUDJPY,GBPUSD,EURGBP,CADJPY,GBPAUD,AUDNZ
Manage your risk and make your trading easier A free version with no restriction, only limited up to 20 trades, is available here . With Fx Easy Trade you can create orders easily and system will calculate automatically the position size, create statistical report, draw supports and resistances on all timeframe you have in one click, create alerts, send notification, scan the market, etc. More details below. Define your risk in euro or dollar (for example, 20€), and the system will calculate pos
Manage your risk and make your trading easier This is a free demo of Fx Easy Trade. It works without restrictions, it is only limited to 20 trades. The full version is available here . With Fx Easy Trade you can create orders easily and system will calculate automatically the position size, create statistical report, draw supports and resistances on all timeframe you have in one click, create alerts, send notification, scan the market, etc. More details below. Define your risk in euro or dollar
FREE
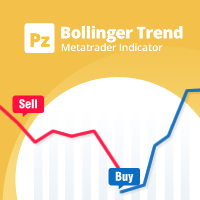
A personal implementation of the famous Bollinger bands indicator as a trend following mechanism, which uses a moving average and the standard deviation to define what a trend is and when it changes. Bollinger bands are usually used as an oversold/overbought indicator only, but in my opinion, the trading approach is more complete using the trend variant as an exit strategy. [ Installation Guide | Update Guide | Troubleshooting | FAQ | All Products | Get Help ] Easy to trade Customizable col
FREE

Advanced Stochastic Scalper - is a professional indicator based on the popular Stochastic Oscillator. Advanced Stochastic Scalper is an oscillator with dynamic overbought and oversold levels, while in the standard Stochastic Oscillator, these levels are static and do not change. This allows Advanced Stochastic Scalper to adapt to the ever-changing market. When a buy or a sell signal appears, an arrow is drawn on the chart and an alert is triggered allowing you to open a position in a timely mann
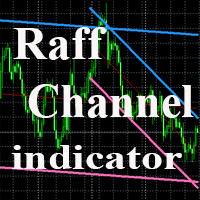
The indicator plots a trend channel using the technique by Gilbert Raff. The channel axis is a first-order regression. The upper and lower lines show the maximum distance the Close line had moved away from the axis line. Therefore, the upper and lower lines can be considered as resistance and support lines, respectively. A similar version of the indicator for the MT5 terminal
As a rule, most movements of the price occur within a channel, going beyond the support or resistance line only for a sh
FREE

A simple but effective helper that will allow you to track both global and local market trends. The indicator combines the work of two oscillators: Stochastic and RSI. Both indicators can be set to any timeframe.
Advantages of Use Multitimeframe - you can adjust both indicators to the desired timeframes. To obtain the entry points, you can use the Elder's triple screen system. Highly customizable - you can configure not only the parameters of the indicators, but also their appearance (color and
FREE
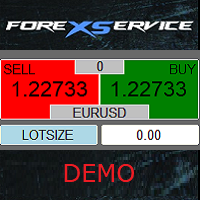
Important! Demo version will work only on EURGBP. One Click Trader is a tool designed for MetaTrader 4 platform, which enables you to take your trading to the next level. It enables you to open, manage and close your trades in simple an efficient way by just one click of your mouse button. Up arrow minimizes the OCT panel Down arrow maximizes the OCT panel Right arrow displays the next panel with additional features Left arrow hides the panel with additional features Red SELL button enables you
FREE
The Signal SASON indicator is designed to generate trading signals. It works to find potential trade entry points. The signals are found by analyzing a series of candlestick movements and a set of algorithms. This indicator calculates the reversal points of the pair you are using. It does not have deceptive properties like re-painting.
Rules and Features When a signal arrives, it is recommended to use take profit and stop loss level. Use timeframe M15 and up. It works on all currency pairs, exc

Everlasting Grid Expert Advisor is a grid scalping robot and is able to work with any currency pair on M15 timeframe (currencies with lower spreads are preferred). It uses Moving Averages to find trend and place orders. If it is a false signal, the robot places a recovery grid orders to recover the losses. All the positions are closed when it reaches the target profit defined in settings.
Requirements Optimized to work on EURUSD M15. Minimum recommended deposit is $3000. An ECN broker with low
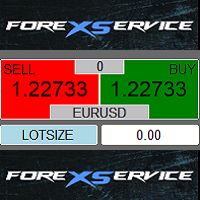
One Click Trader is a tool designed for MetaTrader 4 platform, which enables you to take your trading to the next level. It enables you to open, manage and close your trades in simple an efficient way by just one click of your mouse button. Up arrow minimizes the OCT panel Down arrow maximizes the OCT panel Right arrow displays the next panel with additional features Left arrow hides the panel with additional features Red SELL button enables you to open short market orders Red SELL STOP button e

This Expert Advisor trades only following the market directions. So if the market goes north buy positions will be added, and if the market goes south sell positions will be added to a specific number of pips from the last entry. If a market range is set the expert will not open another position but wait for the breakout. The open positions are managed until they are closed with a profit. You can limit the number of opened positions. Only one position can be opened on a bar. A useful tool when t
Heterodyne 外差是基于强度指数指标 (RSI) 的振荡器。将指标读数的当前值与指定周期内的最大和最小指标值进行比较,并计算平均值。指标读数也使用移动平均 (MA) 方法进行平滑处理。买入信号是指标自下而上穿过给定水平,卖出信号是指标自上而下穿过给定水平。
设置 RSIperiod - 指标周期 系数 - 查找最大值和最小值的系数 中线——信号线电平 Applied_Price - 使用价格 MAPeriod - 平滑期 MAMethod - 抗锯齿方法 警报 - 启用包含自定义数据的对话框 Text_BUY - 购买信号的自定义文本 Text_SELL - 卖出信号的自定义文本 Send_Mail - 将电子邮件发送到“邮件”选项卡上的设置窗口中指定的地址 主题 - 电子邮件标题 Send_Notification - 向在“通知”选项卡的设置窗口中指定了 MetaQuotes ID 的移动终端发送通知。

You can now use the conventional price charts to display Renko bars. This indicator can send dialog boxes with alerts, push notifications to mobile devices and emails. You can easily use this indicator to create Expert Advisors, because the indicator uses buffers.
Indicator parameters Renko size, points - size of Renko bars Arrows gap, points - distance to the signal arrows Alerts - true/false - use pop-up alerts when signals appear Push notifications - send Push notifications to the mobile ter

This Expert Advisor is the free version of "Bollinger with WPR scalper", which is based on the Bollinger bands and Williams' Percent Range indicators. Limitations of the free version: lot is fixed to 0.01, only the EURUSD currency pair is supported, trading time cannot be selected, trailing stop is not available. Nevertheless, it can make quite a lot of deals, so you do not have to wait for positions to be opened (with the appropriate settings and timeframes below H1). The EA can be used on time
FREE

Shows on the chart a two moving averages histogram. It allows to send alerts to MetaTrader platform when the crossovers occurs. You can use it on any timeframe, moving averages settings can be adapted as well as the appearance and colors.
The parameters for the indicator are Fast moving average period Slow moving average period Moving Average Mode Moving Average Price Alert on crossovers Histogram Bar Width Bullish Color Bearish Color
FREE
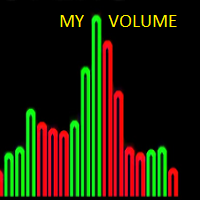
This indicator is an original view on volumes. It is known that volumes show the amount of buyers and sellers for a certain period of time. A candle is used a period of time. Volumes at a candle High show the buyers. Volumes at a candle Low show the sellers. A candle Open shows the Delta. Delta indicates who was dominant on a given candle, buyers or sellers.
Input parameters Distance - distance of the volumes text from High and Low. Font size - text font size. The indicator provides levels that
FREE

Boxy Trader is a trading robot, which is not using indicators. The Expert calculates and trades the tops and the bottoms of the current swing with more than 70% success rate. Its robust risk management system is the key of its success. This system works on all instruments with no restrictions. Usage of Stop Loss and Take Profit, always . No martingale, no grid, no hedging. Suitable for deposits starting at $100. 100% made in Spain. Stable results, tested since 2003. Testing, determining risks an
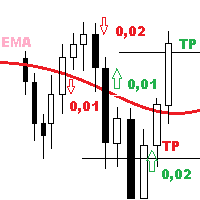
UniMartin is a universal Expert Advisor combining trend strategies, grid and martingale. The EA trades in the trend direction, making decisions based on the MA indicator (at least TrendBars amount of bars should closer for a trend to appear). If averaging is necessary, the minimum step is set for the EA. The decision on the need for averaging is made based on original methodology for determining the market volatility (the CoeffOfVolatMarket parameter can be changed from 0 to 10 with any intermed

Harrow Race is an Expert Advisor that has been developed based on Harrow Order. This is the high risk version of Harrow Order, which uses decreasing Anti-Martingale lot for real orders, and increasing Martingale lot for virtual orders. This EA is for traders who are brave enough to take risk with the Anti-Martingale method. For more information about Harrow Order, you can read https://www.mql5.com/en/market/product/28456 . This EA works using the same principle as the Harrow Order. When the pric

Special Trend Oscillator is an indicator designed to detect trend change points and measure the power of the current trend. This indicator is a different model of the MACD indicator. The indicator has two channels. The blue channel is the upper line of the upward trend. The red channel line is the underscore of the downward trend. Buy when the trend line reaches the red line. Sell when the trend line reaches the blue line. Our Popular Products Super Oscillator HC Cross Signal Super Cross Trend S

The indicator has the following features Predictive Trend (Histogram) - it uses an advanced predictive probability and statistics calculation plus linear regression to know the possible trend. This must be used with at least 3 timeframes for a more accurate reading of the trend: D1, H4, H1. In some cases (subjective), you may want to use M5 for a more precise reading. Velocity (Dotted Line) - Green dotted line indicates a speed of price movement upward. Red dotted line indicates a speed of price

Big Pineapple is a martingale Expert Advisor with a great diversification of operations and different systems working on 27 pairs. This increases the chances of sustained growth and reduces exposure to a single pair. The risk is very controlled. Unlike other martingale EAs, this EA is very safe with very low drawdown. The minimum deposit is 10,000 USD with 0.01 initial lot size. If you want to run it in a smaller account, you could open a cent account and run it with at least 100 USD. The EA doe

The Expert Advisor calculates the divergence on the current and higher timeframes. In case the divergences coincide, the EA starts its operation. Deals have strict take profit and stop loss levels. Each deal is managed by trailing stop. The strategy involves the use of a tight stop-loss. Therefore, losing deals and/or series of losing deals are not uncommon. This EA is not suitable for those who have difficulties coping with losing deals. The EA is recommended for simultaneous use on the followi

Harmonic Master Scanner is a dynamic tool that helps harmonic traders to identify and draw harmonic patterns on the chart. Harmonic Master Scanner is a software designed to work in MetaTrader 4. Harmonic Master Scanner works based on original MetaTrader 4 Zigzag indicator and the standard harmonic patterns elements. This software can send alert and email to you when a Harmonic pattern is detected on any charts. The entry point is the "D" point. The scanner only shows the present pattern one by o

VR Smart Grid 是适用于 MetaTrader 4 和 MetaTrader 5 的最先进交易顾问,它将经典网格策略转变为智能的自动化仓位管理系统。机器人独立开单、智能平均,并以预计划利润将网格分小批逐步平仓,使平均价格尽可能贴近市场。九种手数计算方法、十三种距离类型、九种平均模式、两个独立的移动止损、余额管理以及 Telegram、Push、Email 和 Alert 通知 — 这样一套配置使 VR Smart Grid 真正独一无二,适合新手和专业人士。 设置文件(set files)、产品演示版、说明和奖励可在 [博客] 中获取 为什么 VR Smart Grid 是自动交易的最佳选择 想象一个不仅会开单,而且像经验丰富的交易者一样思考的交易机器人:它看到价格朝仓位反方向移动,冷静地以经过深思熟虑的步进和手数添加平均订单,并在出现一丝回调时开始小心地分批平掉网格,一次又一次地锁定利润。VR Smart Grid 正是这样工作的。它不是"黑匣子",也不是盲目的马丁格尔 — 它是一个经过 15 多年演进、在真实和模拟账户上经历数千种变体和测试的精心设计系统。 VR Sma

Take a Break pauses your Expert Advisors when trading is a bad idea: before news, after a daily loss, outside your trading hours, or when a rule you wrote yourself says so. When the pause is over, your EAs simply continue. Account protection for all your EAs in one tool: news filter, drawdown and equity protection, time filter and custom rules. One EA on one chart protects the whole account, the free indicator gives every chart its own rules on top. Free demo | What is new in 26.09 | Support Ass
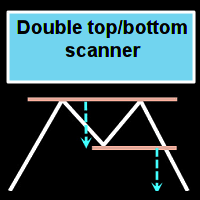
这个多时间框架和多品种指标识别双重或三重顶部/底部形态或随后的颈线突破(确认顶部/底部)。它提供 RSI、pin bar、吞没、镊子、早/晚星过滤器以及 MACD、Awesome (AO) 或 RSI 发散过滤器选项,可以仅过滤掉最强的设置。 该指标也可用于单一图表模式。请在产品的 博客 。 结合您自己的规则和技术,该指标将允许您创建(或增强)您自己的强大系统。 特征
可以同时监控您的市场报价窗口中可见的所有交易品种。将该指标仅应用于一张图表,并立即监控整个市场。 可以监控从 M1 到 MN 的每个时间范围,并在识别出第二个或第三个顶部/底部或颈线突破时向您发送实时警报。支持所有 Metatrader 原生警报类型。 可以使用 RSI,从不同的蜡烛形态和背离中进行选择,以正确识别潜在的逆转。 该指示器包括一个交互式面板。当单击一个项目时,将打开一个带有相关代码和时间范围的新图表。 该指标将信号写入文本文件,EA 交易系统 (EA) 也可以使用该文件进行自动交易。比如 这个产品 。
输入参数 输入参数的描述和解释可以在 这里 找到。 重要的
请注意,由于具有多功能性,既不

This EA uses an Alligator indicator and has a classic strategy to trade as the Alligators Jaw, Teeth and Lips calculation results are compared each tick. This way, the EA opens orders at right moment and closes the orders as it reaches the right profit value. It protects your money because it is provided with: trailing stop loss to protect your profit. Once your order has a positive profit, it sets SL at a certain distance in order to keep a positive profit; Spread value limit to prevent opening

This panel is designed for quick visual search for the price action patterns on several instruments simultaneously. It is possible to add and remove instruments. Clicking the signal button allows you to quickly move to the chart with the identified pattern and timeframe. The panel searches for 8 candlestick patterns: PIN-BAR, EXTERNAL BAR, INSIDE BAR, DOJI, LEVEL, HIGH/LOW OF N BAR, FAKEY, ONE-WAY N BAR. Any of the patterns can be disabled by clicking its title. It can also search in history (by

One of the main goals in the development of this Expert Advisor was ease of use. As a result, this EA has a minimum of parameters, which are easy to understand. At the same time, it is very flexible and customizable for almost for any instrument (currency pair).
The logic According to the given algorithm, the EA determines local support and resistance levels (at startup, the previous quotes are disregarded). When a candle closes beyond any level, a deal is opened in the same direction. By defau
Chart Time Indicator is very simple and easy, but it can be very important to control the time before opening any manual trade. This indicator shows the time on the chart between 3 different options.
Input parameters Show Time : Select all the time options that you want to see. Local Time (Personal Computer Time), Server Time (Broker Time) or GMT Time. Recommendations: Use only one Chart Time Indicator for each chart.
FREE

SA Assistant is an intuitive tool without complicated settings, designed to facilitate the trading operations in the MetaTrader 4 terminal. SA Assistant is not designed for working in the strategy tester. The demo version works only on the USDCAD pair. Please test the EA on a demo account before using it on a live account.
The SA Assistant EA is visually divided into 4 blocks: 1. "Information" - displays in real time: trading account balance leverage spread of the instrument the EA is attached
FREE

The KFX PATTERN manual Expert Advisor is a price pattern based System. Manual stands for the fact that he does not open trades independently. Only shows the individual levels with the profit target. The individual strategies are based on those of Thomas Bulkowski's books. The following Patterns have been integrated: Three Falling Peaks. Three Rising Valleys. Diamond Pattern. High and Tight Flags. Cup with Handle Pattern. Horn Top. Horn Bottom. Earnings Flag. Three Line Strike. Falling Three Meth

SA Assistant is an intuitive tool without complicated settings, designed to facilitate the trading operations in the MetaTrader 4 terminal. SA Assistant is not designed for working in the strategy tester. Please test the EA on a demo account before using it on a live account.
The SA Assistant EA is visually divided into 4 blocks: 1. "Information" - displays in real time: trading account balance leverage spread of the instrument the EA is attached to current account profit account equity account

The KFX High and Tight Flag pattern Indicator is part of the KFX Pattern manual Expert Advisor. The indicator shows the entry level (breakout) with the profit target and the stop loss. The strategy is based on Thomas Bulkowski's book, Encyclopedia of Chart Patterns second edition. High and tight Flags are the best performing Chart Pattern in both Bull and Bear markets. They are perfect pattern for trend following. Suitable for every Currency pair, Options, Commodities, Stocks, Indicies and Timef
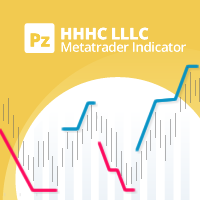
A personal implementation of a famous trend principle known as higher high, higher close, lower low, lower close (HHHC - HHHL). It uses price action alone to determine trend direction, trend changes and pullback zones. [ Installation Guide | Update Guide | Troubleshooting | FAQ | All Products ] Customizable breakout period Customizable colors and sizes It is non-repainting and non-backpainting It implements alerts of all kinds The indicator defines three price zones: Buy zones are blue Sell zo
FREE
Yellow mouse scalping is a fully automatic Expert Advisor designed for night trading on a calm market. The strategy is night scalping. The standard RSI and ATR indicators are used to find entry points. Closing of transactions takes place according to the author's algorithm, which significantly improves the risk control and security of the deposit. Risky strategies like "martingale" are not used. Monitoring of the advisor's work, as well as my other developments, can be viewed at https://www
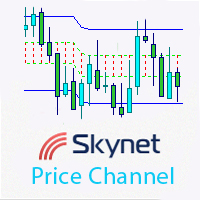
This indicator displays an equidistant price channel, identifies short-term trends and automatically finds the best levels for the upper and lower borders of the channel. It is optimized for major timeframes and currency pairs.
Advantages visualization of short-term trends automatic setting of upper and lower channel borders suitable for scalping strategies based on a rebound from the channel borders
Parameters smooth - border smoothing coefficient. The default value is 1; pricetype - use Open

测试二元期权,策略和指标。
允许您测试自己的优势,检查二元期权的策略和指标。 专家不做任何真正的交易!仅用于测试目的。 您可以在真实的图表上运行,也可以在MT4 Tester中运行历史记录。 在MT4中有很多指标,你可以附上时间表并测试Dushe喜欢的方式)
图表上有两个呼叫和放置按钮。在上升,并在幻灯片。还有,指示Lot的字段。
在测试期间,显示利润数量,丢失数量,为零,余额,测试时间,打开的Call和Put的数量。
我希望这个创作能够帮助你从水槽中存钱,学习如何赚钱。
输入参数: Winning Percentage = 0.75; - 对利润的兴趣 Initial deposit = 100; - 初始存款 Drawing of transactions = true; - 绘制交易,是或否 Exp i ration Time in minutes = 5; - 交易的执行周期,以分钟为单位
使用说明: 专家不会进行真正的交易,只会进行测试。 如果您预
FREE
MetaTrader市场提供了一个方便,安全的购买MetaTrader平台应用程序的场所。直接从您的程序端免费下载EA交易和指标的试用版在测试策略中进行测试。
在不同模式下测试应用程序来监视性能和为您想要使用MQL5.community支付系统的产品进行付款。
