 MetaTrader 5
 专家
专家
 指标
指标
 程序库
程序库
 实用工具
实用工具
 窗口小部件
窗口小部件
 规则
规则
适用于MetaTrader 4的新EA交易和指标 - 327
 EA交易自动执行市场交易,而指标可使您更准确地分析报价并预测价格行为。
通过这些应用程序,您将能够更明智地在MetaTrader 4执行交易,抓住更多的交易机会。
EA交易自动执行市场交易,而指标可使您更准确地分析报价并预测价格行为。
通过这些应用程序,您将能够更明智地在MetaTrader 4执行交易,抓住更多的交易机会。 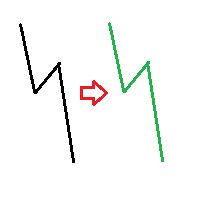
The indicator compares pattern found on chart history with the current price movement. Since history repeats itself, then, by comparing the two patterns, indicator can predict the further movement of the price. The indicator allows you to overlay highlighted history pattern with current movement and you will visually see this movement and will be able to compare the past and the present. To compare two patterns, you need: It is necessary to find and highlight a pattern on the history chart of a
This utility calculates and draws lines over the chart. There are two types of channels: Channel A: the mainline is drawn using local Lows for uptrends and local Highs for downtrends. Channel B: the mainline is drawn using local Highs for uptrends and local Lows for downtrends. The parallel line of both types is built, using the maximum fractal between the base points of the mainline. There are few conditions which have to be fulfilled and can be changed in the parameters (see also picture 4): T

The Wing Patterns indicator scans for many different kinds of Patterns using an XABCD structure. The term Wing Pattern is used to refer to all types of patterns based on a general XABCD structure, which is plotted in an alternate high-low extreme form. In other words, assume that point X is started at a low point on the chart. The point A is plotted at the next highest point within a certain number of bars. This certain number of bars is called the depth level. In this example, point B would be
Индикатор MQLTA Supertrend Multi Timeframe сочетает в себе значения Supertrend, найденные на нескольких таймфреймах, чтобы подтвердить тренд пары. Для работы утилиты необходим бесплатный индикатор MQLTA Supertrend Line - https://www.mql5.com/en/market/product/25951.
Как он работает? Индикатор проверяет состояние Supertrend на всех выбранных таймфреймах и отображает результат в виде легко читаемой таблицы.
Как торговать с помощью индикатора Supertrend Multi Timeframe Покупку следует совершать,
FREE

这个EA是经过1年多的优化和实盘验证的自动交易程序。有很多交易经验丰富的朋友提出了很好的建议,感谢他们。 基本描述: 针对不同的货币对,EA自动匹配不同参数。已经优化并实盘验证的货币对有:EURUSD,AUDUSD,USDJPY,NZDUSD,EURAUD,GBPUSD。 建议在M1或M5上运行。
功能 赢利点数可配; 加仓间隔可配; 买卖独立风险参数; 支持资金管理; 最大加仓层数可配; 支持开始和停止时间; 支持账户止损,避免爆仓;
参数 WinPoints: 目标盈利点数。这个参数设置太小,盈利减少,反之,盈利增加,但同时会增加风险。 MinIncPoints: 最小的加仓间隔。值越小,风险越大。 MaxLevel: 最大加仓次数。 BuyRisk: 买单 风险参数。如果市场风险较大,该值应设置大一些。反之,设置小一些。 SellRisk: 卖单 风险参数。如果市场风险较大,该值应设置大一些。反之,设置小一些。 LotMulti : 仓位管理,下单量=(0.02,0.02,0.03,0.05,0.08,0.11,0.17)x LotMulti SLThreshold: 账户止

Expert Advisor for night scalping. It works at the end of the American and at the beginning of the Asian sessions. Working time frame - M15 and M5. The EA features a news filter, which uses a news indicator. NOTE : The settings in the proposed set files are designed for brokers working according to Eastern European Time and New York trading time. When using with a broker that works according to a different time, it is necessary to manually adjust the EA operation time in the input parameters. ND

Some traders experience difficulties when it comes to limiting risks. This indicator helps traders define a suitable stop loss to limit trading risks. The indicator provides seven levels of risk limitation (recommended values are 1-3). The greater the risk, the greater the stop loss. Accordingly, the lower the risk, the smaller the stop loss, but the greater the probability of false triggering. In addition, the indicator shows trend signals and the current trend strength. This data can be used t

The Parabolic SAR Trailing Stop will trail the Stop Loss price of your selected orders following the PSAR indicator, so you don't have to worry about having to change it manually.
How does it work? The Expert Advisor sets and moves the Stop Loss price of the selected orders following the value of the PSAR Indicator. You can filter the Orders by Symbol Comment Magic Number Buy/Sell
Parameters PSAR Step - The Step of the PSAR PSAR Max Step - The Max Step of the PSAR PSAR Shift - The Shift of the
FREE

The Supertrend Trailing Stop will trail the Stop Loss price of your selected orders following the Supertrend Line, so you don't have to worry about having to change it manually. MQLTA Supertrend Trailing Stop requires you to install the FREE Indicator Supertrend Line https://www.mql5.com/en/market/product/25951
How does it work? The Expert Advisor sets and moves the Stop Loss price of the selected orders following the value of the Supertrend Line. You can filter the Orders by Symbol Comment Mag
FREE

Automation for setting up Stop Loss, Take Profit and Trailing Positions can be opened with all platforms MetaTrader 4 MetaTrader Android MetaTrader iOS MT4 Web Trader The Expert Advisor will arrange Trailing of trades Market Execution Pending Order (Buy Stop, But Limit, Sell Stop, Sell Limit)
Input Parameters (all in pips) Take Profit - take profit value. Stop Loss - stop loss value. Trailing Start - trailing start. Trailing Step - trailing step/stop. Lock Start - lock start (first time trailin
FREE

AZscalper is an automatic Expert Advisor that works using pending orders. It has an advanced algorithm that uses the price like the principal indicator, in fact, during a substantial price movement (it doesn't matter if up or down), it places pending orders in both directions. This system has a preset small Stop Loss and big Take Profit, and the closure of the positive trades is reached by Trailing Stop. AZscalper works well on EURUSD, EURJPY, USDJPY and GBPUSD currency pairs with best result on

The ARIMA Trend Forecaster indicator is designed for analyzing and forecasting the trend component of a financial instrument based on the integrated ARIMA autoregressive model. The ARIMA methodology aims at identifying the presence of unit roots and the order of time series integration. In financial markets, autoregressive models are used for working with price time series to predict future price points. The ARIMA Trend Forecaster indicator using all the advantages of the ARIMA method allows to

The Expert Advisor follows Puria trading method. RSI is used for sorting out signals. Also, the EA implements the averaging function.
Trading strategy Three Moving Average (МА) indicators combined with Moving Averages Convergence/Divergence (MACD) provide market entry signals . Sell as soon as First MA crosses Second MA and Third MA below and confirmation from MACD arrives (one bar has closed below the zero level). The Relative Strength Index (RSI) indicator is used as the signal filter . If RS

Parabolic SAR strategies EA is a Parabolic SAR EA that can support multiple strategies. Purchasing this EA can save you the time taken to automate your existing PSAR strategy through coding a custom EA and it also helps you discover profitable Parabolic SAR strategies as its fully compatible with the strategy tester and all settings are editable. The EA supports both scalping, short term and long term strategies. The various supported settings are explained below: NOTE: The default settings in t
CoolLine is a signal indicator displaying on a chart points for opening and closing trade positions. The indicator signals are not redrawn. It draws arrows on the zero bar Open[0]. It works on all currency pairs and all time frames.
Indicator Advantages Precisely shows the opening and closing points on the chart Does not redraw signals Works on all currency pairs and timeframes Very easy to use; suitable even for beginners Has a very flexible system of settings Can send push and email notificat
The RSI S-RoC indicator differs from the standard RSI in that it takes into account the price rate of change when calculating values. When the price moves in a trend, the indicator produces good entry signals oncethe price touches its levels. The level values can be configured in the indicator settings. They can also be modified and adjusted directly in the indicator window. You can also set on a chart signal lines. Once they are crossed, the indicator will produce a sound alert or play a user

The indicator is designed for determining Fibonacci levels. Does not repaint/redraw The blue level shows the zero Fibonacci value (it is also the Pivot level) Red levels show calculated Fibonacci levels (used as a rollback or reversal point) Automatic period detection (periods can be entered manually) Adjustable display calculation method. Settings BarsHistory - the number of bars to be used to display the indicator. Method - method of calculation. AutoPeriod - automated period calculation (true

BinaryIndicator is a highly accurate indicator for trading binary options. It shows excellent results in scalping. This indicator is based in multifactor analysis of trend indicators, as well as confirmation oscillators, which in the end gives an increased accuracy of signals.
Advantages of the indicator Increased accuracy of signals. Excellent results when trading binary options with a short expiration time from M30 to M1 . It works on any timeframes. Works with any trade symbols.
Parameters

I present you the Abella Expert Advisor. The "London breakout" occurs in the European session. During this time, Abella follows the market and enters in one of the direction according to the identified Price Action patterns. The EA works both during a flat and trend. This EA has been created for multicurrency trading. Do not Abella on one pair. For optimal performance, use 4 pairs: AUDUSD, USDJPY, EURJPY, GBPUSD (the H1 timeframe) and create a portfolio.
Parameters Lot - fixed lot; Risk - dynam
FREE

Demiro is an EA which performs orders by assessing Bollinger Bands indicator and price action. The EA expects a price action when the price exceeds the Bollinger bands upper band or falls under the Bollinger bands lower band. The EA can perform multiple orders. Only the first order is performed with the assessment of Bollinger bands indicator and price action. The following orders are performed according to the price movement differences only. When the current price is higher or lower then the f

This oscillator is smooth as the name implies. It also shows hidden divergence arrows. The indicator also has multi timeframe features to make it very flexible to use. The multi time frame features can be adjusted as follows: 1 or M1, 5 or M5, 15 or M15, 30 or M30, 60 or H1, 240 or H4, 1440 or D1, 10080 or W1.
Indicator parameters Timeframe - When set to 0, works on the current timeframe. Draw Divergence arrows - If set to True allows divergence lines to be drawn. Display Alert - If set to True


该实用程序允许您在策略测试器中手动测试您的策略。在可视化图表上一键交易。
该实用程序的最新版本为交易者提供了手动测试其交易策略的高级功能。借助策略测试器,您现在可以在模拟环境中评估交易策略的有效性。此功能允许您分析交易技术的表现并对其进行改进以提高您的交易技能。 此外,策略测试器提供了一种便捷高效的方式来执行交易,在可视化图表上一键交易。此功能使您能够以所需的价格水平快速进入和退出交易,而无需在不同屏幕之间切换。 借助策略测试器中提供的完整功能,您可以有效且高效地模拟和完善您的交易策略、分析结果并优化您的交易技能。 MT5 版本
详细描述 +DEMO +PDF 如何购买
如何安装
如何获取日志文件 如何测试和优化 Expforex 的所有产品 警告:此面板供策略测试人员使用! 对于实时图表上的一键交易,您可以下载我们的实用程序 VirtualTradePad for MetaTrader 4 和 VirtualTradePad for MetaTrader 5 。 结合我们 EA 通用面板 EAPADPRO 的优点和 VirtualTradePad交易
FREE

Extract Candle Power 是一种实时交易量提取器指标,可提供有关每根蜡烛期间买卖双方行为的宝贵见解。通过分析交易量数据,交易者可以就市场趋势和潜在逆转做出更明智的决策,超越传统移动平均线指标的能力。 这个强大的工具允许您提取和分析当前蜡烛的买卖双方交易量,并将其与之前蜡烛的交易量进行比较。该信息对于了解交易者当前在市场中的定位至关重要。此外,您可以通过将实时蜡烛的交易量与移动平均线进行比较,轻松识别潜在的反转点。 Extract Candle Power 指标用途广泛,适用于所有时间范围和任何货币对。它提供了准确的见解,并且在更高的时间范围内使用时尤其有价值。无论您有特定的交易策略还是更喜欢适应不同的时间框架,该指标都可以根据您的需要进行定制。 该指标还提供了一系列附加信息和参数,可增强您的交易体验。您可以访问详细信息,例如经纪人的服务器时间、买家和卖家的交易量百分比、蜡烛交易量、买入价和卖出价、价差、当日最高价和最低价、掉期利率、杠杆、保证金、净值、利润和余额。 通过可自定义的显示参数,包括颜色选择、字体选择和大小选项,您可以个性化指示器的外观以满足您的喜好。信息面板

Renko True 该指标在常规报价图表的背景下以矩形(“砖块”)的形式显示价格变化。价格的向上移动(按设置中指定的点数)通过在前一个下一个矩形上方相加和向下移动 - 在前一个矩形下方相加来标记。 该指标旨在直观地识别主要趋势。用于确定关键支撑位和阻力位,因为它平均了潜在趋势。此视图不考虑小的价格波动(“噪音”),这使您可以专注于真正显着的变动。 仅当价格变动超过指定的阈值水平时,才会绘制高于或低于新的指标值。其大小在设置中设置并且始终相同。例如,如果基数为 10 点,而价格上涨了 20,则将绘制 2 个指标值。 该指标的优点是任何砖块都可以显示其形成时间的持续时间。如果价格在一定范围内波动,没有上涨和下跌的门槛值,那么砖将一直保持价格不变。 指标设置说明 单元格 - 矩形(砖块)的阈值级别或高度,以磅为单位(例如,10 磅)。 RenkoPrice - 基于构建指标的价格,High_Low - 最大和最小价格值,_Close - 基于收盘价。 Draw - 绘制指标读数的样式:LINE - 简单线,HISTOGRAM - 直方图,ARROW - 以十字符号的形式,ZIGZAG
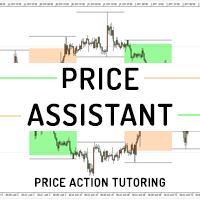
Price Assistant is a training indicator that will give you the ability to understand the primary logic of the price action. Designed for study, it has been programmed to provide to trader the ultimate ease of understanding the price logic. Price Assistant is not just a study aid provider, it is also an operational indicator that can provide you with good operating ideas. A label on chart gives you an input and it shows you the actual situation of the price action. You could work in real time upd
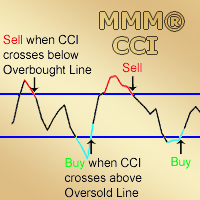
MMM Commodity Channel Index Strategy: The robot uses its two built-in improved and tested CCI indicators to determine the prices trends and calculates the signal for buying or selling. It sends an order, closes or moves the Trailing Stop loss position as the indicator works. Perfect for scalping. It will not send an order unless the calculations determine a good trend of profit. Like all MMM products, it is also programmed to minimize your losses and protect your money from the hostile market. W

The Verona Expert Advisor is a fully automated Expert Advisor which is based on trading within the price channel. The optimal trading condition for Verona is a ranging trend (flat) with a channel of 5000 points. Verona shows the best results on small trends with price movements of 800-2000 points and subsequent rollbacks of 30-40%. The EA uses a unique system for calculating the trade lot size and take profit, with values changing depending on the proximity to the channel border. Verona can open
EnigmaMt4 is an Expert Advisor with an original trading strategy. The EA features a limited martingale (only four legs). It should be attached to any chart in the usual way.
Advantages of the EA It works on any timeframes. Works with any trading instruments. Built-in system of automatic profit calculation. It can work without user intervention.
Disadvantages of the EA Limited martingale is present.
Parameters Lot - position volume (0.1 lot per 1000 units of the deposit currency is recommended
FREE
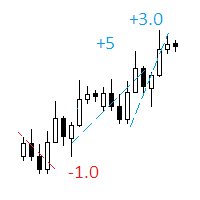
The indicator displays on a chart trading results. You can configure the color and font of displayed results, as well as filter trades based on the magic number. If multiple trades were closed within one bar of the current timeframe, the result is summed and output in one value.
Utility parameters Plot profit in - the format of output results: wither in deposit currency taking onto account commission and swap, or in points. Start from - start processing data at the specified time. Plot last dea
FREE

Velociraptor is an Expert Advisor that exploits acceleration of volatility of the market. It goes into action when there is an explosion of volatility, for example during the news or special events. It is an evolution of the Volatility Accellerator EA with new features and the new algorithm for price acceleration calculation. The best new feature is an equity filter that disables the real trading if the EA is not more profitable. In agreement with filter settings, in this period, the EA will ope
FREE

AR Canada is a fully automated Expert Advisor. It does not require any adjustments and is optimized for trading USDCAD H1. The product is a free version. It trades only using a fixed lot with the minimum volume. The Expert Advisor DOES NOT use hedging, martingale, grid strategies, arbitrage, etc. It uses a trading algorithm based on the intersection of two moving averages for analyzing the market conditions, as well as support and resistance levels. The Take Profit and Stop Loss values are fixed
FREE

A script that brings the cryptocurrency market to the MetaTrader platform. Make sure you have added the API address https://min-api.cryptocompare.com in the list of allowed URLs on tab 'Tools' → 'Options' → 'Expert Advisors'. After the script has successfully finished, go to menu and select 'File' → 'Open Offline', choose one of the generated timeframes (for example: BTCUSDBitst5 ) and click 'Open'. Now you can add your indicators or templates to customize the chart as you want.
Inputs Logging
FREE

Rubicon EA is a fully automated trend-following Expert Advisor for trading EURUSD. The strategy of the EA is designed for medium-term trading, which ensures stable operation regardless of the trading conditions (spread, slippages, execution speed) and the current market situation.
Advantages of Rubicon EA It can work with any broker and any account type. There are no prolonged periods of stagnation. The EA is self-optimizing, adjusting to the current market conditions. Does not require any know

The Main EA Features Trading is performed using a grid of Buy and Sell orders. A strict Stop Loss level is set for each order to limit the losses. Multicurrency trading is supported. It is not susceptible to large delays and spread value. Monitoring of my accounts: https://www.mql5.com/en/signals/author/mizrael
Operation Principle The EA opens a grid of Buy and Sell orders with spacing between them set in the Step parameter. Once the sum of orders in either Buy or Sell direction becomes equal
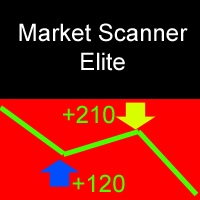
Market Scanner Elite is a new generation of indicators of the Market Scanner series. The Elite version features an improved market analysis algorithm, with a better identification of the entry points and filtering of the false signals. The logic of market analysis and calculation of effective entry points applied in this product are significantly different from those applied in Market Scanner . This indicator cannot be called a big brother, as it is a completely new product with innovative analy
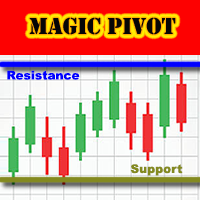
Magic Pivot is a professional indicator for finding the support and resistance lines; it has been developed by a group of professional traders. The indicator plots three support lines and three resistance lines, where a price reversal is highly probable. Magic Pivot is an excellent tool for scalping and intraday trading. Advantages
High accuracy of signals. Suitable for scalping and intraday trading. The indicator does not redraw. Simple indicator setup, minimum parameters. Works on any financ

Expert Advisor Overview and Advantages The strategy is based on the support and resistance breakout principle; The EA uses only Buy orders. The EA always uses Take Profit and Stop Loss. Multicurrency trading is supported. Easy of use. Wide choice of suitable currency pairs; Minimum initial deposit.
Operation Principle Based on the data of two indicators (the first is RSI with a period of 14, the second one is custom built-in indicator), the EA opens a buy order and sets the Take Profit and Stop

The indicator uses the Envelopes channel in its calculations, which allows working with dynamic support and resistance levels. It also considers the direction and strength of the trend, as well as the mathematical calculation that determines the percent range of the price channel, which is generally formed at the time of the accumulation of positions. It first generates a preliminary signal in the form of a round arrow. Then it is necessary to wait for a normal arrow and enter the market only af
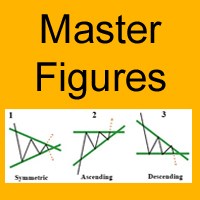
The Master Figures indicator analyzed the market for the most common chart patterns. The first pattern is called Pin bar . This pattern can rightly be considered one of the most widespread. This pattern looks like a candle with a small body and large tail (wick). Once you see it on the chart, open a position against the wick. It is better to use the resistance lines for closing. Master Figures shows this pattern in the form of circles. A position should be opened when a new candle appears after

The TrendsAssistantMt4 indicator is shown in a separate window in the form of rhombi of different colors: red rhombi indicate a drop in the price, green ones signify a growth. Two rhombi of the same color in a row serve as the trade signals. The indicator should be attached to a chart of any timeframe and any trading symbol.
Parameters Per - period for calculation. The greater the period the longer the indicator is calculated and the less the number of false signals.

Close at time is a very useful EA to close specific positions at specific time. It also provides additional condition to setup. Close specific positions at time. Close specific positions which currently profits. Close specific long positions only. Close specific short positions only. Close specific pending orders. It is useful to support your trading strategies.
Parameters description magic : Target magic number to close. close_time_hr: Hour to close. (MetaTrader 4 terminal time) close_time_min
FREE

HeatMap MT4 allows traders to see inside the charts. This indicator plots congestion zones over a certain period of time, known as "Lookback", by analyzing thousand of variables simultaneously. These spots act like strong supports and resistances and now are easy to see. HeatMap MT4 works with all timeframes and all instruments.
Settings Computations - define whether the algorithm works continuously or only at the opening of each candle (default: New Candle). Lookback in Bars - define the perio

指標顯示最大和最小手數,以及交易品種的價差大小。
為了獲得快速而豐厚的利潤,需要使用此信息來根據最大存款快速做出進入市場的決策。它是根據可用資金和開設一個手數的資金計算的。
當您參加各種外匯競賽或以最大可能的方式交易市場時,以及在波動性增加或減少期間獲得快速且豐厚的利潤時,通常會發生這種情況。
該指示器連接到工具窗口後,立即顯示您所需的信息。如果需要在工具窗口中更改字體大小或替換信息,則可以在指示器設置中執行此操作(請參見屏幕截圖)。
Fontsize-字體大小; Xdistance-相對於錨定角的X坐標距離(以像素為單位); Ydistance-以像素為單位的Y坐標相對於錨定角度的距離。 有關作者產品的其他信息……
FREE

This is a program in the form of an EA that attaches to a chart in MetaTrader 4. Then, by using API from Bittrex, Binance websites, it downloads the history of altcoins. By selecting a pair name, the EA automatically downloads all time frames history (Daily,H12,H4,H2,H1,M30,M15,M5,M3,M1) so there is no need to attach multiple EAs to different charts. You can select one pair from Bittrex and 4 pairs from Binance exchange with one running EA and create up to 15 timeframes for 5 different pairs. Th

This is a multi-currency author strategy, designed for trading on the M1, M5, M15, М30, Н1, Н4. Entry points are calculated using custom formulas and algorithms that allow you to effectively determine current trend in the market, obtain the entry points (buy/sell) and the optimal levels to close orders. The Cosmic Diviner Scalper System indicator can be used on any Forex pairs. The detailed guide on how to use the indicator is provided in the blog: https://www.mql5.com/en/blogs/post/719602 A hug

Adaptive Lock is an interactive assistant for manual trading, which minimizes the losses at any movement of the price against the trader and allows the profit to grow when the price moves in the right direction.
Strategy Any manual trading strategy can be used. The adaptive position locking algorithm implemented by Adaptive Lock can be used instead of stop loss for any order, including manually opened ones. Place the initial lock line instead of the conventional stop loss. The robot monitors th

Yet another signal copier. Nothing special. Demo version can be downloaded here .
Key Features The utility copies trades between terminals: by market, pending orders (optional), as well as their stop loss and take profit levels (optional as well). You can copy from one Master account to several Slave accounts, as well as from several Master accounts to one Slave account.
Volume calculation At the moment, there are two options for calculating the volume: The trade volume is taken 1 to 1 from th

HMA Grid EA is a grid system which analyzes trend based on the Hull Moving Average (HMA) indicator. Unlike the Simple Moving Average (SMA) the curve of HMA attempts to give an accurate signal by minimizing lags and improving the smoothness. This EA proposes two trading strategies which combine a slow period HMA to identify the main trend and a short period HMA to identify short trend reversal movement. This combination make usually sell and buy signals accurate and in case if the trend reverse w
FREE
Variable Index Dynamic Average (VIDYA) is an original method of calculating the Exponential Moving Average (EMA) with the dynamically changing period of averaging, developed by Tushar Chande. The length of period in VIDYA depends on market volatility as indicated by the Chande Momentum Oscillator (CMO).
Typical Signals VIDYA generates buy and sell signals when the price crosses over and under the bands: When the price crosses over the upper band of VIDYA, this can be interpreted as a signal to
FREE

Speedster EA is a fully automated expert advisor. No required technical or fundamental analysis. The EA opens and closes all of trades. That manages all of processes. The strategy based of OBOS levels at both of short and medium timeframes in the same time. That uses 2 indicators and moving averages to calculate the price.
Advantages NO Grid, Martingale, Averager and high risk strategies. The EA always uses Stop Loss and Trailing. Dropdown style Money Management can be set easily. Also, fixed l
This is a fully multitimeframe version of the ATR Channel standard indicator, which works for any combination of timeframes. The indicator allows viewing price channels from different timeframes in one window, and they will always be displayed in a correct time scale. You can create and set of intervals and freely switch to a higher or lower one. Please note: in the " From Median Price " display mode, it is easy to identify reversal points at intersections of levels from higher timeframes by lev

The Candle Patterns indicator provides a visual display of candlestick patterns. There are more than 100 patterns that can be displayed. The indicator allows for candles on the chart to be grouped and considered as one candle. This allows the price action within a candle to be observed in the context of a candlestick pattern. The number of bars per candle can be set in the parameters. All patterns can be filtered so that only patterns with certain attributes are displayed. The prior trend is tak

SkyNet EMA is an indicator will assist you by suggesting when to go long or short based on price action and the crossings of Exponential Moving Averages such as 14 period and 50 period. Just attach it to your chart and it will monitor the asset for potential sell opportunities and if found will paint a red arrow in your chart. Also will try to find buy opportunities and if found will paint a green arrow in your chart. It could be used with any currency but majors are recommended since they will
FREE

Reverse OCO is a utility shaped to trade the news. Given the eventuality of a rally related to an economic event, the user can schedule an OCO (one-cancel-other) order with automatically calculated TP/SL points. At scheduled time, Reverse OCO will check latest volatility (at current graph timeframe), and place an OCO order with lots and price channel calculated on the basis of the max loss acceptable for the user. It works with every product , every timeframe .
Parameters Event scheduling time

Extremum Search is designed to search for extremes, places where the price is likely to reverse and the current trend is likely to change to the opposite. With certain settings, the indicator can be used to define the current trend. The indicator works with any symbol provided that you have sufficient history data for a timeframe the indicator is launched at. It is recommended to attach Extremum Search on the timeframes from M1 to D1. Its calculations use 19 methods, which are selected by a cert

Determining the current trend is one of the most important tasks for a trader regardless of their trading style. Trend Scan is able to define a trend with a fairly high accuracy. The indicator applies the proprietary method in its calculations. Trend Scan is suitable for any currency pair and timeframe. It does not change its readings. The indicator takes into account the volume and volatility readings, combines them and displays the result as a histogram. The color of the histogram can be confi

顾问Ultimate USDCAD 是一个自动系统完全控制交易的过程,而不需要交易者的干预。 MQL5 Signals: https://www.mql5.com/en/signals/359190 Ultimate USDCAD的优点: 不要使用危险的交易方式 (亏损加仓, 平均数, 等级表, the night scalping 策略)。 包括一系列不同的战略, 使贸易变得更加多元化和安全的。 每个交易都受到止损的保护。 您可以使用我们的顾问与任何经纪人。 优化和测试时间超过4.5年。 我们的团队会保持迫切的参数,并根据须要我们的顾问会更新的。 在优化和测试时间,我们使用的实际刻度 (模拟质量99%) 并为该地段添加佣金,以便实际交易的结果是与测试最不相同。 顾问Ultimate USDCAD 很容易使用。为了风险管理只用一个外部参数RiskPercent。 为了开始在您的帐户赚钱,您需要做三个简单的步骤: 下载顾问Ultimate USDCAD。 以经纪人收集的历史数据为根据进行测试软件。 支付租费或买单。请注意第三次出售完整版软件以后我们将把全部价格提高2倍。 在您的帐户上运行

Expert Advisor Overview and Advantages The strategy is based on the support and resistance breakout principle; The EA uses Take Profit and Stop Loss; Supports multi-currency trading; Easy to use. Even for beginners; Wide choice of suitable currency pairs; Minimum initial deposit.
Trading Recommendations To start trading, drag the Expert Advisor onto the chart with recommended settings; I recommend using the multi-currency trading option by launching the EA on required currency pairs. Use Traili

The Bollinger R (Bollinger Reversals) is designed to recognize short term high profitable counter trend patterns from the chart. This system combines both Bollinger Bands and mean reversion to define positions where the market could potentially reverse direction. Description Bollinger Bands are well known in the trading community. General concept with Bollinger method is selling when the price touches the upper band and buying when the price touches the lower band. Even though it works perfectly
A must-have tool for any strategy based on divergence detection. 10 different oscillators can be used to detect divergences and can be combined with Double Top/Bottom patterns to confirm reversal signals. SCANNER is included . Now with Scanner you can find trading opportunities and setups easily and faster.
Features Easily detect strong reversal signals. 10 different oscillators are available for divergence detection. Divergence & Top/Bottom detection can operate independently or combined. Get

An automated Expert Advisor developed for Forex trading. - Expert Advisor is suitable for all types of accounts and with any type of spread.
- The number of decimal places in quotes is determined automatically.
- The EA does not require stopping during the news releases.
- The timeframe of the chart does not matter. This parameter is defined in the settings of the EA.
- The EA always uses Take Profit and thus it is less sensitive to the speed of the broker.
- The EA have two trailing stop modes.

This Expert Advisor is based on advanced neural networks.
Main EA features After training, the EA remembers the patterns of each currency pair . Therefore, re-training the currency pair is not required when changing a currency pair. Fixed Take Profit and Stop Loss levels are set in the inputs. Multi-currency trading . Monitoring of my accounts: https://www.mql5.com/en/signals/author/mizrael
Preparing for trade and training It is recommended to train the EA. For better understanding, we posted
ADX is one of the indicators most commonly used by traders. This version allows to extract the maximum amount of information without hassle of constantly switching between the timeframes and, thereby, greatly simplifies working with it. This is a standard ADX indicator provided with an info panel displaying the current relative position of -DM and +DM lines on all timeframes. Blue circle - uptrend. Red circle - downtrend. Yellow circle - no trend. Blue arrow - (+DM) > (-DM); Red arrow - (-DM) >

Brabux is a ready-made mechanical trading system. It works on all currency pairs and timeframes automatically adjusting to them. It also selects the most efficient trading parameters for receiving a necessary profit. In the indicator parameters, specify the trading period used for calculations and the least acceptable profit in points. Next, the system automatically selects the necessary trading parameters. Trading data is displayed on the info panel. After setting the indicator on the chart and

The Complex Fibonacci indicator automatically plots Fibonacci levels on all timeframes. When new extremes appear on the chart, Fibonacci lines are automatically updated in real time.
Indicator parameters Period for H1 - specify period for H1; Period for H4 - specify period for H4; Period for D1 - specify period for D1; Period for W1 - specify period for W1; Period for MN - specify period for MN; Lines name - enter the names for the lines here; Lines color - the color of the lines.

This Expert Advisor operates based on fractals and trade volumes, as well as other indicators. It is a more advanced version of Three Fractals , as it is able to analyze the trade volumes and features dynamic placement of take profit and stop loss depending on the current trading activity. The trading strategy remains the same (based on formation of several fractals), but slightly improved, additional parameters have been added.
Input parameters Lots - lot size (if Lots=0, then the lot will be

This indicator displays the trend movements.
Parameters XRMultiplier1: XR multiplier 1. XRMultiplier2: XR multiplier 2. Line1: line 1 movement (true/false). Line2: line 2 movement (true/false). XRTrend: XR trend displays Line 1 and Line 2 movements (true/false). X: move the trend left and right. Y: move the trend up and down. How to understand the status: If the Line is green, trend is up. If the Line is red, trend is down.

ISEEAutoTrade is a fully automated Expert Advisor, which does not require additional configuration. It is based on the trading experience of three traders and using common experience with indicators. With the built-in deposit protection, it does not use more than one percent of the deposit for opening trades. It is based on five indicators refined by personal experience. It features a system of protection against indicator contradictions. In case they disagree, the EA automatically closes the tr

This unique Expert Advisor utilizes a neural network. It is able to learn, analyze the options and choose the most efficient trading strategy.
Advantages Multifunctional (it can be trained to trade any currency pair). The minimum amount of initial investment is 50 USD or higher. The EA uses a protective stop loss. It prevents the risk of losing all funds on the account. Reliability (does not use high-risk strategies). Easy to use. Customer support and consultation.
Operation Principle The EA i
MetaTrader市场是您可以下载免费模拟自动交易,用历史数据进行测试和优化的唯一商店。
阅读应用程序的概述和其他客户的评论,直接下载程序到您的程序端并且在购买之前测试一个自动交易。只有在MetaTrader市场可以完全免费测试应用程序。
