 MetaTrader 5
 专家
专家
 指标
指标
 程序库
程序库
 实用工具
实用工具
 窗口小部件
窗口小部件
 规则
规则
适用于MetaTrader 4的新EA交易和指标 - 325
 EA交易自动执行市场交易,而指标可使您更准确地分析报价并预测价格行为。
通过这些应用程序,您将能够更明智地在MetaTrader 4执行交易,抓住更多的交易机会。
EA交易自动执行市场交易,而指标可使您更准确地分析报价并预测价格行为。
通过这些应用程序,您将能够更明智地在MetaTrader 4执行交易,抓住更多的交易机会。 
Magic Hedging is based on the hedging technique. The Expert Advisor tries to enter the market at the beginning of a trend. If the price moves in the unfavorable direction, Magic Hedging attempts to recover losing trades. It restores loss-making positions and tries to make them profitable by opening an opposite position with an increased lot. This opposite order can have a multiplied lot or a plus lot.
Requirements and recommendations Deposit min 10.000$ or optimal cent account Leverage 1:500 St
Modification of the Stochastic indicator with several types of alerts added to aid in your search for better opportunities in the market.
Product Features Email Alert Sound alert Push Notification (Alerts can be sent to your mobile phone) Signs on chart Alert box
Indicator Parameters Push Notification - This option enables your MetaTrader 4 to send alerts to your smartphone (IOS or Android). Email Alert - Configure your alerts to receive in your e-mail adress. SignOnChart - Enable drawing aler

Our indicator uses a unique price action candlestick pattern called Engulfing, this indicator represent the price action behavior on your metatrader4 chart. The indicator seek the most valuable engulfing pattern and identify those as support and resistance levels.
Indicator parameter Bars to calculate: maximum bars to seek. Alert Option: True / False. Candle bear: color for detected bear candle. Candle bull: color for detected bull candle. Base line style: style for the base line. Base line wid

One of the main goals in the development of this Expert Advisor was ease of use. As a result, this EA has a minimum of parameters, which are easy to understand. At the same time, it is very flexible and customizable for almost for any instrument (currency pair).
The logic According to the given algorithm, the EA determines local support and resistance levels (at startup, the previous quotes are disregarded). When a candle closes beyond any level, a deal is opened in the opposite direction, expe

Harrow Order is an Expert Advisor (EA) that works based on Support and Resistance, Martingale and Anti-Martingale methods. Support and Resistance is used to indicate the best position to place orders. Martingale is used to fix unprofitable orders. And Anti-Martingale is used for increasing potential profitable orders. This EA runs with two basic steps, namely try and execute. First, it will send one initial order to find out the market conditions at a nearest Support or Resistance level. Second,
FREE
GTAS Power is a momentum indicator that helps to determine deep trends using combination of moving averages. This indicator was created by Bernard Prats Desclaux, proprietary trader and ex-hedge fund manager, founder of E-Winvest.
Description The indicator is represented as a green or red histogram around a 0 equilibrium line.
How to use When GTAS Power is green, deep trend is bullish. When it is red, deep trend is bearish. This indicator can be use as a filter in addition to other GTAS indica
FREE

GTAS S-Trend is a momentum indicator that helps to determine trends using combination of MACD, RSI and moving averages. This indicator was created by Bernard Prats Desclaux, proprietary trader and ex-hedge fund manager, founder of E-Winvest.
Description The indicator oscillates between -65 and +65 with a neutral zone between -25 and +25 around a 0 equilibrium line. S-Trend between -25 and +25 indicates congestion zones with a bullish bias between 0 and +25, and a bearish bias between 0 and -25.
FREE

GTAS FidTdi is a trend indicator using combination of volatility and potential retracement levels. This indicator was created by Bernard Prats Desclaux, proprietary trader and ex-hedge fund manager, founder of E-Winvest.
Description The indicator is represented as a red or green envelope above or under prices.
How to use Trend detecting When the envelope is green, the trend is bullish. When it is red, the trend is bearish.
Trading Once a trade is opened, GTAS FibTdi shows retracement zones wh
FREE

Trade Master is advanced forex robot for manual trading and managing open trades. When attached to a chart it prints two buttons BUY and SELL. Using these two buttons you can trade manually by predefined Stop Loss, Take Profit and other parameters. Trade Master is also equipped with Trailing Stop system to protect the profits. Trade Master is the best tools for scheduled closing of trades. It can be used for closing trades for each weekday from Monday to Friday at specific time (hour and minutes
FREE

A mathematical multicurrency trading system based on the principle of a neural network. It uses a general database of algorithms "S1M1" consisting of the most stable trading algorithms in its work. Before getting into the "S1М1" general database of algorithms, each block of conditions has passed the testing for stability with the identification of certain market dependencies for that block. A network created in such a way allows the EA to automatically select the most optimal variant of response

Eternal Scalper Expert Advisor is a Scalping robot and is able to work with any currency pair in 15 Min timeframe. It uses Moving Averages to find trend and place orders. If it was a false signal the robot places a recovery order to recover the losses.
Advantages scalping trades any pair spread/execution-tolerant
Requirements Minimal deposit: $1000 ($10 for cent accounts) Account type: any Currency pairs: any Timeframe: M15
Settings General settings Slippage. ProfitFactor – dynamic factor bas
This indicator shows the levels and signal dots of the Doji pattern. The indicator allows traders to easily determine possible location of a price rebound. Doji is a candlestick with Open and Close price equal, or almost equal. It should also have shadows of approximately the same size on both sides. Doji denotes the balance between buyers and sellers, or the absence of major players, or level testing. This pattern can mean both a reversal and a continuation of the trend.
Indicator Parameters I

This indicator calculates the strength of the major currencies (EUR, USD, CAD, GBP, CHF, NZD, USD, JPY) and shows the top 4 strongest currency pairs that are currently in a high probability trend for the day or for the week.
Usage The indicator displays 8 currency pairs with a trend direction (e.g. "EURUSD-DOWN") and ranked according to strength, with 1 being ths strongest. There will be 4 pairs for intraday and 4 pairs for intraweek If a currency pair is present in the top 4 intraday, it is in
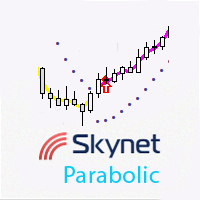
This indicator displays the entry points for buying and selling, with additional push notifications. It is based on the classic Parabolic SAR indicator, price smoothing model and certain mathematical methods for a greater variability in finding market entry points.
Advantages Fewer wrong entries compared to the use of classic breakout and trend confirmation indicators. Signals are not redrawn. A large number of customizable parameters. Visualization of the bullish and bearish trend. Used for id
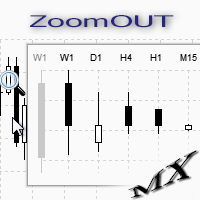
ZoomOUT allows you to have a quick look at a selected bar on a higher timeframe in a pop-up window. After the launch, the indicator works in the background mode occupying no place in the chart and consuming no resources. When activating the indicator by Shift + o (customizable), a pop-up window with a chart displaying bars of higher timeframes is created. To hide a pop-up window, left-click on any clear place on the chart. The indicator is simple and requires no settings.
FREE
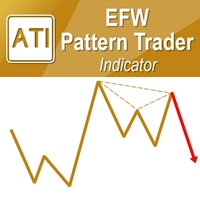
EFW Pattern Trader is a powerful pattern scanner for Forex and Stock trading. The pattern detection in EFW Pattern Trader uses the Fractal Wave Theory, which captures the endless up and down movement of the market. Therefore, EFW Pattern Trader can be considered as the robust price action indicator. Any patterns in EFW Pattern Trader can be backtested visually in your strategy tester. Visual backtesting with pattern will show you how pattern will likely behave in the live trading. Therefore, you

It can only be used in EURCHF / M15 . The Expert Advisor is a great tool that allows you to control your trade with ease and precision. The tool can be moved in the graphs and offers the following characteristics:
Instant order entry with a single click. Entry of pending orders using price tags and trend lines. Instant order closure with a single click. Instant order closure using trend lines as output levels that the broker can not see. We can modify the way to enter and exit the market, allow
FREE

The Roll indicator is designed for finding local extremes and determining the current trend. The indicator is based on the volume and volatility values. Indicator calculation can be modified by activating the Modification parameter and choosing one of the available calculation options from CalcMode . To be able to determine current trend using this indicator, you should increase the value of the OsPeriod parameter and decrease the values of DynamicLevelPeriod and ShiftDynamicLevel . The indicato

Determining the current trend is one of the most important tasks for a trader regardless of their trading style. Linear Trend can help you with this task. Linear Trend is a trend determining indicator, which uses an original calculation algorithm. The indicator is suitable for any currency pair and timeframe. It does not change its readings. The product applies three methods selected by a certain parameter and an additional modification of results. Due to the variety of settings and filters, the

The Tequila Sunrise (TSR) makes “buy” trades on the USDMXN during morning times of high volumes. The EA uses a combination of the Stochastic Oscillator, Force Index, and a price action algorithm across different timeframes to determine whether or not it takes a trade each particular day. Instead of a take profit target, the EA uses an algorithm to determine when to close the trade. It is designed to run on the 5 minute charts on a daily basis.
Parameters Magic Number : This is a unique identifi

The indicator will help you find support and resistance levels, increase the number of confirmations for stronger levels. This is not a multi-timeframe indicator that refers to the information from other timeframes. But it allows to show strong levels of support and resistance where the price respects a mark two or more times. How to trade: For smaller timeframes up to M30 I recommend at least 3 confirmations. This filters stronger levels with subsequent strong movements. For larger timeframes o
Free version. Only works on EURUSD. Would you like to have statistics about your trades displayed while you operate? Have you a solid understanding of the symbol you are trading? Do you really know everything you need to about your trading account? Do you need to keep an eye on the local times around the world? Advanced Info Displayer answers to all that. It is the ultimate tool to know all sort of useful information and hidden or hard to find data. It is important if you are serious about tradi
FREE

This indicator helps you to Scan symbols which are in the Market Watch Window and filter out trends with alerts. It works based on the effective indicator "SUPERTREND" which is used by many traders for trading: When box color changes to " Green " or " Red " color, it indicates you for trend change for long and short entry. And also you will get alerted on screen. When it changes to " Green ", it indicates you that trend is going upwards, and you can take the long entry. If the color changes to
FREE
Would you like to have statistics about your trades displayed while you operate? Have you a solid understanding of the symbol you are trading? Do you really know everything you need to about your trading account? Do you need to keep an eye on the local times around the world? Advanced Info Displayer answers to all that. It is the ultimate tool to know all sort of useful information and hidden or hard to find data. It is important if you are serious about trading and you value statistics and mat

This Expert Advisor uses scalping as its main strategy based on a statistical model called Bollinger Band. It embedded with two exit market strategies called 1st and 2nd dagger. The 1st dagger exits on the mid line of the band and the 2nd dagger exits by trailing until the maximum profit. It is recommended to use both strategies to lower the risk since it would split the lot into half for each dagger. Recommended: M5/M15, EURAUD/GBPAUD, ECN account Please add the news link ( http://ec.forexprost

This is an individual tool for analyzing the market situation. It is very simple to use. After attaching the indicator to the chart, you will see three vertical lines named "VLine 1", "VLine 2" and "VLine 3", following in this order from left to right. For the utility to operate correctly, this sequence should always be observed. Please note: at the first start, the lines are not bound to specific price levels on the chart. This should be done by user in accordance with the following rule: if li

Index Hub is designed for creating multi-currency indicators using up to 14 currency pairs and any of 6 indicators: Stochastic, WPR, RVI, RSI, Force and CCI. An example with three pairs and the CCI indicator: CCI(USDCAD)+CCI(USDJPY)+CCI(USDCHF) / 3 = CCI(Index Hub).
Application Index Hub is suitable for the following types of trading: basket trading, scalping and arbitrage strategies. For example, if you need to use Stochastic for scalping purposes, set two indicators on EURUSD with currencies

Currency Strength 7 技术指标是一个强大的工具,旨在帮助交易者衡量七种最受欢迎货币的强度。通过分析澳元、美元、欧元、英镑、日元、瑞士法郎和加元的实力,该指标提供了对货币动态的宝贵见解。它在图表上使用线条表示货币强弱,让交易者能够快速评估不同货币的相对强弱。 该指标的突出特点之一是它能够在图表上绘制大量历史数据。这种全面的历史视角使交易者能够更有效地分析市场走势并做出明智的交易决策。通过更好地了解过去的趋势和模式,交易者可以增强他们预测未来货币走势的能力。 货币强度 7 指标利用移动平均线数据来指示每种货币的强度。它使用“+”和“-”符号分别表示强势和弱势头寸。这种清晰的视觉表示简化了货币强度信号的解释,使交易者能够快速评估市场状况。此外,该指标与各种时间帧兼容,但特别推荐用于其信号更可靠的更高时间帧。 该指标提供用户友好的参数,使其易于定制和适应个人交易偏好。交易者可以选择通过调整移动平均线参数来过滤信号,从而进一步完善并与特定交易策略保持一致。 为了提供清晰的视觉呈现,货币强度 7 指标在单独的窗口上绘制其信号,确保它们脱颖而出并且不会干扰其他图表元素。这种分离提高

This is a utility designed to automatically set the stop loss levels of orders according to the specified condition. Two price levels serve as the condition for setting stop loss: Trigger level - when this level is reached, an order is placed. The stop loss value of an order. It is possible to enable or disable traling stop loss.
Input parameters Order type for execution - type of orders to be processed by the expert. It can either be BUY, SELL or auto-select. Trigger Level Points - level to pl

BillWill 该指标基于取自书中的材料:Bill Williams。交易混乱。最大化利润的专家技术。 每个柱形顶部的指标读数是根据开盘价和收盘价相对于柱形三分之一处的位置计算的。小节分为三个部分,小节的下三分之一是三号 (3),小节的中间三分之一是二号 (2),小节的上三分之一是一号 (1)。指标读数中的第一个数字是开盘价相对于柱的三分之一的位置,第二个数字是收盘价相对于柱的三分之一的位置。 每个柱形底部的指标读数计算为柱形中间相对于前一个柱形极值的位置。
指标读数定义 1-1 开盘价和收盘价位于柱线的上三分之一 2-2 开盘价和收盘价位于柱线的中间三分之一 3-3 开盘价和收盘价位于柱线的下三分之一 3-1 开盘价在柱的下三分之一处,收盘价在柱的上三分之一处 2-1 开盘价在柱的中间三分之一,收盘价在柱的上三分之一 3-2 开盘价在柱线的下三分之一处,收盘价在柱线的中间三分之一处 1-3 开盘价在柱的上三分之一,收盘价在柱的下三分之一 2-3 开盘价在柱的中间三分之一,收盘价在柱的下三分之一 1-2 开盘价在柱的上三分之一,收盘价在柱的中间三分之一 “+”(加号)标记中间高
FREE

Sidus 该指标是一种交易策略。基于 3 个标准指标:两个移动平均线 (MA) 和一个相对于强度的指数 (RSI)。指标信号是移动平均线的交叉和RSI指标相对于50水平的同时定位,如果快速移动平均线高于慢速移动平均线,RSI指标高于50水平,则假设买入。如果快速移动平均线低于慢速移动平均线且 RSI 低于 50 水平,则假设卖出。
指标设置说明 bar_limit - 限制在指定数量的柱上显示指标;如果 = 0,则显示在所有可用的柱上。 Period_FastMA - 快速移动平均周期。 Period_SlowMA - 缓慢移动平均线的周期。 Period_RSI - RSI 指标的周期。 ma_method_MA - 移动平均平均法。 Applied_price_MA - 应用移动平均价格。 Applied_price_RSI - RSI 指标的使用价格。 警报 - 显示包含用户数据的对话框。 Text_BUY - 购买信号的自定义文本。 Text_SELL - 卖出信号的自定义文本。 Send_Mail - 向在“邮件”选项卡上的设置窗口中指定的地址发送电子邮件。 主题 -

Universal copier of deals from MetaTrader 4 to MetaTrader 4 ( MT5<->MT5 version is available ; with both versions, you can copy MetaTrader 5<->MetaTrader 4, MetaTrader 4<->MetaTrader 5, MetaTrader 5<->MetaTrader 5, MetaTrader 4<->MetaTrader 4). Spread filter. Select the best price (start copying positions with a profit or loss). Configure the lot size, fixed or ratio-based (provider signals can be copied with an increased lot). Configure order copying (include pending orders or copy only open po
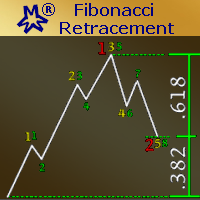
The EA Strategy: This EA strategy is based on Fibonacci Retracement Calculations to produce it's own signals and trade automatically. It was built for those traders who loves and trust Fibonacci Retracement Levels. In finance, Fibonacci retracement is a method of technical analysis for determining support and resistance levels. They are named after their use of the Fibonacci sequence. Fibonacci retracement is based on the idea that markets will retrace a predictable portion of a move, after whic

The indicator displays market entry arrows based on RSI, MFI, DeMarker, CCI and Multi Stochastic.
Inputs period — values of all indicators used. Enable_Alert — audio and text notifications on a trend change. Send_Notifications — push notifications to mobile devices. E-mail alert — email notifications. Make sure to configure email parameters in the terminal settings.
Features The indicator does not repaint. The indicator does not recalculate. The indicator works on all timeframes. The indicator
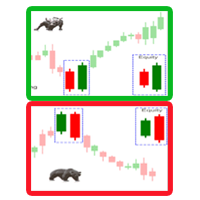
A trend reversal indicator based on the Candlestick Pattern. A candlestick pattern is a movement in prices shown graphically on a candlestick chart that trader can predict a particular market movement. Engulfing Pattern: A reversal pattern that can be bearish or bullish, depending upon whether it appears at the end of an uptrend (bearish engulfing pattern) or a downtrend (bullish engulfing pattern). The Engulfing Of Sparta indicator is an improved variant of the Candlestick Pattern, which shows
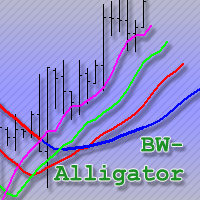
An improved version of the classic Alligator indicator by Bill Williams.
Description The Alligator technical indicator is a combination of moving averages (balance lines). Blue line (Alligator Jaw) is a 13-period smoothed moving average, shifted by 8 bars into the future; Red line (Alligator Teeth) is an 8-period smoothed moving average, shifted by 5 bars into the future; Green line (Alligator Lips) is a 5-period smoothed moving average, shifted by 3 bars into the future; Purple line (Fast Gato

The Master Pivot indicator is a very interesting generator of static levels based on historical percentage variation. The levels are completely customizable changing the input numbers. Period can also be modified to select the preferred Time Frame. The color is flexible so you can change color easily, we recommend a red color upper and lower green for a contrarian style, conversely instead for a style follower trend. This indicator used in a confluent way offers some really interesting ideas.
I

Background It only needs a small initial deposit. Immunity to the large delay and the size of the spread. Monitoring of my accounts : https://www.mql5.com/en/signals/author/mizrael
Operation Principle The EA opens orders at modifiable Fibonacci levels. Each subsequent order is opened at a new Fibonacci levels with a volume increased Martingale times. The EA determines the total profit of orders with the same Magic number. If it exceeds the value of Profit , then the orders are closed.
Recom

The main goal of the indicator is to determine the most optimal points of entry and exit from a trade. The indicator consists of three parts. The first one is arrows displaying the most efficient market entry/exit points. The up arrow is a buy signal, the down arrow is a sell one. The indicator contains an analytical analysis algorithm that includes a set of standard indicator readings, as well as a custom algorithm. The second part is data in the upper right corner (works on М1-D1 timeframes) o

This Expert Advisor is a night scalper. It works at the end of the American session and at the beginning of the Asian session. The working timeframe is M15. It uses standard indicators for market entries and exits. Take profit and a protective stop loss are set for each order. However, orders are most often closed based on indicator signals. See the Comments page for ready .set files for traded currency pairs. The EA has an optional news filter which is based on a news indicator. IMPORTANT : Par
The GTAS BSI is an indicator designed to provide the trend direction and buy/sell signals, using combination of momentum indicators. This indicator was created by Bernard Prats Desclaux, proprietary trader and ex-hedge fund manager, founder of E-Winvest.
Description The BSI indicator is represented as a histogram under the price chart. +100 (green) value indicates a bullish trend. -100 (red) value indicates a bearish trend. When the BSI turns to +100 (green), it gives a potential buy signal. Wh
FREE

The indicator measures volumes on different charts and instruments. Its main advantage is the ability to compare separate brokers. The less Middle Volume and Tick / Second , the more reliable is the broker. There is a comment in the upper left corner Comment data: Tick/Second — number of ticks per second for a selected instrument Middle Volume — average volumes in the penultimate bar This indicator allows tracking a relative market activity for different timeframes. If the volumes are lower than
FREE
SymbolAutoChanger MT4
There is also PRO version for MetaTreader5 There is also PRO version for MetaTreader4 This tool allows you to automatically change the chart symbols in a loop. Example: EUR → GBP → JPY → CHF → CAD → AUD → NZD You need only to set up interval in seconds between auto switch. Also, you can choose whether to switch between all symbols provided by your broker or only between symbols available in the Market Watch window. Demo version is limited to 4 symbols. Full version allows
FREE
SymbolAutoChanger MT4 There is also PRO version for MetaTreader5 There is also PRO version for MetaTreader4 This tool allows you to automatically change the chart symbols in a loop. Example: EUR → GBP → JPY → CHF → CAD → AUD → NZD You need only to set up interval in seconds between auto switch. Also, you can choose whether to switch between all symbols provided by your broker or only between symbols available in the Market Watch window.
There is also PRO version has following featuters: Next b
The BinaryFiesta indicator has been developed and adapted specifically for trading short-term binary options. The algorithm of the indicator analyzes numerous factors before generating a signal. The indicator is installed in the conventional way. The indicator consists of an information window, which displays the name of the trading instrument, support and resistance levels, and the signal itself ( BUY , SELL or WAIT ). A signal is accompanied by a sound and a pop-up Alert.
Advantages of the in

The Expert Advisor looks for technical analysis patterns formed on the higher (hourly) timeframe to start working on the 5-minute chart. Technical analysis patterns used: double top/double bottom, head/shoulders, flag, expanding/narrowing triangles. The Relative Vigor Index technical indicator is used as the filter for opening deals. It is based on the idea that on the bull market the closing price is, as a rule, higher, than the opening price. It is the other way round on the bear market. This

The panel shows the relative position of the price and the selected moving averages (MA) for the selected timeframes and symbols.
You can simultaneously control: up to 3 symbols; up to 6 periods; up to 10 different Moving Averages. Version for MetaTrader 4: https://www.mql5.com/ru/market/product/28281 Version for MetaTrader 5: https://www.mql5.com/ru/market/product/28096
Parameters NUM_BAR - number of the bar to analyze (set a value greater than 0 to work on closed bars). timeframe_1....timefr
FREE

This is a simple indicator to show if global and local trend directions are the same. It uses two timeframes, a "local" timeframe and a higher order "global" timeframe. The indicator shows price action only and has no lag. It generates a square wave (green line), the output signal is above zero if the price tendency is bullish upward, and below zero for bearish downward tendency. The red line shows the tendency of a higher order timeframe (the global tendency). The idea is to trade long when pri

MayaTradeManager is a pure & 100% manual trade orders management. MayaTradeManager doesn't have any indicators or signals to be used together since all trades are done by the user only. MayaTradeManager is an good tool usually for whoever that has a signal at the user disposal but don't have the one-stop-center to manage their trades conveniently. MayaTradeManager brings all of the trades management into one simple panel in a very convenient way.
Just a quick note Lot size box is an editable bo
FREE

Sweep Trend 指标在图表上以矩形的形式根据指定的设置标记价格变动的波动部分。
设置说明 TrendPips - 过滤点值 TrendBars - 以柱数为单位的过滤值 signal_shift - 相对于当前柱向后移动指定数量的周期,对于信号 CountBars - 显示指标的柱数 Color_1 - 交替矩形的颜色之一 Color_2 - 矩形的第二种颜色 警报 - 显示包含用户数据的对话框。 文本 - 信号的自定义文本。 Send_Mail - 将电子邮件发送到“邮件”选项卡上的设置窗口中指定的地址。 主题 - 电子邮件标题。 Send_Notification - 向移动终端发送通知,其 MetaQuotes ID 在“通知”选项卡的设置窗口中指定。 对于开发者:该 指标有一个信号缓冲区,其值在显示矩形形成后等于1,其他情况下等于0。该指标的调用方式如下: double indicator_signals = iCustom( Symbol(), 0, "Sweep Trend",TrendPips,TrendBars,signal_shift, 0, 1); 建
FREE
The Controversial 5-Step System That Professional Traders Use To Unlock Trading Success!
Reversal Pro effectively combines price action, ideal location and reliable statistics in one smart algorithm. Understanding the market in this unique perspective allows you to recognize reversals professionally.
Discover The Secret Of Professional Traders
Get instant access www.mql5.com/en/blogs/post/716077 Copy & Paste what professional traders are doing right now!
How To Trade Step 1: Trade Setup Sta
xCalper Triad works as a Target scanner tool. Its algorithm calculates price level areas with high precision and instantly. By default, they are automatically identified and the trader normally sets visual parameters only. Explore a new perspective in price action analysis by adding Triad to your setup and surprise yourself.
Main Features Automatic & exclusive Target levels Daily candle representation in all intraday timeframes. Side panel information essential to all traders: Remaining time to

This indicator is designed for trading pending stop orders at the calculated levels. These levels are marked with the names “BUY STOP” and “SELL STOP”, and corresponding price labels. In addition, the indicator informs the user about the preferred trade direction using arrow, as well as other available means of notification, which can be customized.
Parameters Type of Calculation - type of calculations: Price Close – based on Close prices. Price High Low – based on High and Low prices; Design m

This is a free demo version for USDJPY only. Here is the link to full version: https://www.mql5.com/en/market/product/25912 This product has no input parameters. The product helps you to open and close orders faster, include instant and pending orders. It helps you to open order faster and easier, to make an order you simply click on the button.
Buttons List BUY/SELL: to open instant Buy or Sell orders. BUY STOP/BUY LIMIT/SELL STOP/SELL LIMIT: to open pending order. The distance to the current
FREE

This product has no input parameters. The product helps you to open and close orders faster, include instant and pending orders. It helps you to open order faster and easier, to make an order you simply click on the button.
Buttons List BUY/SELL: to open instant Buy or Sell orders. BUY STOP/BUY LIMIT/SELL STOP/SELL LIMIT: to open pending order. The distance to the current price is "Dis" (below of these buttons). SL/TP: Distance in point far from the current price, to put stop loss and take prof
If you are using volume spread analysis, whether your are a beginner or an expert, this system will give you a lot of features and help in your analysis. Please watch the video to see all the features.
Features With one click you will find all the VSA patterns on your chart . Bars without opening price. Easy to read volume indicator. Bar reader (Bar type - Close type - Volume type - Spread type). Daily and weekly levels (Pivot - Camarilla - Fibo). Very light on the trading platform and moving b
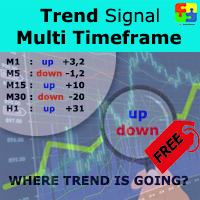
Free version. Only works on EURUSD. Do you want to always know in a quick glance where price is going? Are you tired of looking back and forth between different timeframes to understand that? This indicator might just be what you were looking for. Trend Signal Multitimeframe shows you if the current price is higher or lower than N. candles ago, on the various timeframes. It also displays how many pips higher or lower current price is compared to N. candles ago. Number N. is customizable The dat
FREE
Stoch–Cross Scalper is an Expert Advisor based on the Stochastic oscillator indicator using the 80 threshold as overbought and 20 as oversold while utilizing a 14 day rolling period to analyze High and Low closing prices in relation to the current close price. The Stochastic oscillator is a commonly used indicator and many trading philosophies are based upon it. This expert is the result of over ten years of my fine tuning and perfecting this trading system. Almost all of the indicators availabl
FREE

This indicator displays the short-term trend direction and flat areas in the same way as the classic Heiken Ashi indicator, but it is not plotted using candles or a moving average, but rather the Skynet Moving Average indicator.
Advantages no delay, or a slight delay when using the 'smooth' parameter. customizable parameters for any price data and timeframes. visualization of the flat and the short-term trend. unlike the classic Heiken Ashi indicator, the frequency of candles changing from bull
"All in One" Expert Advisor. The EA collects information from different signals (listed below) on the selected timeframes. Each signal has its own weight. The weight of all signals is summed. If the total weight of signals for a timeframe is greater than the minimum weight, a deal is opened. Operation on each selected timeframe is performed independently. After that, the deal is managed according to the Money Management conditions.
It can work simultaneously on: up to 6 periods; up to 31 popula
FREE
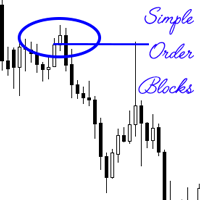
An order block also known as a block of order is a significant order placed for sale or purchase of a large number of securities. They are often used by institutional traders, and is a different way of looking at support and resistance. These levels are temporally used, before new levels and areas of interest are created. The simple order block indicator attempts to find the order blocks, which are more often than not optimal trade entries. The primary strategy when using the indicator when maki
Buy or rent it and request a copy of the Antimartingale EA for free Trendline based utility, you design your trendlines or horizontal lines, the EA opens trades for you Possibility to trade on break and/or bounce events Indipendent break and bounce settings Configurable market, stop and limit orders T1T2 Logic to lock profits and minimize losses Trailing Stop Loss Max Spread check Notifies you when your trendlines are crossed No strange trendline name or syntax, you decide the color of tr

If you need to quickly evaluate the results of trading on a current financial instrument by hypothetical price movement in the chosen direction and up to a certain level, set the indicator on any chart that contains open positions and move the line to the desired level after it appears together with the results tab. This is all you need to understand what happens to your deposit if the price is at this level without taking into account existing stop loss and take profit. Enable considering pendi

The algorithm of this Expert Advisor determines the significant price levels, where the trend often turns into a flat or reverses. Stochastic Oscillator serves as an additional filter of overbought/oversold zones. The EA sets stop loss and take profit after opening an order. The underlying trailing strategy applies a trailing stop. The EA is recommended for simultaneously use on three trading instruments: EURUSD M5, GBPUSD M5, EURCHF M5. Settings:
Comment to order - comment to orders. MaxRisk -

Trade Click is a trading panel allowing you to perform trading operations with one click based on your risk preferences. The panel allows trading any financial instrument and provides options for fast changing of symbols or periods. You can choose to enter a trade and automatically calculate your lot size based on how much of your account you want to risk. You can also set a fixed volume for your trades. Set your desired stop loss and take profit levels in points. The "Close For Symbol" button a

The indicator displays potential entry points on a trend, displaying buy level, sell level and golden point which will determine where to get out of the trade or trail your stops. If an entry is detected, the indicator shows and Arrow, either pointing down for Short and up for Long positions. When the golden point is passed during a trade, it will start drawing potential points for trailing, is then up to you how to manage your trade. This indicator has been built for best results on H1 Time fra

Reversal Alert Pro 指标是一款功能强大的工具,旨在自动检测市场的反转区域。它提供直接发送到您的移动设备的方便通知,并显示带有声音的弹出式警报。通过将该指标纳入您的交易策略,您可以有效地过滤交易头寸。此外,该指标提供了利用 CCI、RSI 和随机指标进一步细化生成的信号的选项,从而增强了其通用性和适用性。 Reversal Alert Pro 指标的主要特点之一是它适用于所有时间范围和交易品种。无论您喜欢哪种交易方式或您交易的市场,该指标都能适应您的需求。参数设置设计为人性化,可以根据您的喜好轻松配置和定制。 当应用于您的图表时,该指标会快速绘制信号,使您能够迅速识别潜在的反转区域。这些信号可以通过您选择的周期、CCI、RSI 和随机指标进一步过滤,提供额外的精度层和对生成的警报的控制。 在指标的参数中,您可以灵活地调整各种设置。其中包括定义计算周期、指定从蜡烛高点/低点绘制箭头符号的距离,以及自定义具有不同颜色和字符的买卖符号的外观。 要进一步细化信号,您可以激活 CCI、RSI 和随机信号过滤器。这些过滤器允许您设置特定水平和平均周期,以根据各自的指标确定买入和卖出

The Trading Assistant can apply automatic exits, set pending orders when trading is closed, scale trades and much more. The tool is easy to handle and clear, it works smoothly with one or more orders.
Features Scheduling of pending and market order - useful for time based strategies or for preparing an order when the market is closed Automatic stop to break-even point for position protection Independent profit taking by the crossing of two moving averages - ideal for trend strategies Finely adj

YPY Trading Aggregator is a universal multifunctional software package for aggregation of trading. This functionality can be useful for multicurrency trading and/or application of multiple experts on a single trading account, as well as for combining automatic and manual trading. Also, anyone can use this utility to estimate the risk of the current online trading on the account (the maximum possible losses in % of the account balance). The utility aggregates the data of the active trade and outp

The support and resistance levels are among the main components of the entire technical analysis. They are used both by professional traders and by beginners. Prices usually move within the price channels. The upper boundary of such a channel is called resistance, and the lower one is support. This indicator plots fractal support and resistance lines at the highest and lowest local price values (fractals).
Distinctive features Does not redraw. Clear and understandable signals. It is possible to
学习如何在MetaTrader AppStore上购买EA交易,MetaTrader平台的应用程序商店。
MQL5.community支付系统支持通过PayPay、银行卡和热门付款系统进行交易。为更好的客户体验我们强烈建议您在购买前测试EA交易。
