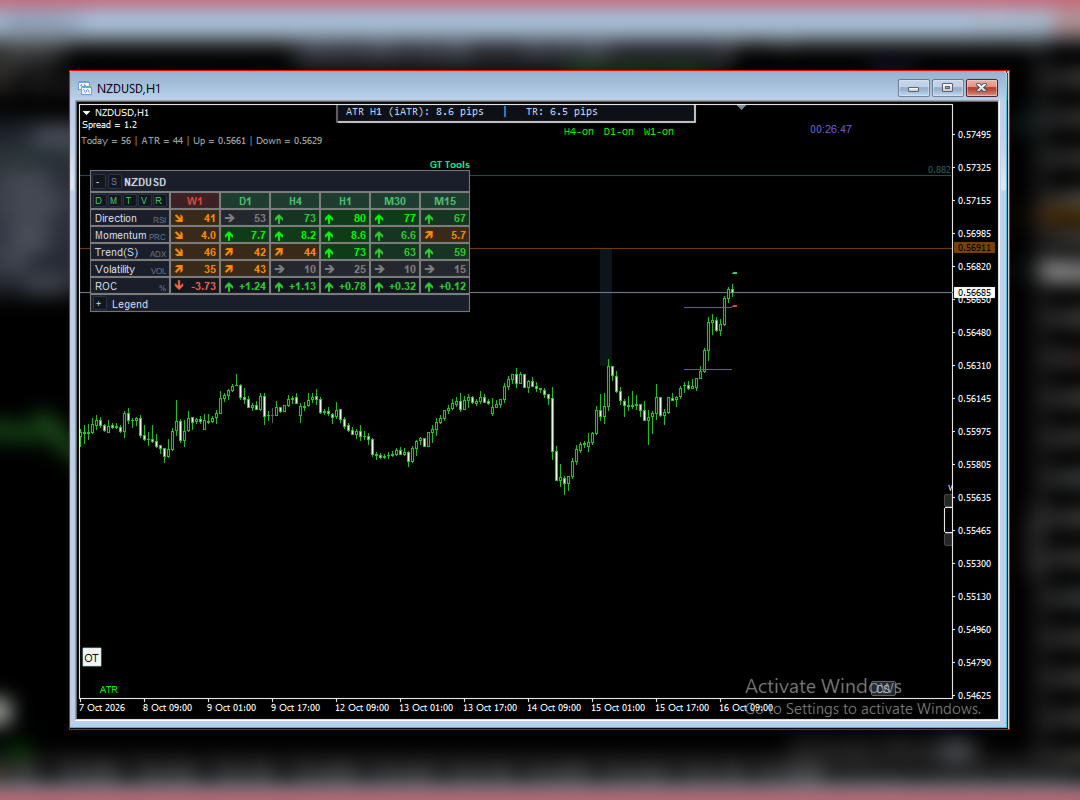
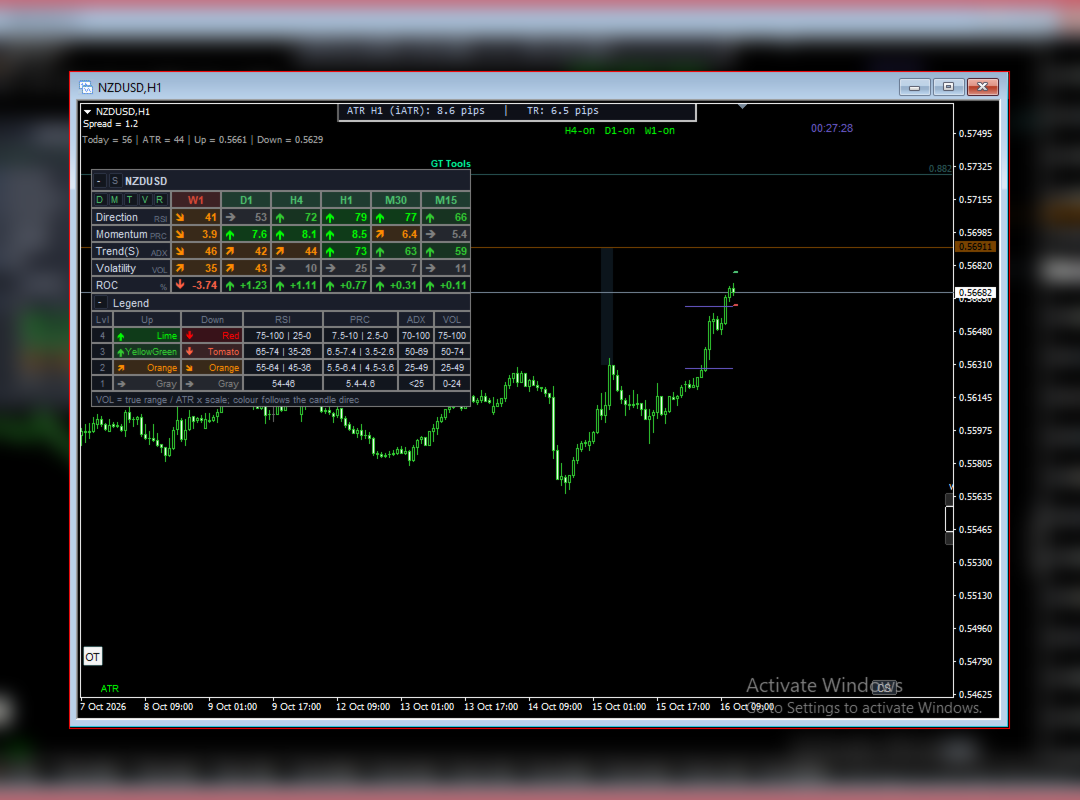
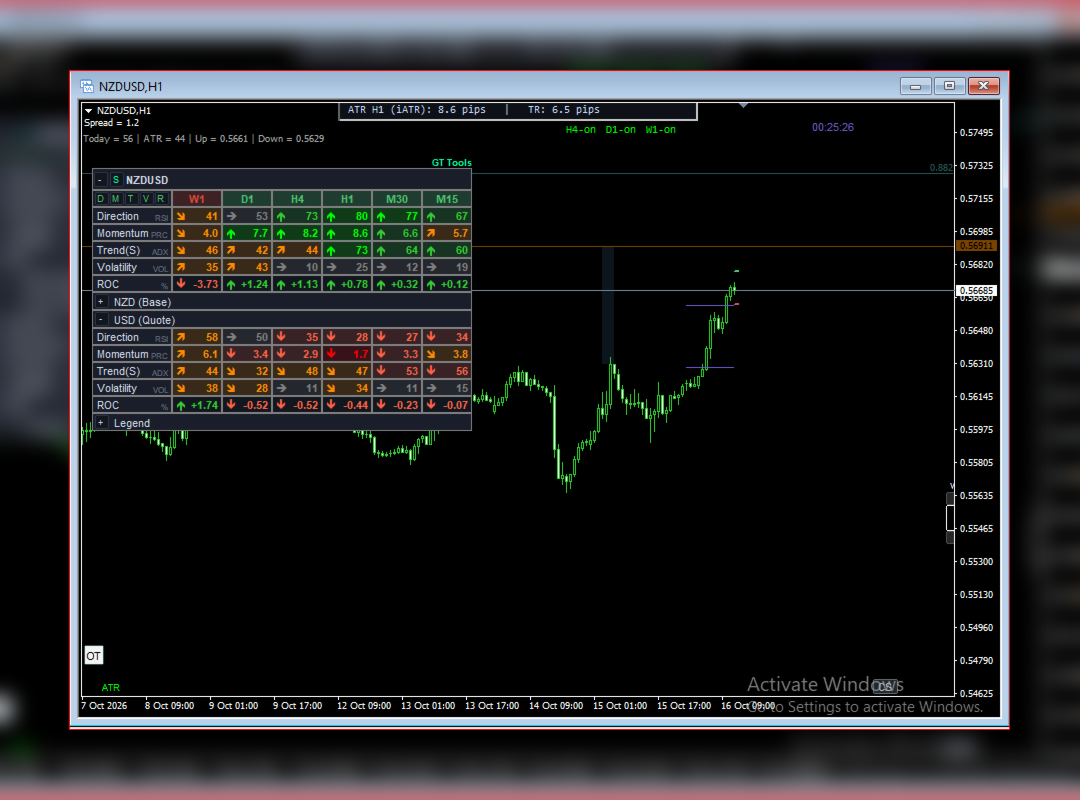
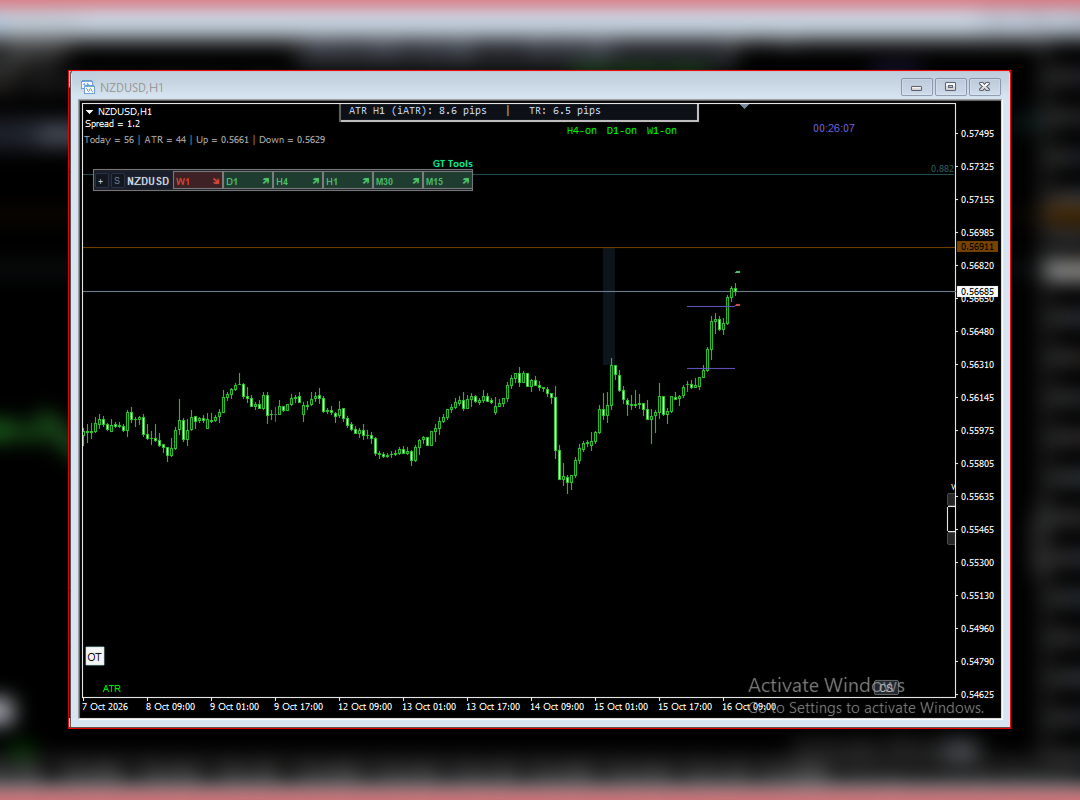
GT Direction Dashboard

GT Direction Dashboard — Comprehensive User Manual & Technical Guide

1. Executive Summary & Core Purpose

The GT Direction Dashboard is a multi-timeframe, multi-metric currency alignment dashboard built for MetaTrader 4. It is designed to solve one of the greatest challenges manual currency traders face: Analysis Paralysis and Information Overload.

Rather than manually switching across 6 or 8 timeframe charts ( MN1 down to M5 ) and adding 4 or 5 separate indicators (RSI, ADX, PBR, Volatility, ROC) to each chart, the GT Direction Dashboard aggregates all critical trend, momentum, volatility, and velocity data into a single, compact UI directly on your main chart.

Primary Trading Intent:

  1. At-a-Glance Market Conviction: Instantly evaluate whether a currency pair is in a high-probability institutional trend across timeframes or stuck in a choppy range.
  2. Eliminating the "No Alignment Trap": Using a Tiered Alignment System (Grade A vs. Grade B), the dashboard highlights early momentum breakouts before lagging trend filters (like ADX) delay your entry.
  3. Basket Dynamics: Optionally evaluates the underlying Base Currency and Quote Currency against their respective 7 major market pairs to confirm whether the move is driven by true currency strength/weakness or single-pair noise.

2. Key Indicators & Metrics Explained

The dashboard compiles 5 core parameters for every visible timeframe:

1. Direction — Wilder’s Relative Strength Index (RSI)

  • Sub-label: RSI (14-period)
  • What it measures: The underlying directional momentum relative to 50 midpoint.
  • Interpretation:
    • $> 50$: Bullish bias (scored into levels based on distance from 50).
    • $< 50$: Bearish bias.

2. Momentum — Dual Mode (Impulse EMA vs. PBR Range)

  • Sub-label: PBR (Selectable in settings: MOM_IMPULSE_EMA or MOM_PBR_RANGE )
  • Mode A — Impulse Momentum ( MOM_IMPULSE_EMA ):
    • Measures price distance from a fast Exponential Moving Average (EMA 20) normalized by ATR(14).
    • Usefulness: Highly responsive to real-time price acceleration. Smooths out minor noise while identifying strong trend expansion.
  • Mode B — PBR Range Position ( MOM_PBR_RANGE ):
    • Measures where current price sits within the $N$-bar High-Low range.
    • Usefulness: Excellent for detecting proximity to recent support/resistance boundaries.

3. Trend — Average Directional Index (ADX)

  • Sub-label: ADX (14-period)
  • What it measures: Institutional trend strength regardless of direction.
  • Coloring: Colored by the Direction side of 50 (Green if RSI $> 50$, Red if RSI $< 50$).
  • Interpretation:
    • $< 25$: Weak/Choppy trend.
    • $25 - 49$: Developing trend.
    • $50 - 69$: Strong trend.
    • $> 70$: Extremely strong / parabolic trend.

4. Volatility — True Range / ATR Ratio with Net Body Delta

  • Sub-label: VOL
  • What it measures: Magnitude of current bar expansion.
  • Net Body Delta Filter: Evaluates body-to-range ratio.
  • Usefulness: Prevents false directional signals on long-wick rejection candles (e.g. Shooting Stars or Hammers), coloring them neutral when rejections occur.

5. ROC — Rate of Change (%)

  • Sub-label: % (14-period)
  • What it measures: Percentage price change over $N$ bars.
  • Usefulness: Identifies mathematical velocity and sign agreement ($+$ vs. $-$).

3. The Tiered Alignment System

To ensure you never miss explosive moves while waiting for lagging indicators to catch up, the dashboard features a two-tier alignment architecture:

+-----------------------------------------------------------------------+ | GRADE A (Full Alignment) --> Solid Bright Green / Red Fill | | - All active rows agree (Direction, Momentum, ADX, Volatility, ROC). | | - Maximum conviction for position sizing or trend holding. | +-----------------------------------------------------------------------+ | GRADE B (Early Impulse) --> Tinted / Muted Green / Red Fill | | - Core Impulse parameters agree (Direction, Momentum, ROC). | | - Catches fast breakout turns BEFORE lagging ADX turns green. | +-----------------------------------------------------------------------+ | GRADE 0 (Neutral / Choppy) --> Dark Background | | - Mixed parameters; low probability for directional trades. | +-----------------------------------------------------------------------+

4. Advanced UI Features & Controls

  1. Smart Collapsed Header:
    • When the panel is toggled off ( - button), the header transforms into a compact alignment ticker bar.
    • Displays all active timeframe cells with embedded arrow icons and color shades, allowing full market overview in just 22 pixels of vertical space.
  2. Sub-panel Toggle ( S Button):
    • Instantly collapses or expands the Base and Quote currency basket sub-panels ( AUD and NZD ) directly from the header without opening settings.
  3. Mini Parameter Buttons ( D , M , T , V , R ):
    • Located in the top-left cell below the pair name.
    • Toggles individual row calculations on/off with clean text-color highlighting, instantly recalculating alignment for only your chosen parameters.
  4. Independent Column Width ( ColWidth ):
    • Guarantees that timeframe column widths strictly obey your input preference regardless of panel scaling.

5. Advantages for Active Traders

  • Speed & Execution Confidence: Reduces multi-timeframe analysis time from minutes to milliseconds.
  • Early Entry Advantage: Grade B alignment alerts you to early impulse moves at the exact moment velocity starts.
  • Wick-Rejection Protection: Net Body Delta filtering prevents buying into top-wick rejections or selling into bottom-wick spring rejections.
  • Basket Validation: Verifies whether a move in NZDUSD is driven by genuine NZD strength across all major pairs, or just a temporary USD blip.
  • Ultra-Lightweight Performance: Redraws only when chart data changes and skips calculations for hidden/collapsed sections.

6. Operational Limitations & Best Practices

  1. Low Volatility / Asian Session Consolidation:
    • During tight, sideways ranges, lower timeframes ( M5 , M15 ) can trigger temporary Grade B impulse flips on tiny 3-pip moves.
    • Best Practice: Use higher timeframes ( H1 , H4 , D1 ) as trend anchors and lower timeframes for execution timing.
  2. Uncached History on Attachment:
    • On initial attachment to a new MT4 terminal, secondary timeframes may take 1-2 seconds to fetch historical bar data from the broker server.
    • Best Practice: Allow the dashboard 1-2 ticks or switch chart timeframes once to ensure all multi-timeframe buffers are populated.
  3. Major Economic News Events:
    • During high-impact news releases (NFP, CPI, Rate Decisions), spread widening and sudden two-way spikes can cause rapid alignment flips.
    • Best Practice: Avoid entering new positions during high-impact news releases even if Grade A alignment flashes temporarily.

Note on Utility & Indicator Intent: The GT Direction Dashboard is an analytical software tool designed solely to quantify, organize, and visually display multi-timeframe price metrics, statistical momentum, and currency basket dynamics on MetaTrader 4 charts. It provides automated data calculation to support disciplined, efficient chart analysis and structured decision-making. All signals, alignment grades, and directional indicators reflect direct mathematical metrics derived from chart price history.
推荐产品
Mini FFMV Dashboard
Opengates Success International
MINI FFMV Dashboard MINI FFMV Dashboard is a MINIATURE custom indicator of FULL FOREX MARKET-VIEW DASHBOARD created to give the Traders a full view of what is going on in the market. It uses a real time data to access the market and display every bit of information needed to make a successful trading. It shows as many as 30 currency pairs or as allowed to display in the Market Watch of your MT4 USAGE: For Solo Trading For Basket Trading (See the screenshot on how) COMPONENTS: Trend: Overall tren
Sniper Trend Fusion
Ilham Hijrah Saputra
5 (1)
Sniper Trend Fusion This indicator is a powerful all-in-one trading tool designed to simplify chart analysis and improve decision-making. It combines multiple proven techniques into a single system, helping traders identify trend direction, volatility, key price levels, and market structure without clutter. Instead of switching between multiple indicators, everything you need is integrated into one smooth and efficient interface. Key Advantages All-in-One System Combines trend, volatility, sup
FREE
Infinity Trend Pro
Yaroslav Varankin
1 (1)
This is a trend indicator without redrawing Developed instead of the binary options strategy (by the color of the Martingale candlestick) Also works well in forex trading When to open trades (binary options) A signal will appear in the place with a candle signaling the current candle It is recommended to open a deal for one candle of the current timeframe M1 and M5 When a blue dot appears, open a deal up When a red dot appears, open a trade down. How to open trades on Forex. When a signal is rec
Introduction It is common practice for professional trades to hide their stop loss / take profit from their brokers. Either from keeping their strategy to the themselves or from the fear that their broker works against them. Using this indicator, the stop loss / take profit points will be drawn on the product chart using the bid price. So, you can see exactly when the price is hit and close it manually.  Usage Once attached to the chart, the indicator scans the open orders to attach lines for t

HMA Trend Professional MT4
Pavel Zamoshnikov
4.57 (7)
Improved version of the free HMA Trend indicator (for MetaTrader 4) with statistical analysis. HMA Trend is a trend indicator based on the Hull Moving Average (HMA) with two periods. HMA with a slow period identifies the trend, while HMA with a fast period determines the short-term movements and signals in the trend direction. The main differences from the free version: Ability to predict the probability of a trend reversal using analysis of history data. Plotting statistical charts for analyzi
Noize Absorption Index MT4
Ekaterina Saltykova
5 (1)
Noize Absorption Index - is the manual trading system that measures the difference of pressure between bears forces and bulls forces. Green line - is a noize free index that showing curent situation. Zero value of index shows totally choppy/flat market.Values above zero level shows how powerfull bullish wave is and values below zero measures bearish forces.Up arrow appears on bearish market when it's ready to reverse, dn arrow appears on weak bullish market, as a result of reverse expectation. S
PABT Pattern Indicator - it's classical system one of the signal patterns. Indicator logic - the Hi & Lo of the bar is fully within the range of the preceding bar, look to trade them as pullback in trend. In the way if indicator found PABT pattern it's drawing two lines and arrow what showing trend way.  - First line - it's entry point and drawing at: 1. On the high of signal bar or on middle of the signal bar (depending from indicator mode) for buy; 2. On the low of signal bar or on middle of t
SRP Pro
Farhad Kia
5 (1)
Strong Retracement Points Pro edition! SRP (Strong Retracement/Reversal Points) is a powerful and unique support and resistance indicator. It displays the closest important levels which we expect the price retracement/reversal! If all level are broken from one side, it recalculates and draws new support and resistance levels, so the levels might be valid for several days depending on the market! If you are still hesitating to start using this wonderful tool, you can check this link to see how ef
CyberZingFx Trend Reversal
Afsal Meerankutty
4.18 (17)
NEW YEAR SPECIAL DISCOUNT RUNNING NOW 40% DISCOUNT Price slashed from $149 to $89 until 3rd Jan 2025 Indicator captures the trend reversals with no-repaint Buy and Sell Arrow signals. CyberZingFx Trend Reversal Indicator - your go-to solution for accurate and reliable trend reversal signals. With its  advanced trading strategy , the indicator offers you Buy and Sell Arrow signals that do not repaint, making it a reliable tool for catching Swing Highs and Swing Lows in any market and any time fr
Wave Wolf MT4
Andrei Salanevich
Wave Wold MT4外汇指标旨在搜索狼波并将其显示在交易终端的当前窗口中。 对于在交易中使用狼波的交易者来说,这是一个很好的指标。 它在交易策略中的应用将显着提高其效率和盈利能力。 有关指标的信息 与其他Wolf wave指标不同,Wave Wold MT4外汇指标具有许多显着提高其有效性的功能: 第一个是打开的Windows5point参数(真值)提供信息支持,即扩展了狼波出现在其上的图表的窗口。 例如,如果EURUSD、AUDUSD和GBPUSD图表是开放的,并且每个图表都安装了Wave WOLD MT4指标,那么如果检测到欧元模型,相应的图表将自动被带到其他图表的顶部,这在交易大量工具时变得非常方便。  第二个功能是MACD上的内置发散分析,用户可以自己选择参数(默认设置(12,26,9))。 顺便说一下,通常振荡器的值不显示在工作窗口上,只反映在形成点(5)时的价格标签的颜色上,特别是,如果标签的颜色是蓝色,则没有发散,如果颜色是红 如何使用指标 Wave WOLD MT4指标显示第4个形成点的假设Wolf模型和第5个点的形成区域(所谓的甜区,以黄色显示)。 如
Daily FIBO Pro
Mark Thimoty Evangelista
使用 BERG Daily FIBO Pro 释放您的交易潜力 BERG Daily FIBO Pro   是专为 MetaTrader 4 (MT4) 平台设计的强大且可定制的斐波那契回撤指标。无论您是经验丰富的交易者,还是刚刚起步,这个指标都是您识别关键支撑位和阻力位、提升市场分析并优化交易策略的理想工具。 为什么选择 BERG Daily FIBO Pro?   斐波那契分析的精确性:   借助基于前一天高点和低点自动计算的斐波那契回撤水平,在市场上获得优势。 BERG Daily FIBO Pro   绘制了各个水平(0%、23.6%、38.2%、50%、61.8%、78.6%、100%),帮助您轻松识别潜在的市场转折点。   智能报警系统:   使用可定制的警报系统,确保您不会错过任何机会,当价格触及任何斐波那契水平时,系统将通知您。您可以选择视觉弹出警报或声音信号,随时掌握您的交易动态。   完全可定制的视觉效果:   根据您的交易风格调整指标的外观。调整颜色、线条样式、标签文字、字体大小和位置,创建既信息丰富又赏心悦目的图表。   动态更新:  
The Th3Eng PipFinite indicator is based on a very excellent analysis of the right trend direction with perfect custom algorithms. It show the true direction and the best point to start trading. With StopLoss point and Three Take Profit points. Also it show the right pivot of the price and small points to order to replace the dynamic support and resistance channel, Which surrounds the price. And Finally it draws a very helpful Box on the left side on the chart includes (take profits and Stop loss
Portfolio X Ray Pro
Alexandru Craciun
Portfolio X-Ray Pro: Stop Trading Blind. See Your True Risk. Do you know exactly how much exposure you have on USD right now? Or Gold? If you have 10 different trades open, calculating your total risk per symbol is a nightmare. A mental mistake here can blow an account. Portfolio X-Ray Pro solves this instantly. It aggregates every single open order, sorts them by volume, and presents your true net exposure in a stunning, professional dashboard that now collapses into a sleek, minimalist arro
DayTradeKing
Thomas Bradley Butler
This indicator is good for small time frames like 1 and 5 minutes and made for day trading. The indicator never repaints or recalculates. The indicator works is for trading swing points in day trading, following bulls or bears.  Its a simple to use, non cluttered indicator with a high success rate.  This indicator works well to capture ranges.  All indicators come with limitations and no indicator or system is always accurate. Use money management for long term trading success.   Place in backte
TWO PAIRS SQUARE HEDGE METER INDICATOR Try this brilliant 2 pairs square indicator It draws a square wave of the relation between your two inputs symbols when square wave indicates -1 then it is very great opportunity to SELL pair1 and BUY Pair2 when square wave indicates +1 then it is very great opportunity to BUY pair1 and SELL Pair2 the inputs are : 2 pairs of symbols         then index value : i use 20 for M30 charts ( you can try other values : 40/50 for M15 , : 30 for M30 , : 10 for H1 ,
AdvCopyTraders
Chukwudi Joshua Obiekwe
AdvCopyTraders PRO is a powerful and ultra-fast trade copier designed for traders who manage multiple MT4 accounts. It duplicates all trades from a Master account to one or more Slave accounts instantly — including entries, exits, modifications, SL/TP updates, and partial closes. Whether you're a signal provider, fund manager, or using multiple brokers, this copier guarantees perfect synchronization and zero execution delay on the same PC/VPS. Key Features Instant Copying (0–1ms) Lightning-f
Smart Reversal Oscillator Pro
Atventius Bayu Riswanto
## Smart Reversal Oscillator Pro Smart Reversal Oscillator Pro is an advanced hybrid trading utility designed for MetaTrader 4 that reinvents volatility and momentum analysis. Instead of analyzing raw price action, this indicator applies mathematical Bollinger Bands directly onto the Relative Strength Index (RSI) array data within a separate sub-window. Standard fixed oversold and overbought levels (like 30 and 70) often fail during strong market expansions. This professional oscillator solve
Trade with Gann on your side!! MASTER CIRCLE 360 CIRCLE CHART, originally created by Gann admitted that this is “The Mother of all charts”. It is one of the last studies that this great trader left for us. The numeric tab le is apparently quite simple like all the tables and is based on square numbers, the SQUARE OF 12 and is by evolution, one of the most important square numbers. Here we can find CYCLE, PRICE AND TIME thanks to angles and grades, to show past and future support and resistance.
Master Volume profile
Israr Hussain Shah
Money Flow Profile MT5 HERE   Here   our more valuable tools SMC Trend Trading   ,  Easy SMC Trading  ,  Institutional SMC Architect Volume Analysis Tools  ,  Volume flow Profile  ,  Market volume profile  , FVG with Volume  , Liquidity Heatmap Profile  ,  Volume Spread Analysis This Master Edition is engineered for clarity and speed, featuring a unique Auto-Theme Sync system that instantly beautifies your chart layout upon loading. Key Features: True Money Flow Calculation: Goes beyond stand
这是一个预测蜡烛收盘价的指标。 该指标主要用于 D1 图表。 该指标适用于传统外汇交易和二元期权交易。 该指标可以用作独立的交易系统,也可以作为您现有交易系统的补充。 该指标分析当前蜡烛,计算蜡烛本身内部的某些强度因素,以及前一根蜡烛的参数。 因此,该指标预测市场走势的进一步方向和当前蜡烛的收盘价。 由于这种方法,该指标既适用于短期盘中交易,也适用于中长期交易。 该指标允许您设置指标在分析市场情况期间将产生的潜在信号的数量。 在指标设置中有一个特殊的参数。 此外,该指标可以通过图表上的消息、电子邮件以及推送通知的形式通知新信号。感谢您的关注!交易愉快! 购买后一定要写信给我! 我会给你我的交易指标的建议! 还可以获得奖金!
Riko Trend
Nadiya Mirosh
The Riko Trend indicator is a revolutionary trend trading and filtering solution with all the important features of a trend tool built into one tool! The Riko Trend indicator is good for any trader, suitable for any trader for both forex and binary options. You don’t need to configure anything, everything is perfected by time and experience, it works great during a flat and in a trend. The Riko Trend indicator is a technical analysis tool for financial markets that reflects the current price f
For sure, this indicator has become very popular amongst traders. Through coding this indicator will give you the most accurate levels possible for your trading analysis. We have also added in the ability for you to receive alerts when the price breaks above or below a Support or Resistance lines! HOW TO USE The red rectangles represent your resistance/supply zone. The green rectangles represent your support/demand zone.  BONUS FEATURES We coded this indicator with the ability to switch between
Daily Open Mirror Engine — Wick & Body Mirror Levels for MT4 Daily Open Mirror Engine   is a professional MetaTrader 4 indicator designed to project mirrored price levels from the current daily open. Many intraday moves react strongly around the daily open. This indicator uses the daily open as the central reference point and automatically projects mirrored levels from important wick and body extremes, helping traders identify possible reaction zones, liquidity targets, support, resistance, an
AW Heiken Ashi
AW Trading Software Limited
AW Heiken Ashi — 智能趋势和止盈位指标。这款高级指标基于经典 Heiken Ashi 打造,专为交易者打造,灵活性更高、更清晰易懂。与标准指标不同, AW Heiken Ashi 有助于分析趋势、确定盈利目标并过滤虚假信号,从而提供更自信的交易决策。 设置指南和说明 - 此处 / MT5 版本 - 此处 AW Heiken Ashi 的优势: 适用于任何资产和时间范围, 高度适应交易者的风格, 动态计算进入和退出水平, 用户友好的界面+终端的最小负载, 适合用作成熟的交易策略。 可能性: 1) 高级趋势可视化:根据当前趋势方向创建彩色Heiken Ashi蜡烛 - 对市场情况进行方便且直观的解读。 2) 灵活的获利水平(TP1 和 TP2):视觉目标直接记录在图表上,并能够针对每个目标进行微调。 3) 可按蜡烛数量自定义过滤器:让您避免虚假信号和市场噪音。交易者控制在哪个K线图上显示信号,以及确认趋势的程度。 4) 抗锯齿选择(4种方法):应用不同的平滑类型和周期来根据您的策略和市场定制指标。 5) 永不重绘:信号在蜡烛结束时形成并保持稳定,这对于算法和手动交易尤其重要
All in One Trade
Alexey Minkov
4.52 (29)
All-in-One Trade Indicator (AOTI) 可自动计算 14 个货币对的每日目标价位,并在一个窗口中整合适用于各类交易品种的技术分析工具,包括用于识别趋势的 Double Channel、Price Channel、MA Bands、Climax Bars 检测器、斐波那契水平、支撑和阻力微观水平,以及箭头反转信号。适用于 MetaTrader 4 平台。 每日价位计算适用于 EURUSD、EURJPY、GBPUSD、USDCHF、EURGBP、EURCAD、EURAUD、AUDJPY、GBPAUD、GBPCAD、GBPCHF、GBPJPY、AUDUSD 和 USDJPY。所有其他模块均可用于任何交易品种。 购买后,请直接联系我以获取免费的 AOTI-EA-Assistant。这是一款辅助型 Expert Advisor(EA),可根据 AOTI 每日价位并按照 Simplest Level Strategy 自动开仓和管理已开仓头寸。该 Assistant 仅适用于指标可计算每日价位的货币对。 有关安装、GMT Offset 设置、加载所需历史数据以及使用指标
AW Supply Demand MT4
AW Trading Software Limited
AW Supply Demand 按经典方式寻找供给区与需求区:由若干根小K线组成的基底,以及价格随后从基底的强力离开。每个区域获得 0 到 10 的公开评分,由六个具名分项构成,并经历从新鲜到被击穿再到反转的生命周期,面板则按区域组装出带有入场、止损和目标价位的完整交易方案。指标在一张图表上显示最多三个更高周期的区域,发送通知,并把全部数据输出到缓冲区供智能交易系统使用。 区域不重绘。区域在基底之后经过设定数量的已收盘K线出现,确认之后其边界不再变化,此后只有状态、评分和触碰计数发生变化。 使用手册与说明 -> 这里 / MT5 版本 -> 这里 如何用该指标交易: 步骤 1 - 选择区域 面板显示值得交易的那个区域的交易方案,以及按其评分给出的结论。Limit order - 评分 9 及以上,从区域的近端边界挂限价单。Confirm entry - 评分 8 到 9,按区域处的反转K线入场。Skip - 评分低于 8,跳过该区域。 步骤 2 - 确定 StopLoss 止损设在区域的远端边界之外,并留出以 ATR 的分数表示的缓冲,缓冲由 Stop loss buffer bey
Heiken Ashi Smoothed Strategy is a very simple but powerful system to get forex market trend direction. This indicator is actually 2 indicators in 1 pack, Heiken Ashi and Heiken Ashi Smoothed Moving Average both included. Because HA (Heiken Ashi) and HAS (Heiken Ashi Smoothed) are calculated in the same one system event with necessary buffers and loop only, so it is the FAST, OPTIMIZED and EFFICIENT HA having the combined indicator of MetaTrader 4. You can choose to display HA and HAS in the sam
M W Pattern Pro
Noiros Tech
4.14 (7)
M & W Pattern Pro is an advanced scanner for M and W patters , it uses extra filters to ensure scanned patterns are profitable. The indicator can be used with all symbols and time frames. The indicator is a non repaint indicator with accurate statistics calculations. To use , simply scan the most profitable pair using the statistics dashboard accuracy , then enter trades on signal arrow and exit at the TP and SL levels. STATISTICS  Accuracy 1 : This is the percentage of the times price hits TP1
Fib Zone
Ezinne Judith Orji
A Chart Analytics Program and helps in asset analysis using the Fibonacci Complex.  The primary Fibonacci numbers used in trading are 61.8% and 38.2%. 8% is derived from dividing any number in the Fibonacci sequence by its previous one. F n / F n-1 2% is derived by squaring 61.8 and alternatively by dividing any number in the sequence by the number two places to its right. F n  /F n+2 The second tier of Fibonacci numbers used in trading is 23.6%, 76.4%, and 78.6%. 6% is derived from dividing an
Stepping Trend
Mpendulo Chiliza
The Stepping Trend Indicator     The Steppi ng Trend indicator uses the  average true range  (ATR indicator) in its calculation. This gives you control to set your own average true range period, I set the Default as 10.   Indicator Details. Green Arrow Up: This means you are at the starting point of a new bullish trend, it’s time to buy.   Red  Arrow  Down : This means you are at the starting point of a new  bearish  trend, it’ s time to sell .   What if you miss the Arrow Signal?   No prob
该产品的买家也购买
Trend SniperX MT4
Sarvarbek Abduvoxobov
5 (5)
Trend Sniper X 是一款用于 MetaTrader 5 的多周期趋势追踪指标,旨在帮助交易者清晰、精准地识别趋势方向及潜在的反转点。 适用于 MT5: https://www.mql5.com/en/market/product/181101 价格信息: 当前价格为促销价,随着后续更新和新功能的推出,价格可能会发生变动。 Code2Profit 频道 通过多周期分析掌控市场! 如何使用 Trend Sniper X 最大化胜率:关键规则与交易时段技巧 技术规格 交易平台 MetaTrader 5 指标类型 多周期趋势指标 运行时间周期 任意图表周期,支持独立选择更高周期(M1–MN1) 主要交易品种 外汇、黄金 (XAUUSD) 及其他 CFD 差价合约 推荐账户 任何账户类型 可视化呈现 彩色趋势 K 线(买入/卖出/弱势/转变)+ 买入/卖出信号箭头 附加模块 市场交易时段框(悉尼、东京、伦敦、纽约) 核心功能 多周期趋势分析: 将更高周期的趋势方向直接投影到当前图表上,提供清晰的宏观视角。 弱势/不确定 K 线检测: 高亮显示趋势状况不明确的 K 线,帮助交易者远离震
SR Liquidity
Oleg Rodin
5 (2)
SR Liquidity 是一款旨在揭示市场流动性高度集中且价格反应最剧烈的隐蔽区域的交易指标。这些特殊的流动性区域充当着强有力的支撑位与阻力位,为您清晰呈现市场最可能发生反转的位置。 SR Liquidity 指标并非简单地绘制常规的支撑/阻力线,而是通过分析实际的价格行为,识别买卖压力积聚的区域。这些区域实际上是推动市场真实波动的流动性池。通过在图表上直观呈现这些区域,该指标能助您在价格反应发生前预判走势——这意味着它实际上能够预测价格方向可能发生的变化。它将原始的价格行为转化为清晰且具实操价值的市场蓝图,标示出那些可能成为市场转折点的关键价位。 该指标适用于任何交易品种和时间周期——包括外汇、指数、金属、加密货币等。支持任意时间周期。 购买后请联系我,以获取交易指南及免费赠送的优质附加指标!
Neuro Poseidon MT4
Daria Rezueva
4.74 (46)
Neuro Poseidon is a new indicator by Daria Rezueva. It combines precise trading signals with adaptive TP/SL levels - creating best possible trades as a result! Message me and get  Neuro Poseidon Assistant  as a gift to automize your trading process! What makes it stand out? 1. Proven profitability on all assets and timeframes 2. Only confirmed BUY and SELL signals present on the chart 3. Adaptive TP & SL levels generated by the software for each trade 4. Easy to understand - suitable for all
GoldRush Trend Arrow Signal
Kirk Lee Holloway
5 (2)
GoldRush 趨勢箭頭信號 GoldRush 趨勢箭頭信號 指標為 XAU/USD 中的高速、短期短線交易者提供精確、實時的趨勢分析。 專為1分鐘時間框架設計,此工具顯示方向箭頭以明確顯示入場點,使短線交易者能在波動市場中自信操作。 該指標包含主要和次要警示箭頭。主要信號為白色和黑色方向箭頭,用於指示趨勢方向的轉變;次要信號為藍色和紅色箭頭,用於確認主要箭頭指示的方向並提示潛在交易入場點。 注意:當趨勢方向發生變化後僅出現一個主要警報箭頭時,請注意可能會出現多個次要藍/紅箭頭。次要信號將在滿足信號標準的任何蠟燭圖後出現,因此在長期趨勢移動中,螢幕上將顯示大量次要箭頭(如附帶的截圖所示)。您可在設置中開啟或關閉任一箭頭類型。 以下是我使用此指標進行交易的方式: - 對於買入入場,我會耐心等待白箭頭在蠟燭收盤時出現,並在下一根可用蠟燭收盤時出現藍箭頭時進行買入交易。 - 對於賣出入場,我會耐心等待黑箭頭在蠟燭收盤時出現,並在下一根可用蠟燭收盤時出現紅箭頭時進行賣出交易。 - 獲利了結/止損設置由使用者自行負責,但我個人使用最低R:R為1:2,並發現這在倫敦/紐約開盤等
Miraculous Indicator Binary & Forex v3 StrategySafe Miraculous Indicator Binary & Forex v3 StrategySafe 是一款专业交易指标,适合希望获得清晰信号、强大确认工具以及结构化交易方式的 Binary 和 Forex 交易者。 v3 版本加入了 MIR Dashboard、Miraculous Confirmation Dashboard、GANN Law、Square of 9 水平线、GANN 角度以及更强的 Forex 分析模式。 核心功能 同时支持 Binary 和 Forex 交易模式。 MIR Dashboard 可快速读取市场状态。 Miraculous Confirmation Dashboard 用于确认交易机会。 GANN Law drawing lines 用于 Forex 市场结构分析。 Square of 9 线条、方向和关键价格水平。 1x1 GANN Angle 用于判断趋势压力。 Entry Information TP 帮助寻找合理止盈区域。 Strateg
PRO Renko System
Oleg Rodin
5 (31)
PRO Renko Arrow Based System for trading renko charts.  准确的信号交易任何外汇工具. 另外,我将免费提供系统的附加模块! PRO Renko系统是RENKO图表上高度准确的交易系统。该系统是通用的。 该交易系统可应用于各种交易工具。 该系统有效地中和了所谓的市场噪音,打开了获得准确反转信号的通道。 该指标易于使用,只有一个参数负责产生信号。 您可以很容易地使算法适应您感兴趣的交易工具和renko酒吧的大小。 我很乐意通过提供任何咨询支持来帮助所有客户有效地使用该指标。 祝您交易成功!购买后,立即写信给我! 我将与您分享我的建议和我的renko发电机。 另外,我将免费提供系统的附加模块!
Currency Strength Wizard
Oleg Rodin
4.85 (61)
货币强度向导是一个非常强大的指标,为您提供成功交易的一体化解决方案。该指标使用多个时间范围内所有货币的数据来计算这个或那个外汇对的力量。此数据以易于使用的货币指数和货币电力线的形式表示,您可以使用它们来查看这种或那种货币的力量。 您所需要的只是将指标附加到您要交易的图表上,该指标将向您显示您交易的货币的真实强度。该指标还向您显示买卖量压力的极值,您可以在顺势交易时利用这些压力。该指标还显示了基于斐波那契的可能目标。该指标可用于各种交易时间范围。该指标支持各种货币对的交易。 该指标为您提供所有类型的警报,包括推送通知。 购买后请联系我。我将与您分享我的交易技巧,并免费为您提供丰厚的红利指标! 祝您交易愉快,获利丰厚!
M1 Sniper
Oleg Rodin
4.97 (30)
M1 SNIPER 是一款易于使用的交易指标系统。它是一个专为 M1 时间框架设计的箭头指标。该指标可以作为独立的系统在 M1 时间框架下进行剥头皮交易,也可以作为您现有交易系统的一部分使用。虽然该交易系统专为 M1 时间框架交易而设计,但它也可以用于其他时间框架。我最初设计此方法是为了交易 XAUUSD 和 BTCUSD。但我发现这种方法在其他市场交易中也同样有用。 指标信号既可以顺势交易,也可以逆势交易。我教授一种特殊的交易技巧,帮助您利用指标信号进行双向交易。该方法基于使用特殊的动态支撑位和阻力位区域。 购买后,您可以立即下载 M1 SNIPER 箭头指标。此外,我还为所有 M1 SNIPER 工具用户免费提供下方屏幕截图所示的 Apollo Dynamic SR 指标!这两个指标的组合可以帮助您更轻松、更准确地利用 M1 时间框架进行交易。 购买后请联系我,免费获取交易提示和奖励指标! 祝您交易成功!
Elliott Wave Trend MT4
Young Ho Seo
4 (7)
Elliott Wave Trend was designed for the scientific wave counting. This tool focuses to get rid of the vagueness of the classic Elliott Wave Counting using the guideline from the template and pattern approach. In doing so, firstly Elliott Wave Trend offers the template for your wave counting. Secondly, it offers Wave Structural Score to assist to identify accurate wave formation. It offers both impulse wave Structural Score and corrective wave Structure Score. Structural Score is the rating to sh
Gann Made Easy
Oleg Rodin
4.84 (172)
Gann Made Easy 是一个专业且易于使用的外汇交易系统,它基于使用先生理论的最佳交易原则。 W.D.江恩。该指标提供准确的买入和卖出信号,包括止损和获利水平。您甚至可以使用推送通知在旅途中进行交易。 购买后请联系我,即可免费获得交易指导和超棒的额外指标! 您可能已经多次听说过江恩交易方法。通常 Gann 的理论不仅对于新手交易者而且对于那些已经有一定交易经验的人来说都是非常复杂的东西。这是因为江恩的交易方法在理论上并不那么容易应用。我花了几年时间来完善这些知识,并将最好的原则应用到我的外汇指标中。 该指标非常易于应用。您所需要的只是将其附加到您的图表并遵循简单的交易建议。该指标不断进行市场分析工作并寻找交易机会。当它检测到一个好的入口点时,它会为您提供一个箭头信号。该指标还显示止损和获利水平。 换句话说,当您像先生一样进行交易时,该指标会为您提供最佳江恩建议。江恩亲自告诉你此时此刻该做什么。但最好的部分是您不需要了解任何有关江恩交易原则的知识,因为该指标会为您完成整个市场分析工作。
Supply and Demand Dashboard PRO
Bernhard Schweigert
4.81 (21)
目前八折优惠! 这个仪表板是一个非常强大的软件,可用于多个符号和多达9个时间段。 它是基于我们的主要指标(最佳评论:高级供应需求)。 Advanced Supply Demand 该仪表板提供了一个伟大的概述。它显示。   筛选后的供需值,包括区域强度评级。 区间内和区间外的点位距离。 它突出了嵌套的区域。 在所有(9个)时间段内,它对所选符号发出4种警报。 它是高度可配置的,以满足您的个人需求! 您的利益! 对每个交易者来说,最重要的问题是。 什么是入市的最佳水平? 在强大的供应/需求区域内或附近进入你的交易,以获得最佳的成功机会和风险/回报。 我的止损的最佳位置是哪里? 把你的止损放在强势供应/需求区的下方/上方是最安全的。 我的最佳盈利目标是什么? 你的退出策略和你的进入策略一样重要,了解更高的时间框架图可以帮助你。对于买入,使用下一个供应区作为目标,对于卖出,使用下一个需求区作为目标。在回撤到供应区或需求区时进场,以确保有足够的利润空间,达到更高的时间框架的供应和需求,将增加你的利润。 为什么我们要过滤强区和弱区? 不平衡性越大,价格的变动就
Quantum Naked SMC Prime is a streamlined Smart Money Concepts indicator designed for traders who prefer a clean chart, structured market analysis and clear visual trade setups without unnecessary complexity. The indicator combines market structure, liquidity behavior, institutional zones and confirmation logic into a compact analytical framework. Instead of flooding the chart with technical indicators, Quantum Naked SMC Prime focuses on the core elements of price action and Smart Money Concepts
Quantum Trend Sniper MT4
Ian Andrew Nicholson
5 (1)
Quantum Trend Sniper PRO for MetaTrader 4 Quantum Trend Sniper PRO is a professional-grade MT4 indicator built for traders who want selective entries, clear trade structure, and live on-chart decision support . This is not a basic buy/sell arrow tool. It is a complete trading workflow that helps you identify higher-quality setups, project the full trade structure, monitor progression through multiple profit targets, and review trade behavior directly on the chart. Designed for traders who value
Scalper Inside PRO
Alexey Minkov
4.74 (69)
Scalper Inside PRO 帮你分析日内趋势,在入场前就把交易规划好。核心是三套专属策略,让你更精准地读懂市场。信号一出现,指标就自动判断行情方向并计算关键价位,你能提前看到潜在入场点、预期的止损以及多个止盈位。详尽的绩效统计会展示不同品种和策略在历史上的表现,帮你根据当前行情挑选合适的资产。它既可以作为独立的剥头皮工具,也可以融入你的系统,或者作为你自己 EA 的基础。运行于 MetaTrader 4 平台。 指标会直接在图表上标出入场、三个止盈位 - TP1、TP2、TP3 以及一个可选止损。你甚至可以接入自己的箭头指标,检验它们的统计数据和盈利能力。 购买后请直接联系我,即可获得指标的专属附赠 add-ons、更多关于实盘运用的说明,以及把它正确接入你自己交易系统和 EA 的帮助。 指标主要功能 内置三套专属交易策略,可即时切换。 箭头信号出现后即时计算价位:入场以及 TP1、TP2、TP3 多级目标立刻显示,方便你提前规划交易。开启手动或自动计算后,会显示止损位。 三套策略均内置优化模块:自动把参数适配到当前品种和周期,帮你快速筛选资产(仅在实时状态下可用)。 HTF
JSL Orderflow Footprint turns every candle into a price ladder that shows how much volume traded on the bid and on the ask at each price level. It highlights diagonal imbalances, stacked imbalance zones, absorption at candle extremes, cumulative delta (CVD), delta divergence and the daily session volume profile, then combines five of these order-flow conditions into a 0–100 confluence score. A signal is only issued on bar close when the score is high, clearly one-sided and confirmed by the candl
PTS Precision Index Oscillator V2
PrecisionTradingSystems
5 (1)
精密指数振荡器(Pi-Osc)由Precision Trading Systems的Roger Medcalf开发 版本2经过精心重新编码,以在您的图表上加载速度非常快,还加入了一些其他技术改进,以提高体验。 Pi-Osc旨在提供准确的交易定时信号,旨在找到极端的耗尽点,这些点是市场被迫去触及,以清理每个人的止损单。 该产品解决了一个古老的问题,即知道极端点在哪里,这使得交易员的生活变得更加简单。 这是一个高度复杂的共识指标,与行业标准的振荡器相比,具有一些强大的区别。 它使用的一些特征包括需求指数、资金流动、RSI、随机指标、模式识别、成交量分析、标准偏差极端点以及不同长度上述各种变化的分歧。 乍一看,对于未经培训的人来说,它似乎与任何其他振荡器没有什么不同,但当与其他振荡器(如RSI或动量等)相对比时,这个指标的真正威力开始显现。 据我所知,没有其他振荡器可以频繁地精确指出顶部和底部,具有相同的定期效率。 精密指数振荡器由许多不同的数学方程组成,用于测量多个时间框架采样中的价格和成交量变动,从而高度准确地预测趋势可能发生转折的位置。 PTS Pi-Osc V2非
KURAMA GOLD SIGNAL PRO(MT4)— 7层过滤 · 自动止盈止损 · 质量评分 · 信号历史保存 | 完整的XAUUSD交易系统 实时不重绘。信号出现的瞬间,箭头、入场、止盈、止损当场锁定,之后绝不移动。你交易的就是这个实时信号。而且在v7.20中,每一个真正发出的信号都会自动保存,并在重启后精确还原。 购买者专属赠品 购买永久授权,即可免费获得 AI Zone Radar(价值$59)+ 完整PDF手册。在产品价格之外,额外附赠价值$59的赠品。购买后在MQL5上给我留言即可。 AI Zone Radar: https://www.mql5.com/en/market/product/175834 在黄金交易者社区中被实际使用,因精度与易用性而广受好评。 你的难题 —— 以及解决方案 黄金一天波动$30–$50。你知道机会就在那里。但这些情况是否似曾相识: - 入场太早,价格逆行$10后才朝你的方
本指标是实践实战交易完善的波浪自动分析的指标 !  案例... 注: 波浪分级用西方叫法不习惯,因受到缠论(缠中说禅)命名方式习惯的影响,我是将基础波浪命名为 笔 ,将二级波段命名为 段 ,同时具有趋势方向的段命名为 主趋段 (以后笔记中都是这种命名方式,先告知大家),但是算法上和缠论关系不大切勿混淆.反映的是本人分析盘面总结的 千变万化纷繁复杂的运行规律 . 对波段进行了标准化定义,不再是不同人不同的浪  ,    对人为干扰的画法进行了排除,在严格分析进场起到了关键的作用 . 使用这个指标,等于将交易界面提升美感,抛弃最原始的K线交易带你进入新的交易层次.如果不是为了交易,在宣传上也将使客户观感提升层次. 指标内容: 1. 基础波浪 (笔) : 首先我们找出了价格波动过程中的基础波动拐点,当然他的有序性低,为下一步的计算提供基础. 2. 二级波段( 段 ) :在基础波浪的基础上,通过算法分析得到层级更明显的二级波段,二级波段为波浪提供了分析基础 3. 波浪( 浪 ): 有着更清晰的趋势,更清晰直观的方向.分析一个波浪是否延续,需要看二级波段的形态,分析二级的构成,可以得出波浪
Scalper Vault
Oleg Rodin
5 (39)
Scalper Vault 是一个专业的剥头皮系统,为您提供成功剥头皮所需的一切。该指标是一个完整的交易系统,可供外汇和二元期权交易者使用。推荐的时间范围是 M5。 该系统为您提供趋势方向的准确箭头信号。它还为您提供顶部和底部信号以及江恩市场水平。无论您拥有何种交易经验,该系统都易于使用。您只需要遵循简单的规则并每天重复该过程。 建议将此系统用于主要货币对。感谢您的关注! 请注意,该指标在策略测试器中可能无法正常工作。因此,我建议仅在模拟或真实账户的真实交易条件下使用该系统。 指示器提供所有类型的警报,包括推送通知。 购买指标后请与我联系。我将免费与您分享我的个人交易建议和出色的奖励指标! 祝您交易愉快,盈利!
Cycle Sniper
Elmira Memish
4.39 (36)
Please contact us after your purchase and we will send you the complimentary indicators to complete the system Cycle Sniper is not a holy grail but when you use it in a system which is explained in the videos, you will feel the difference. If you are not willing to focus on the charts designed with Cycle Sniper and other free tools we provide, we recommend not buying this indicator. We recommend watching the videos about the indiactor and system before purchasing. Videos, settings  and descri
PZ Divergence Trading
PZ TRADING SLU
5 (2)
棘手的发现和频率稀缺是最可靠的交易方案之一。该指标使用您喜欢的振荡器自动查找并扫描常规和隐藏的发散。 [ 安装指南 | 更新指南 | 故障排除 | 常见问题 | 所有产品 ] 容易交易 发现常规和隐藏的分歧 支持许多知名的振荡器 根据突破实现交易信号 显示适当的止损和获利水平 可配置的振荡器参数 可自定义的颜色和尺寸 按条形过滤大小差异 实现绩效统计 它实现了电子邮件/声音/视觉警报 为了提供广阔的市场前景,可以使用不同的振荡器在同一张图表中多次加载该指标,而不会产生干扰。该指标支持以下振荡器: RSI CCI MACD OSMA 随机 动量 很棒的振荡器 加速器振荡器 威廉姆斯百分比范围 相对活力指数 由于差异可能会扩大很多,尤其是在外汇市场中,因此该指标产生了转折:它在等待交易突破之前等待donchian突破确认差异。最终结果是带有非常可靠的交易信号的重新粉刷指示器。 输入参数 幅度:用于寻找差异的之字形周期 振荡器-选择要加载到图表的振荡器。 突破期-交易信号的突破期,以柱为单位。 发散类型-启用或禁用发散类型:隐藏,常规或两者。 最小散度单位为条形-最小散度单位为条形
Entry Points Pro
Yury Orlov
4.59 (175)
这是一款 MT4 的趋势指标,可提供准确的入场交易信号,且无重绘或延迟。 它可应用在任何金融资产:外汇、加密货币、贵金属、股票、指数。 最好的结果出现在 M15+ 的时间帧内。 指标的 MT5 版本 重要! 购买后请联系我,以便获取详细指南和奖励。 视频 (6:22) - 一个信号赢取的利润等于指标价格的三倍。 视频 (4:44) - 它如何在测试器中工作,我的提示和技巧。 视频 (1:44) - 有关它如何处理加密货币和指数的几句话。 大多数交易者在 Entry Points Pro 指标的帮助下,在第一个交易周内就改善了他们的交易结果。 Entry Points Pro 指标的益处 入场信号无重绘或延迟 如果信号出现,并得到确认(如果信号所在烛条已收盘),则它不会再消失;不像是重绘指标,它会导致重大的财产损失,因为它们可以在显示信号后再将其删除。 无差错开仓 指标算法可令您找到入场交易(买入或卖出资产)的理想时机,从而提高每位交易者的成功率。 Entry Points Pro 可操作任何资产 它允许您在 MT4 平台上交易任何经纪商提供的加密货币、股票、金属、指数、商品
PZ Swing Trading
PZ TRADING SLU
5 (4)
Swing Trading 是第一个旨在检测趋势方向的波动和可能的反转波动的指标。它使用在交易文献中广泛描述的基准摆动交易方法。该指标研究多个价格和时间向量,以追踪总体趋势方向,并检测市场超卖或超买并准备好进行修正的情况。 [ 安装指南 | 更新指南 | 故障排除 | 常见问题 | 所有产品 ] 市场波动的利润不会被窃取 指示器始终显示趋势方向 彩色价格带代表机会基准 彩色虚线表示可能的反转波动 该指标分析其自身的质量和性能 它实现了一个多时间仪表板 可定制的趋势和波动周期 它实现了电子邮件/声音/推送警报 指示器为非重涂或重涂 什么是摇摆交易 摇摆交易是一种尝试在一天到一周内从证券中获得收益的交易方式,尽管某些交易最终可以保持更长的寿命。摇摆交易者使用技术分析来买入弱点和卖出力量,并有耐心等待这些机会的发生,因为在发生一波抛售浪潮之后购买证券而不是陷入抛售更有意义。 机会基准 关于历史数据的大量研究证明,适合于波动交易的市场倾向于在基线价格带上下交易,基线价格带由图表显示,使用平均真实区间计算得出。波动交易者使用基线,该策略是购买常态和卖出躁狂,或做空常态并掩盖沮丧。在没有疲
Introduction to Fractal Pattern Scanner Fractal Indicator refers to the technical indicator that makes use of the fractal geometry found in the financial market. Fractal Pattern Scanner is the advanced Fractal Indicator that brings the latest trading technology after the extensive research and development work in the fractal geometry in the financial market. The most important feature in Fractal Pattern Scanner is the ability to measure the turning point probability as well as the trend probabi
Dynamic Forex28 Navigator
Bernhard Schweigert
4.43 (7)
Dynamic Forex28 Navigator - 下一代外汇交易工具。 当前 49% 折扣。 Dynamic Forex28 Navigator 是我们长期流行的指标的演变,将三种功能合二为一: 高级货币强度 28 指标 (695 条评论)+ 高级货币 IMPULSE 带警报 (520 条评论)+ CS28 组合信号(奖励)。 有关指标的详细信息 https://www.mql5.com/en/blogs/post/758844 下一代强度指标提供什么? 您喜欢的原始指标的一切,现在通过新功能和更高的精度进行了增强。 主要特点: 专有货币强度公式。  所有时间范围内的平滑和准确的强度线。 非常适合识别趋势和精确进入。 动态市场斐波那契水平(市场斐波那契)。  此指标独有的独特功能。 斐波那契应用于货币强度,而不是价格图表。 适应实时市场活动以获得准确的反转区域。 实时市场动量。  第 9 行显示市场是活跃还是被动。 对于定时交易至关重要。 全面的警报和显示。  每种货币最强的买入和卖出动量。 ​​28 对的双重动量买入和卖出。 超买/超卖警告外部范围和止损。 反转
TPA True Price Action indicator reveals the true price action of the market makers through 100% non-repainting signals (except early signals mode) strictly at the close of a candle! TPA shows entries and re-entries, every time the bulls are definitely stronger than the bears and vice versa. Not to confuse with red/green candles. The shift of power gets confirmed at the earliest stage and is ONE exit strategy of several. There are available now two free parts of the TPA User Guide for our custom
True Signal FX 是一款适用于 MetaTrader 4 的多时间框架交易指标,旨在直接在图表上提供完整的交易分析方案。 该指标不仅提供单一的方向信号,还将市场分析、信号确认以及交易水平计算整合到同一个工作界面中。当检测到交易方案时,交易者可以同时看到交易方向、入场价格(Entry)、止损(Stop Loss)和止盈(Take Profit),以及当前信号评分和市场状态信息。 True Signal FX 适用于希望围绕明确交易方案进行决策的交易者,无需针对每一个潜在交易机会手动比较多个技术指标并单独计算交易水平。 True Signal FX 不会自动执行交易。指标负责提供分析结果和交易方案,最终是否开仓以及订单执行由交易者自行决定。 工作原理 True Signal FX 会在多个选定的时间框架上分析市场,并分别计算买入(BUY)和卖出(SELL)评分。 默认配置使用 M5、M15、M30、H1 和 H4,最多可以同时配置 5 个分析时间框架。 此外,指标使用独立的触发时间框架(Trigger Timeframe)来确定新的交易方案何时满足激活条件。默认触发时间框架为
Super Signal – Skyblade Edition 專業級無重繪 / 無延遲趨勢信號系統,擁有卓越勝率 | 適用於 MT4 / MT5 在較低的時間週期上效果最佳,例如 1 分鐘、5 分鐘與 15 分鐘圖表。 核心特色: Super Signal – Skyblade Edition 是一套專為趨勢交易設計的智能信號系統。 其採用多重濾波邏輯,僅篩選出具有明確方向性、動能強勁且波動結構健康的走勢進場點。 本系統 不預測高點或低點 ,只有在同時滿足以下三項條件時才會觸發交易信號: 趨勢方向明確 動能持續增強 波動率結構穩定 此外,系統還結合市場流動性分析,以進一步提升信號的準確性與觸發時機。 信號特性: 所有箭頭信號皆為 100% 無重繪,無延遲 信號一旦出現即固定於圖表,不會閃爍或消失 提供圖表箭頭、資訊面板、彈出通知、聲音提示及推播訊息 支援 EA 呼叫(Buffer 輸出),可整合至自動化交易或信號跟單系統 提供預設參數模板,免調整即可使用,適合新手快速上手 總結: Super Signal – Skyblade Edition 是一款邏輯清晰、穩定高效的專業趨勢型
目前八折优惠! 对任何新手或专家交易者来说都是最好的解决方案! 这个仪表板软件适用于28种货币对。它基于我们的两个主要指标(高级货币强度28和高级货币冲动)。它对整个外汇市场提供了一个伟大的概述。它显示高级货币强度值,货币运动速度和28个外汇对在所有(9)时间段的信号。想象一下,当你可以使用图表上的单一指标观察整个市场,以确定趋势和或剥头皮的机会时,你的交易将得到改善 我们已经在这个指标中建立了一些功能,使你更容易识别强势和弱势货币,同时识别和确认潜在的交易。该指标以图形方式显示货币的强势或弱势是增加还是减少,以及它在所有时间段的表现。 增加的新功能是动态市场斐波那契水平,它适应当前的市场条件变化,这是一个已经在我们的高级货币强度28和高级货币冲动指标中使用的成熟的加分项。 在交易时,总是将弱势货币和强势货币配对,这个新指标将帮助你做到这一点。 用户手册:点击这里  https://www.mql5.com/en/blogs/post/708783 特点  显示每个时间段的ACS28和GAP-speed(冲动)的货币强度值。 列:颜色代码以7种颜色显示货币强度:强势
BTMM State Engine Pro MT4
Garry James Goodchild
BTMM State Engine Pro by G-Labs — Beat The Market Maker indicator for MetaTrader 4. Asian session range, London and New York kill zones, level progression (L1/L2/L3), peak formation detection (PFH/PFL), entry signals, and a multi-pair scanner from one chart. Stop scanning charts one pair at a time. The State Engine tracks the BTMM daily cycle automatically — Asian box, room boundaries, level blocks, peak formations, and filtered entries — while the scanner dashboard shows level, peak status,
作者的更多信息
GT Mini Charts Panel MT5
Nnamdi Kennedy Ifeorah
GT MiniCharts Panel for MT5 — Ultimate Multi-Timeframe Precision at Your Fingertips!   Supercharge your technical analysis and market execution with the   GT MiniCharts Panel   — an ultra-slick, high-performance canvas tool built for traders who demand absolute clarity across every timeframe!      Why Traders Love It: Instant Multi-Timeframe Alignment : Track price action simultaneously from M1 to Monthly on a single clean, high-resolution canvas panel. Ultra-Smooth Drag & Drop : Drag th
FREE
GT Mini Charts Panel
Nnamdi Kennedy Ifeorah
GT MiniCharts Panel for MT4 — Ultimate Multi-Timeframe Precision at Your Fingertips!   Supercharge your technical analysis and market execution with the   GT MiniCharts Panel   — an ultra-slick, high-performance canvas tool built for traders who demand absolute clarity across every timeframe!      Why Traders Love It: Instant Multi-Timeframe Alignment : Track price action simultaneously from M1 to Monthly on a single clean, high-resolution canvas panel. Ultra-Smooth Drag & Drop : Drag th
FREE
FisherYur4ik by Yuri
Nnamdi Kennedy Ifeorah
Fisher Yur4ik Indicator is a momentum indicator originated by Yuri Prokiev (Russian). I combined the Fisher Test indicator with other indicators to sieve/filter signals. It is not used as a standalone indicator but in combination to filter out Price Action signals.  I have uploaded this indicator (Fisher test) for download alongside the 3Bar_Play signal indicator for signals to appear. It is free.
FREE
Th3 BarPlay Signals Mt4
Nnamdi Kennedy Ifeorah
这是一种基于价格行为的策略,称为 3Bar_Play,它基于 3Bar 烛台形态。在弹出买入/卖出信号箭头之前,添加了额外的指标用于过滤和确认。它可以在上升趋势、下降趋势或横向市场中交易。 添加的指标包括: 随机 - 动量 Fisher - 趋势 ATR - 波动率也明确定义了信号箭头底部的止损位置(使用 ATR 止损方法)。 具有良好风险管理的风险回报比可以从 1:1 到 1:4 不等。 买入 - 当买入信号在 2 个看跌柱和 1 个看涨柱后弹出时。 卖出 - 当卖出信号在 2 个看涨柱和 1 个看跌柱后弹出时。 附加功能 用于在图表上打开/关闭信号但不发出警报的切换按钮。 设置面板上的可调参数(下载时的首选设置)。 启用电子邮件/推送通知,在您离开屏幕时提醒您注意信号。 一个非常简单易用的指标,适用于所有市场。灌输纪律并帮助交易者专注于流程。 适合在止损和获利安置中苦苦挣扎的新手/交易者。专业交易员也不例外。 24 小时支持。 注意事项 如果指标未能出现在您的图表屏幕上,您需要联系我并安装自定义鱼指标。
The GT_SqueezeBreakOut signal indicator is a momentum based strategy using the bollinger bands and standard deviation indicators (which indicate periods of low volatility and eventual breakout) as well as the Fisher momentum/trend indicator to filter quality trade signals.  It shows the squeeze (price consolidation) periods on chart and also signals on breakout of squeeze/price consolidation. You get instant alert/ push notification both on chart and on any other device used to receive alert sig
MT4 Trade Journal
Nnamdi Kennedy Ifeorah
This MT4 Trading Journal Indicator is a   powerful, professional-grade tool   that transforms the standard MetaTrader 4 platform into a comprehensive trading management system. Its unique multi-instance capability, customizable interface, and automatic tracking features make it an exceptional value proposition for traders seeking organization and discipline in their trading activities. 1. VISUAL BRANDING & CUSTOMIZATION Dynamic Color Coordination : The title bar automatically matches the toggle
GOLD vs USD
Nnamdi Kennedy Ifeorah
Enhanced GOLD–USD RSI Correlation System 4.0 The Gold Standard in Gold Trading: Multi-Confirmation RSI System+Raw Geometric index with Real-Time Alerts INTRODUCTION GOLD vs USD RSI/Geometric Cross Indicator   is a professional-grade trading system that revolutionizes Gold/USD analysis by providing multi-dimensional confirmation signals. Built for serious traders who demand precision, this indicator combines traditional RSI momentum with advanced relative strength analysis to identify high-proba
Currency Strength Table HYBRID v1.33   - Professional Multi-Timeframe Currency Strength Analyzer (PRO) BREAKTHROUGH CURRENCY ANALYSIS SOLUTION FOR SERIOUS FOREX TRADERS!  *Note: Most suitable for Professionals, Advanced & Intermediate traders!   * ADDITIONAL BONUS:   Rent for 3months and get a free ex.4 dual switch momentum (RSI+Prcie/Bid Ratio) Currency Bar Meter . See attached screenshot 6 .  Limited offer (first 50 purchases). The Ultimate All-In-One Currency Strength Dashboard EXPLAINED. St
Currency Power Meter CPM
Nnamdi Kennedy Ifeorah
GT Tools CPM – Currency Power Meter Dual Engine Strength Dashboard (Price Momentum + RSI Momentum) See the Real Power Behind the Market GT Tools CPM (Currency Power Meter) is a professional-grade multi-currency strength dashboard designed to reveal the true underlying power of individual currencies — not just pairs. Instead of guessing which pair to trade, CPM shows you: Which currency is strongest Which currency is weakest How momentum is shifting Whether price structure or RSI momentum
CustomsTF Master
Nnamdi Kennedy Ifeorah
CustomTF Master — 16 Custom Timeframes + Live Switcher Panel One Indicator. No DLL. No Scripts. No Extra Files. Upgrade your MT4 Terminal! THE PROBLEM THIS SOLVES MetaTrader 4 ships with only 9 timeframes: M1, M5, M15, M30, H1, H4, D1, W1, MN. Serious traders know that some of the most powerful price action setups form on timeframes MT4 simply does not offer — M2, M8, M10, M20, M40, M45, H2, H3, H5, H6, H8, H12, H16, H32, and more totalling 25 timeframes at your disposal compared to current MT4'
GT Symbol Switcher Pro
Nnamdi Kennedy Ifeorah
GT SymbolSwitcherPro is a professional chart-integrated navigation panel that replaces the MT4 Market Watch window with a sleek, customizable, and visually intelligent symbol switcher. It delivers one-click symbol switching, real-time P&L visualization, and persistent state management — all rendered directly on your chart with zero interference to your trading workflow. Key Features Dual Placement Modes On-Chart Floating Panel — A draggable, collapsible panel that hovers over your chart. Positio
SymbolSwitcherPro2
Nnamdi Kennedy Ifeorah
SymbolSwitcher Pro2 "The Upgrade": The Ultimate Multi-Interface Trading Command Center  Are you tired of clogging your MT4 charts with four or five different indicators just to manage your workspace? Frustrated by legacy MT4 crashes when switching between your heavily customized templates? Meet SymbolSwitcher Pro2  "The Upgrade" — a first-of-its-kind, unified trading dashboard that consolidates five mechanical charting operations into a single, lightning-fast control panel . Built with an advanc
筛选:
无评论
回复评论