The Chart Mechanics Opening Range Indicator

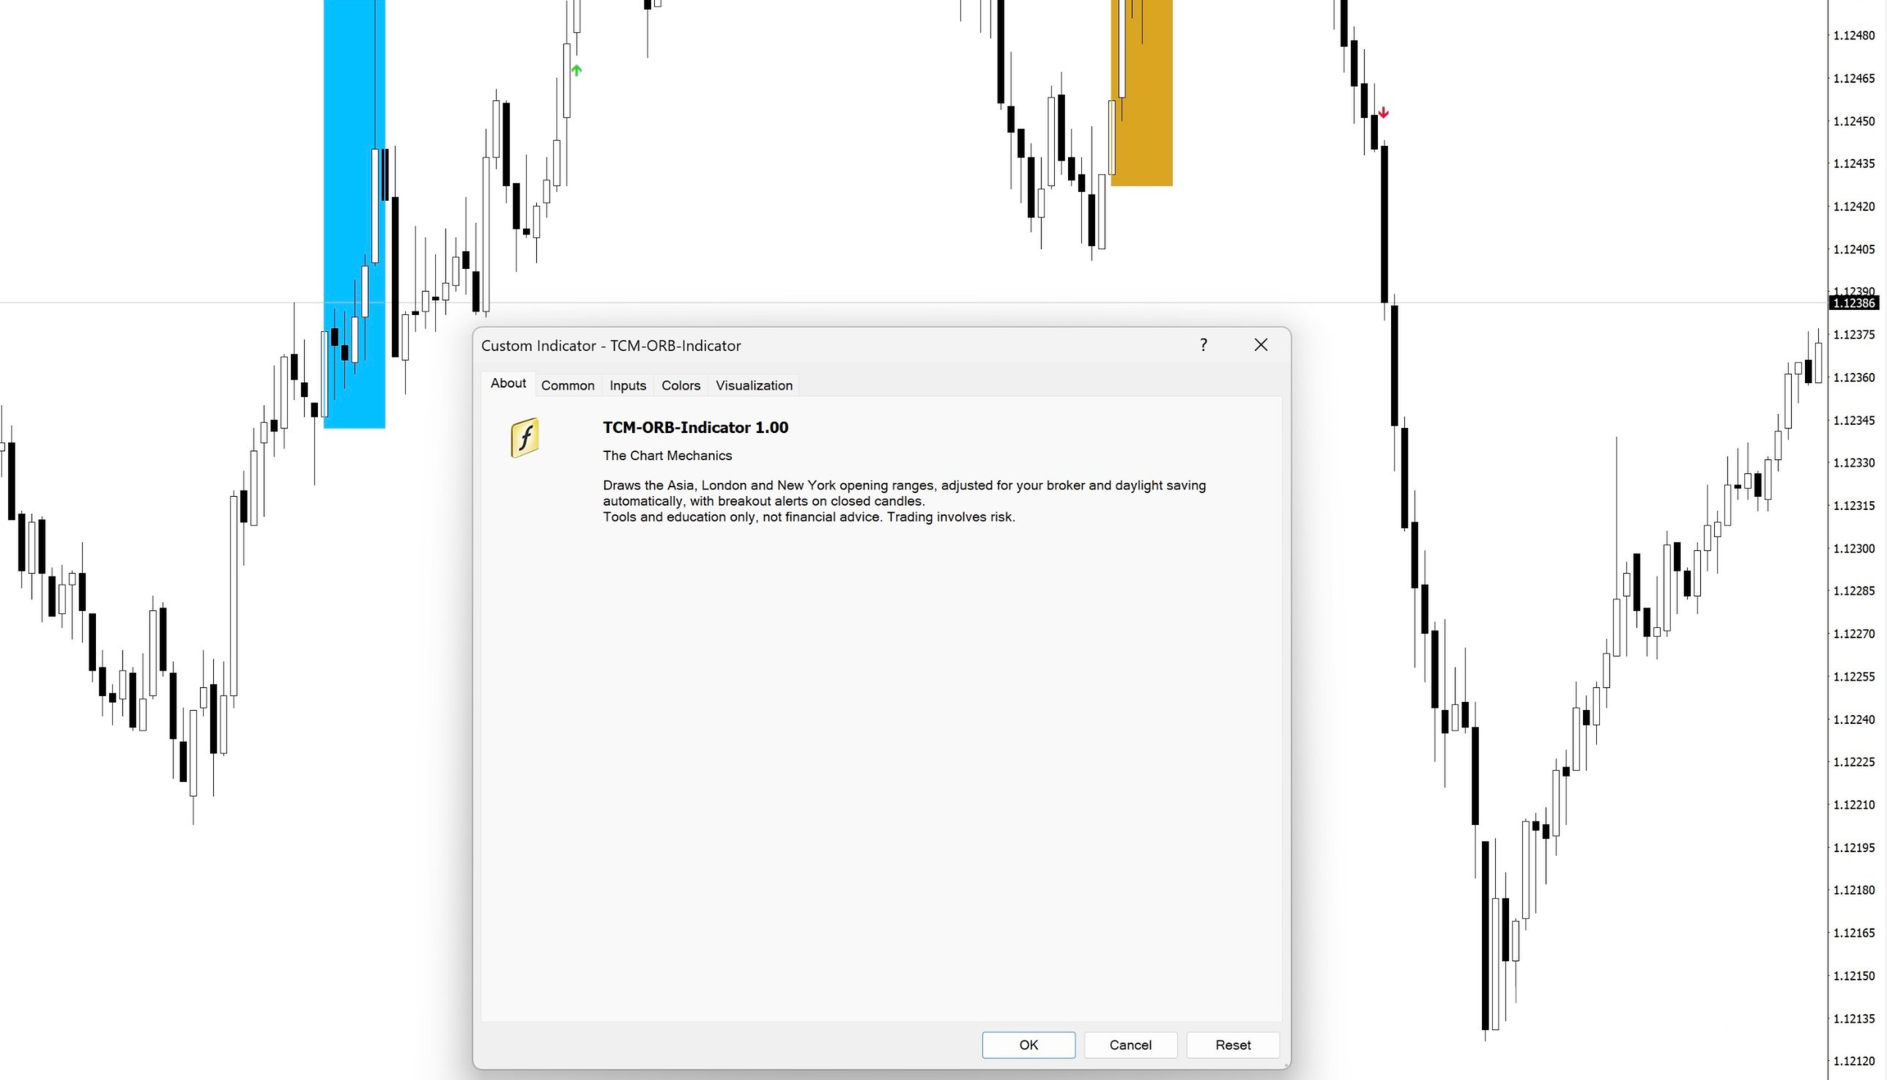
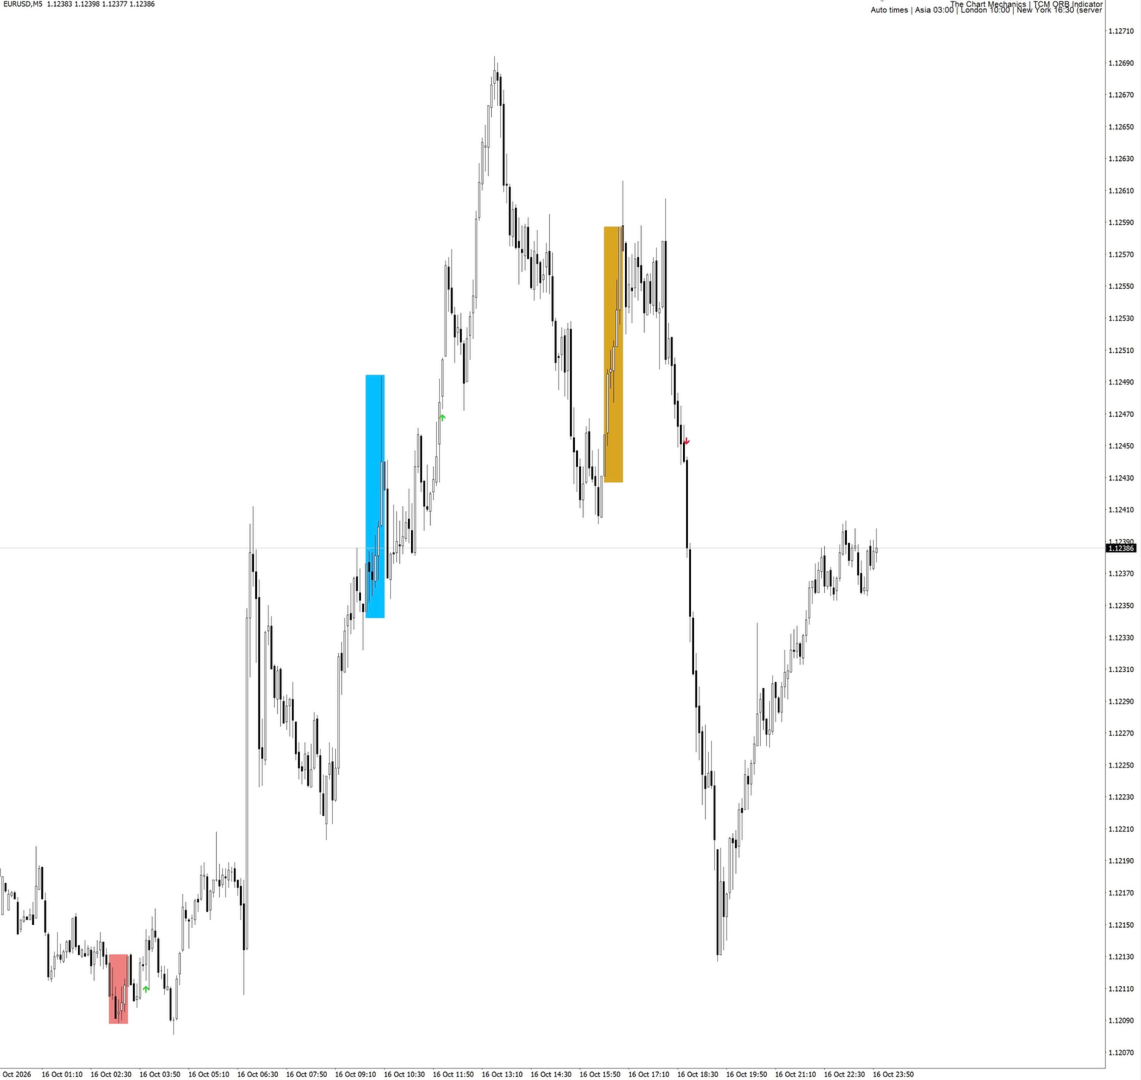
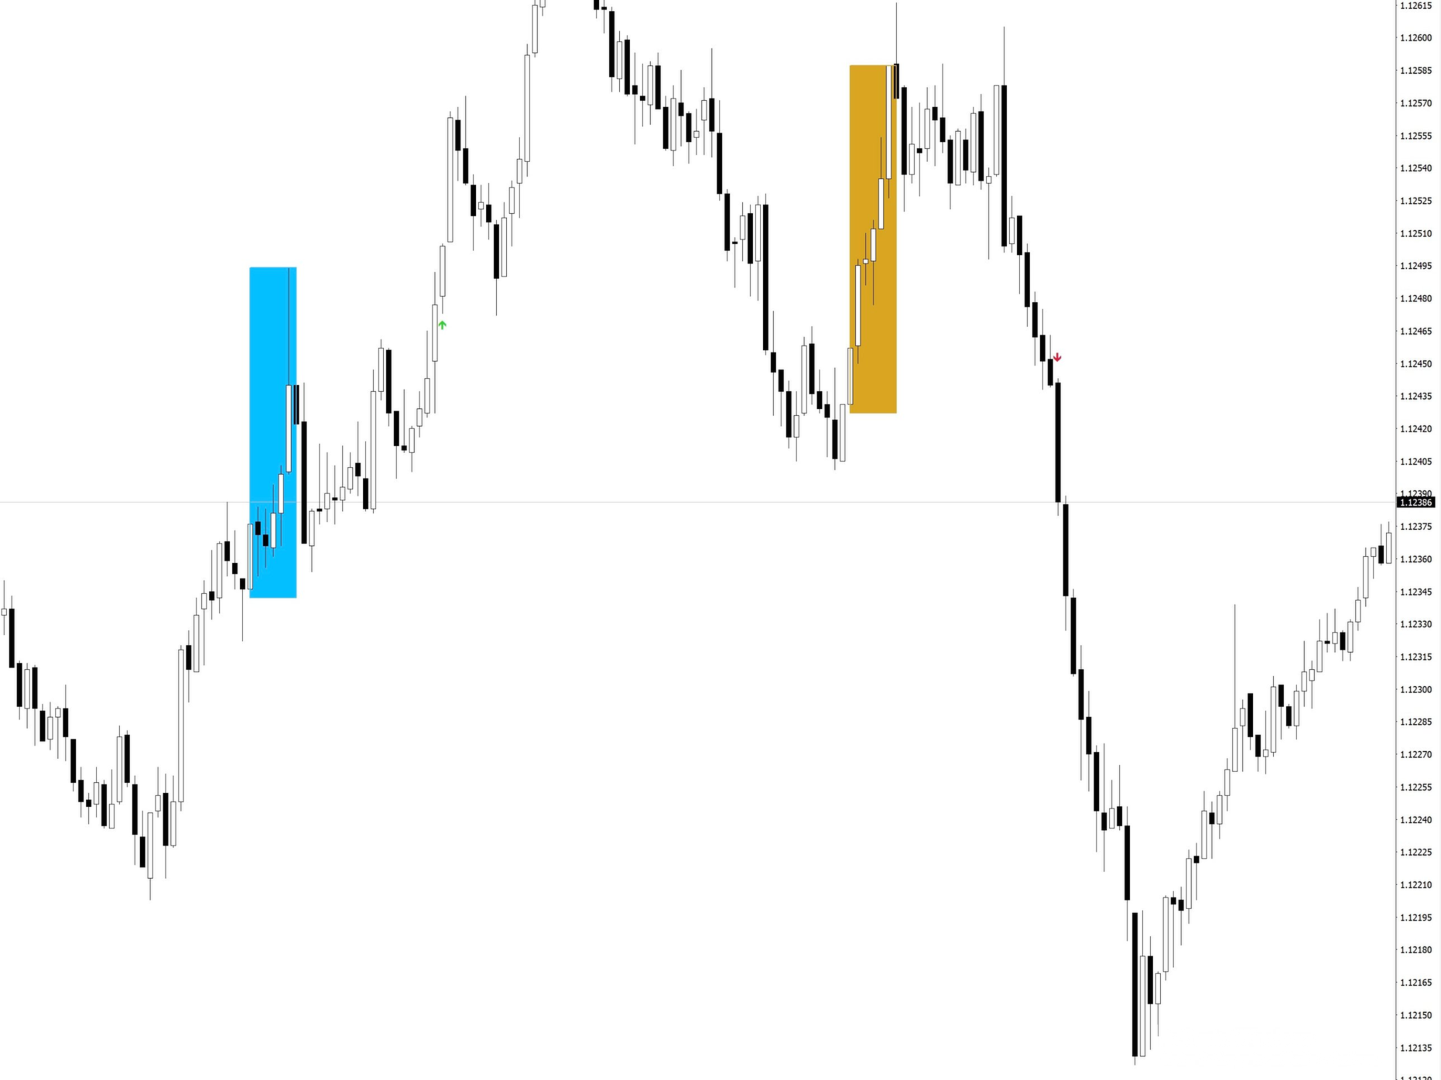
TCM ORB Indicator for MetaTrader 4 draws the opening range of the Asia, London and New York sessions and marks breakouts from each range on closed candles. What it shows - A box for each session's opening range (the first 30 minutes by default, adjustable) - Session times adjusted to your broker's clock and daylight saving automatically, or set manually - A breakout arrow when a candle closes outside the range - Optional entry, stop-loss and take-profit lines for each breakout, with an adjustable reward multiple and stop buffer - Each session's breakouts can end when the next session opens Alerts Pop-up alerts and optional push notifications to the MetaTrader mobile app on a new breakout. Inputs Session times (automatic or manual), Opening range length, Show London, New York and Asia, End breakouts at the next session, Days of boxes to show, Manual session hours, Latest breakout time, Show trade levels, Reward multiple, Stop buffer, Pop-up alerts, Push notifications, Arrows and colours, Show title, Title position. Works on any symbol. Best on M5 to M30 charts. The indicator does not place trades. Tools and education only. Not financial advice. Trading involves risk.
推荐产品
Lineverse Trendlines
Arkady Segal
5 (1)
Automatic, live & interactive picture of all trendlines. Assign push, email and sound alerts to the lines of your choice and be informed about price rollback, breakout, rollback after breakout, number of rollbacks, line expiration by double breakout. Correct, drag or delete the lines and interactively tune the line system. https://youtu.be/EJUo9pYiHFA . Chart examples https: //www.mql5.com/en/users/efficientforex Price Interaction Events All events are effective immediately and only after one
介绍 ON Trade Waves Patterns Harmonic Elliot Wolfe,这是一款高级指标,旨在使用手动和自动方法检测各种市场模式。以下是它的工作原理: 谐波模式: 该指标可以识别出现在您图表上的谐波模式。这些模式对于练习谐波交易理论的交易者非常重要,正如Scott Carney的书《谐波交易第1卷和第2卷》所描述的那样。无论您是手动绘制它们还是依赖自动检测,ON Trade Waves Patterns都可以胜任。 控制面板: 我们配备了一个用户友好的控制面板,它会保存您的图表和时间帧设置,使您可以轻松切换不同配置。您甚至可以最小化它以最大化图表空间。如果您更喜欢使用其他分析工具,只需单击关闭按钮即可隐藏所有指标数据。 模板保存: 当您自定义设置或添加其他指标,如移动平均线或布林带时,该指标会自动保存您的模板。这意味着您可以随时轻松加载您喜欢的设置。 优化显示: 对于Windows 10用户,我们建议调整您的DPI设置以获得高清设备上的最佳屏幕体验。右键单击MetaTrader图标,选择“兼容性”,然后选择“更改高DPI设置”,将其设置为“系统(增强)”。
Gann Price Level
Kirill Borovskii
The indicator is designed to work on any trading platform. The program is based on proprietary algorithms and W.D.Ganna's mathematics, allowing you to calculate target levels of price movement based on three points with the highest degree of certainty. It is a great tool for stock trading. The indicator has three buttons: NEW - call up a triangle for calculation. DEL - delete the selected triangle. DELS - completely remove all constructions. The probability of achieving the goals is more than 80
Reversal Edge System是一款专为MetaTrader 4打造的专业顶底工具指标。它识别潜在趋势信号区域,输出清晰的交易信号,并通过多周期趋势分析做信号滤波,简化想象交易形态。 指标实时展现市场情绪:强烈看多强烈看空偏多偏空多空闭合 每个信号都涉及预设止盈(TP)与止损(SL)价位,做好风险管理。指标内置信号回测功能,统计核心数据:胜率、信号总数,交易者可以直接在图表上可视化评估历史表现。 核心功能: 顶底信号 多周期(MTF)趋势确认过滤器 实时市场情绪标签 每个信号自带止盈与止损 信号回测模拟 胜率与信号总数统计 支持外汇、加密货币、指数与商品 无重绘提示 借助可验证的食谱格局与内置风控,更智能地交易,获得您的交易优势。
This Indicator is use the ZigZag to calculate the Upper and  Lower Bound and the uptrend and the downtrned. Red for downtrend, Green for uptrend and Yellow is for the horizontal trend this horizontal trend also bookmarked the upper limited and the lower limited the the price swings.  Or in simple the Support and the Resistance level. However, You may use the Heikin Ashi to confirm the trend of the buy sell signal above. I cannot guarantee the win rate, Nevertheless, you must study well the timef
GEM Signal MT4
Shengzu Zhong
GEM Signal Pro GEM Signal Pro 是一款適用於 MetaTrader 4 的趨勢跟隨指標,專為希望在圖表上獲得更清晰訊號、更有結構的交易設定,以及更實用風險管理的交易者而設計。 它不僅僅顯示一個簡單的箭頭,GEM Signal Pro 還能以更清晰、更易讀的方式呈現完整的交易思路。當條件確認完成後,指標可在圖表上顯示進場價、止損價與止盈目標,幫助交易者更有效率地評估交易設定。 運作方式 該指標首先根據其內部邏輯識別有效的初始訊號。 當確認條件滿足後,GEM Signal Pro 會在圖表上顯示完整的交易設定。這讓交易者可以更清楚地看到交易結構,並減少手動分析與計算的工作量。 圖表上的交易價位 對於已確認的訊號,GEM Signal Pro 可顯示: 進場價 止損價 止盈 1 止盈 2 止盈 3 風險報酬比 這讓交易設定更容易理解,也有助於讓圖表分析更有條理。 內建風險管理 風險管理是此指標設計的重要部分。 止損位基於近期市場結構,結合附近的擺動高低點與可選的 ATR 緩衝距離。這能讓交易價位更貼近當前市場條件,而不只是依賴固定距離。 圖表資訊面板 GEM Si
Limitless MT4
Dmitriy Kashevich
Limitless MT4 is a universal indicator suitable for every beginner and experienced trader. works on all currency pairs, cryptocurrencies, raw stocks Limitless MT4 - already configured and does not require additional configuration And now the main thing Why Limitless MT4? 1 complete lack of redrawing 2 two years of testing by the best specialists in trading 3 the accuracy of correct signals exceeds 80% 4 performed well in trading during news releases Trading rules 1 buy signal - the ap
Flag Pattern Pro
Noiros Tech
5 (4)
Flag Pattern pro is a   Price Action (PA)   analytical tool that scans the   continuation patterns   known as   "Flag and Pennant Patterns"   . Flag and Pennant patterns are continuation patterns characterized by a move in a previous trend direction after a shallow retracement usually below 50% of the original move . Deep retracements can however be sometimes found at the 61.8 % levels. The original move is know as the   flag pole   and the   retracement   is called the flag.   Indicator Funda
Cycles Predictor
Martin Eshleman
Cycles Predictor Indicator This indicator uses past market cycles to predict future price movements. The indicator scans through past data and considers  combinations  of cycles. When cycles  coincide  at the same future date/time then it is considered a valid future prediction. The predictions are drawn as vertical lines on the right side of the chart in the future. A prediction will often result in type of candle (ex. bull or bear) and/or a reversal point (ex. bottom or top) forming at this ex
BSA Indicator
Ahmet Metin Yilmaz
BSA indicator is a ZigZag based indicator. This indicator is used to find the reversal level of the price. You can use the existing risk ratio and calculation timeframe in the entries by optimizing them according to your usage preference.  In lower time frames, the indicator can repaint. For healthier results, you can detect the least repainting by observing for a while according to the graphic you will apply.
Trading is a trade war. So a trader is a warrior. A warrior needs to be armed with a weapon This Binary Star Wars Pro  is your workout routine. That can accelerate the results precisely Who deserves this kind of precision weapon? 1. People who want to profit. From binary options trading 2. Those who want to trade short, profit fast 3. People who want long-term Can be done 4. Newbie can use it. 5. Old hands can be used very well. How it works It works very easy. For binary options Time frame
The 10PIPS Dynamite
Stephen Kehinde Kuku
The 10PIPS Dynamite is a semi-automated  cutting-edge Forex indicator designed to    automatically revolutionize your trading skills from a being a losing trader to becoming a profitable trader simply by Scalping   10 pips per Trade setup generated by the software. 10PIPS Dynamite Indicator once attached on the main chart it starts an in-depth market analysis based on its unique in-built advanced algorithm which seamlessly combines powerful indicators, statistical analysis, and trend recognition
This indicator is specially made for binary options trading. The indicator works well with seven currency pairs. EURUSD, AUDCAD, GBPUSD,  AUDUSD, EURGBP, EURJPY, NZDUSD. The indicator works with online daily quotes on mt4 as well as offline OTC quotes for weekend trading. Provided your options broker offer OTC facility for weekend trading. It is profitable with or without martingale. But more profitable with martingale of 6 steps maximum. It work on 1 minute, 5 minutes, 15 minutes and 30 minutes
Introduction to Fractal Pattern Scanner Fractal Indicator refers to the technical indicator that makes use of the fractal geometry found in the financial market. Fractal Pattern Scanner is the advanced Fractal Indicator that brings the latest trading technology after the extensive research and development work in the fractal geometry in the financial market. The most important feature in Fractal Pattern Scanner is the ability to measure the turning point probability as well as the trend probabi
Msht Price Pattern MT4
Ngoc Hoai Thuong Doan
Instantly spot simple candlestick patterns with MSHT Price Pattern MSHT PRICE PATTERN can automatically detect more than 200 different candlestick patterns, including multi-candle patterns. This makes it easy for you to see if what you care about is present on a chart or not at a glance, and reduces the amount of time you have to stare at charts to check off items on your investment checklist. Candlestick Pattern Recognition is supported on charts, alerts, in scanners and smart checklists. All
First time on MetaTrader, introducing IQ Star Lines - an original Vedic Astrology based indicator. "Millionaires don't use astrology, billionaires do" . - J.P. Morgan, Legendary American financier and banker. We don't offer free or bonus indicators in exchange of reviews from you. You won't need any free products with this indicator to make it work. ;) Enjoy! Welcome to  the new and updated  IQ Star Lines , the ultimate fusion of ancient planetary harmonic cycles and modern quantitative trading.
Gann Zone Pro
Kirill Borovskii
This indicator identifies and displays zones, as it were areas of strength, where the price will unfold. The indicator can work on any chart, any instrument, at any timeframe. The indicator has two modes. The indicator is equipped with a control panel with buttons for convenience and split into two modes. Manual mode: To work with manual mode, you need to press the NEW button, a segment will appear. This segment is stretched over the movement and the LVL button is pressed. The level is displayed
Market Structure Break Out
Ashkan Hazegh Nikrou
5 (9)
以高成功率检测 Indirection Break Out Signal 。 价格将在8月15日前上涨至119$ Market Structure Break Out (MSB) 简介 , 该指标是一款专为 MT4 和 MT5 平台 设计的高级工具,帮助交易者通过价格结构的视角观察市场走势。它使用箭头和警报识别并突出显示关键的 交易信号 ,包括 顺趋势方向 和 逆趋势方向 (反转信号)。 其突出功能之一是能够 绘制未被突破的供需区域 ,为交易者提供对关键价格区域的清晰洞察。此外, 实时回测功能 允许用户直接在图表上查看指标的历史表现,为其信号提供透明度和信心。 如何领取 ? 点击此处下载 EA 。请注意,此 EA 仅在您已购买 Market Structure Break Out 指标的情况下才能使用。 免费的 Market Structure Breakout EA ,可根据突破箭头自动开仓,支持固定手数以及可自定义的止损和止盈水平。 Market Structure Break Out 的 MT5 版本在这里 : 访问 MT5 版本 Market Structure Break
There are 8 types of this indicator. Consisted of 1. Bullish and Bearish Engulfing 2. Morning and Evening Star 3. Three Green Soldiers and Three Red Crows 4. Three Inside Up and Down 5. Three Outside Up and Down 6. Bullish and Bearish Harami 7. Tweezers Top and Bottom 8. Piercing and Dark cloud cover Signal Filter :: 1. The appearance of the candle stick 2. SMA 3. 2EMA :: EMA Fast and EMA Slow 4. RSI N otification :: 1. Via screen 2. Email 2. Phone For trading 1. Scaling 2. Binary options 3.
ORB Williams FPO
Jaime Ynzenga Gimeno
ORB-Williams FPO 交易機器人是結合了不同的開盤區間突破 (ORB) 策略(包括 Toby Crabel 的策略)以及其他趨勢指標以獲得更好的入場信號,以及前者的退出策略拉里威廉姆斯的盈利開盤 (FPO)。 您可以看到我對信號的真實自動交易的結果: https://www.mql5.com/en/signals/1481106?source=Site +Signals+Favorites 開盤區間突破 (ORB) 是一個價格變化區間,每個時段都會產生支撐位和阻力位的組合,將自身定位為有利於突破區間,當上行突破時,它是買入信號或做多,當它崩潰時,它是賣出或做空的信號。 這些水平主要取決於系統具有的幾個參數,因此根據我們賦予這些參數的值,系統的結果可能會有很大差異。有問題的參數是“no_trade_hour”和“trade_hour”。這兩個參數雖然是整數,但實際上代表一天中的時間。 系統採用4種範圍計算方法:樞軸點;克拉貝爾;最大最小值;樞軸 MaxMin。 系統從“open_hour”參數標記的時間到價格突破支撐位或阻力位的突破方向開倉。 FPO 代表 Fi
简介: 在二元期权和外汇交易的快节奏世界中,拥有合适的工具和策略可以为您在成功和失败之间取得成功。其中一种工具是 BBB 黑蓝二元期权指标系统,这是一种革命性的交易方法,它利用图表模式、移动平均线和交易量来帮助交易者做出明智的决策。在本全面指南中,我们将深入探讨 BBB 系统的细节,解释其工作原理、何时使用以及如何潜在地增强您的交易表现。 BBB 指标系统简介: BBB 黑蓝二元期权指标系统是一款复杂的技术分析工具,旨在帮助交易者识别二元期权和外汇交易的最佳入场和退出点。它得名于其主要组成部分:“黑色”和“蓝色”,它们代表执行交易的关键信号。 图表模式: BBB 系统首先通过分析交易图表的已计数部分进行分析。这涉及识别价格走势中的特定模式或形态,例如支撑和阻力水平、趋势线和蜡烛图模式。这些图表模式为做出交易决策提供了关键的背景,是系统运行的基础。 移动平均线: 该系统使用两种不同类型的移动平均线进行比较:简单移动平均线 (SMA) 和指数移动平均线 (EMA)。这些移动平均线帮助交易者判断市场总体趋势和动量。 SMA(简单移动平均线): SMA 计算特定时间段内的平均价格,提供价格走势
The Raven Binary Options Indicator
Ellan Dirgantara Tholkhah
1 (1)
UPDATE: Works EXTREMELY well for EURJPY! --> more than 66% win rate monthly Guarantee! I want to introduce you the next-gen unique adaptive Binary options Indicator. This will destroy EURUSD & EURJPY The Raven is so sharp and efficient that it will pick the tops and bottoms of ANY type of market. Can also be used as a Forex Scalper. The Raven signal is based on multiple confirmation analysis. Gets confirmation from the most consistent signals known to man; Ichimoku, SMA, Bollinger Bands; and als
Fantastic Price Entry
Muhammed Emin Ugur
The   Fantastic Price Entry   Signal Indicator is a powerful tool designed to assist traders in making informed decisions in the financial markets. This advanced indicator leverages cutting-edge algorithms and technical analysis to identify potential entry points with high accuracy.  Features: 1. Precision Entry Points: The indicator generates precise arrow signals on the chart, highlighting potential entry points for various trading strategies. 2. Trend Identification: By analyzing price mov
LDS Scalper
Justice Chinemelum Clement
PLEASE LEAVE US A 5-STAR REVIEW   LDS Scalper User Manual+ Extra LDS CSDIF INDICATOR + Training Videos   ABOUT LDS SCALPER INDICATOR STRATEGY Built on  15+ years of trading experience. LDS Scalper is a very powerful  trading indicator for scalping strategy, returns very high accuracy rate in forex, futures, cryptocurrencies, stocks and indices. This indicator displays arrow signals based on price action information with high accuracy. The LDS Scalper Indicator strategy when applied can turn a ne
C6MRApro
Guo Sheng Zhao
这个指标通过沉稳、清晰、专业的视野,为复杂多变的以太市场带来更多秩序的观察体验。 无论面对快速波动、方向反复还是节奏模糊的市场环境,该指标均会引发一个紧张、关注、易观察的决策波动。 视觉反馈有助于降低情绪干扰,避免因画面混杂而产生干扰,让用户更耐心等待值得关注的时刻。它既适合盘中快速浏览,也适合复盘时梳理市场状态,使每一次观察市场更有层次,每一次判断更容易,每一次等待更有目的。  在使用贸易中可以进一步发挥交易的机会以及潜在的食品风险。 指标只是交易的一部分,但是我希望你能借助它更好的解读市场,适应市场,紧随市场的趋势;让你在面对行情的时候可以更稳定,更从容,更自信。 z整个指标不追求夸张的颜色对比,也不做过度的解读,只是安静的解释市场发生的事情,提及市场可能存在的风险,让你感受到市场的节奏,从而理性的做出相应的判断。
Channel Arg Control
Vitalii Zakharuk
The Channel Arg Control indicator, in addition to lines, reflects entry signals in the form of arrows. But how to do that? At first glance, this is not an easy task. But not for the Channel Arg Control indicator, this indicator will tell you whether you have configured the indicator correctly, while you can specify the history interval in the bars that interests you. And yet, how does the indicator tell you? Look at the numbers on the chart near the arrows! This is exactly what you thought, the


ARNOLD´S ROBOT I offer an EA that includes three trading robots: standard [S], grid [G], binary [B]. I haven't developed the latter, binary, because I haven't found a broker, who would have responded to my understanding of binary trading. The robot is intended for use on the MT4 platform. The trading robot uses a news indicator, which makes trading safer. The robot stops before the news and the pause continues even after the news, when the pause time is full, the robot resumes trading. You must
BinaryScalping
Andrey Spiridonov
BinaryScalping is a professional indicator for trading binary options and scalping. The algorithm of the indicator is based on the calculation of pivot points for each time period separately, the location of the price of the trading instrument relative to the pivot points is analyzed and the probability of a trading operation is calculated. The indicator has a built-in filter of trading signals based on the global trend. The indicator is installed in the usual way and works with any trading inst
该指标旨在与艾略特波浪理论相结合,提供了两种不同的工作方式: 自动工作: 在此模式下,指标会自动检测图表上的所有五个动机波浪,并为您提供预测和潜在的逆转区域。它还可以提供警报和推送消息。这种自动功能简化了识别和分析艾略特波浪模式的过程。 手动工作: 此选项适用于喜欢手动方法的交易员,用于手动绘制九个不同等级的波浪。每个等级都可以在它们出现后通过调整图表上的绘制线条来单独定义。此功能简化了手动绘制波浪的过程,使其更加高效。需要注意的是,所有绘图数据将保存在平台的数据文件夹中,以备将来参考。 参数: Name: 指标名称。 Use_System_Visuals: 启用或禁用指标主题,以匹配交易平台的整体外观。 Explain_Comment: 允许启用或禁用波浪编号的解释性注释,有助于理解已识别的波浪。 Show_Last_Candle_Counter: 启用或禁用蜡烛计时器,提供有关当前蜡烛收盘的剩余时间的信息。 Candle_Counter_Color: 蜡烛计时器文本的颜色。 Basic_Wave_Color: 用于表示波浪的主要颜色。 Bullish_Wave_Color: 当检测
Nomen Magic Candle
Noomen Ben Khadimallah Khadimallah
Nomen Magic Candle – Put an End to Chart Chaos! No Repaint MT4 Indicator The wait is finally over. It is time for a revolution on your screen. Welcome to the "Magic Chart." Use the cleanly plotted lines as a high-precision trading strategy, backed by advanced, algorithmic market analysis that precisely decodes hidden liquidity zones—giving you the decisive, invisible edge over the crowd. Do you also feel overwhelmed? By endless analysis, overloaded charts, and indicators that constantly contr
该产品的买家也购买
Miraculous Indicator Binary & Forex v3 StrategySafe Miraculous Indicator Binary & Forex v3 StrategySafe 是一款专业交易指标,适合希望获得清晰信号、强大确认工具以及结构化交易方式的 Binary 和 Forex 交易者。 v3 版本加入了 MIR Dashboard、Miraculous Confirmation Dashboard、GANN Law、Square of 9 水平线、GANN 角度以及更强的 Forex 分析模式。 核心功能 同时支持 Binary 和 Forex 交易模式。 MIR Dashboard 可快速读取市场状态。 Miraculous Confirmation Dashboard 用于确认交易机会。 GANN Law drawing lines 用于 Forex 市场结构分析。 Square of 9 线条、方向和关键价格水平。 1x1 GANN Angle 用于判断趋势压力。 Entry Information TP 帮助寻找合理止盈区域。 Strateg
TrendMaestro
Stefano Frisetti
4 (4)
Attention: beware of SCAMS, TRENDMAESTRO is only ditributed throught MQL5.com market place. note: this indicator is for METATRADER4, if you want the version for METATRADER5 this is the link:  https://www.mql5.com/it/market/product/108106 TRENDMAESTRO ver 2.5 TRENDMAESTRO recognizes a new TREND from the start, he never makes mistakes. The certainty of identifying a new TREND is priceless. DESCRIPTION TRENDMAESTRO identifies a new TREND in the bud, this indicator examines the volatility, volumes a
There is always a need to measure if the market is "quiet" or it is volatile. One of the possible way is to use standard deviations, but the issue is simple : We do not have some levels that could help us find out if the market is in a state of lower or higher volatility. This indicator is attempting to do that : •           values above level 0 are indicating state of higher volatility (=GREEN buffer) •           values below level 0 are indicating state of lower volatility (=RED buffer)
ORB Seeker
Marcela Goncalves De Oliveira
4 (1)
特价促销,限量供应,保持产品稀缺性! 仅售 599 美元! 购买后请联系我以获取奖励的 ORB Seeker EA 和个人优化设置文件。 自信地捕捉干净利落的比赛片段! ORB Seeker 是一款专业的开盘区间突破 (ORB) 指标,专为追求准确性、简洁性、灵活性和清晰图表结构的交易者而设计。 它能自动绘制任何交易品种的盘前或自定义交易时段区间,然后给出清晰的突破信号,包括入场点、止损点、止盈点以及可选的50%部分止盈位。所有数据均实时计算并直接显示在图表上。 您可以选择交易伦敦开盘、纽约交易时段、亚洲交易时段,或者您自定义的交易时段。ORB Seeker 会根据您选择的交易时段自动调整,让您精准掌握市场波动范围、突破位和交易位的位置。 每次购买均免费赠送 ORB Seeker EA 智能交易系统。该 EA 系统读取指标的突破信号并可自动下单,您可以选择手动交易,也可以让 EA 系统根据指标的信号逻辑自动处理入场。   为什么选择 ORB Seeker 支持多个交易时段 - 您可以自行设置伦敦、纽约、亚洲或自定义交易时段的盘前交易时间和交易时段。 完整的突破视觉效果 - 交易最高
Meravith
Ivan Stefanov
5 (3)
做市商工具。 Meravith 将: 分析所有时间周期并显示当前正在运行的趋势。 标注流动性区域(成交量均衡区),即多头与空头成交量相等的位置。 在您的图表上直接显示来自不同时间周期的所有流动性水平。 生成并展示基于文本的市场分析供您参考。 根据当前趋势计算目标位、支撑位和止损位。 计算交易的风险回报比。 根据您的账户余额计算仓位大小,并估算潜在利润。 在市场出现重大变化时,Meravith 还会发出警告。 指标的主要线条: 多头/空头成交量衰竭线 —— 作为目标位使用。 趋势线 —— 指示市场趋势方向。根据市场是多头还是空头而改变颜色,并作为趋势支撑。其颜色主要反映市场情绪。 成交量均衡线(Eq)—— Eq(Volume Equilibrium)是系统的核心。它表示买卖双方成交量的平衡点,即市场流动性所在位置。向上突破 Eq 表示多头倾向,向下突破 Eq 表示空头倾向。突破后,应等待回调——当价格回到相反趋势的偏离线或衰竭线附近时。 使用方法:只需将其添加到图表中。 Meravith 可以分析一切——趋势和回调。 趋势线与某条成交量衰竭线之间的距离越大,说明该方向的成交量越高。 趋
FFx Engulfing Setup Alerter gives trade suggestions with Entry, Target 1, Target 2 and StopLoss. Below are the different options available: Entry suggestion - pips to be added over the break for the entry 3 different options to calculate the SL - by pips, by ATR multiplier or at the pattern High/Low 3 different options to calculate the 2 TPs - by pips, by ATR multiplier or at Risk/Reward Offset the dashboard - any place on the chart Remove the suggestion once the price reached the SL line Lines
FFx InsideBar Setup Alerter gives trade suggestions with Entry, Target 1, Target 2 and StopLoss. Below are the different options available: Entry suggestion - pips to be added over the break for the entry Minimum candle size - to avoid too close buy/sell entry suggestions 3 different options to calculate the SL - by pips, by ATR multiplier or at the pattern High/Low 3 different options to calculate the 2 TPs - by pips, by ATR multiplier or at Risk/Reward Offset the dashboard - any place on the c
FFx OutsideBar Setup Alerter gives trade suggestions with Entry, Target 1, Target 2 and StopLoss. Below are the different options available: Entry suggestion - pips to be added over the break for the entry. 3 different options to calculate the SL - by pips, by ATR multiplier or at the pattern High/Low. 3 different options to calculate the 2 TPs - by pips, by ATR multiplier or at Risk/Reward. Offset the dashboard - any place on the chart. Remove the suggestion once the price reached the SL line.
FFx PinBar Setup Alerter gives trade suggestions with Entry, Target 1, Target 2 and StopLoss. Below are the different options available: Entry suggestion - pips to be added over the break for the entry Minimum candle size - to avoid too small candles 3 different options to calculate the SL - by pips, by ATR multiplier or at the pattern High/Low 3 different options to calculate the 2 TPs - by pips, by ATR multiplier or at Risk/Reward Offset the dashboard - any place on the chart Remove the sugges
FFx MACD Divergences
Eric Venturi-Bloxs
The purpose of this new version of the MT4 standard indicator provided in your platform is to display in a sub-window multiple timeframes of the same indicator with its divergences. See the example shown in the picture below. But the display isn't like a simple MTF indicator. This is the real display of the indicator on its timeframe. Here's the options available in the FFx divergences indicator: Select the timeframes to be displayed (M1 to Monthly) Define the width (number of bars) for each tim
FFx RSI Divergences
Eric Venturi-Bloxs
The purpose of this new version of the MT4 standard indicator provided in your platform is to display in a sub-window multiple timeframes of the same indicator with its divergences. See the example shown in the picture below. But the display isn't like a simple MTF indicator. This is the real display of the indicator on its timeframe. Here's the options available in the FFx divergences indicator: Select the timeframes to be displayed (M1 to Monthly) Define the width (number of bars) for each tim
FFx CCI Divergences
Eric Venturi-Bloxs
The purpose of this new version of the MT4 standard indicator provided in your platform is to display in a sub-window multiple timeframes of the same indicator with its divergences. See the example shown in the picture below. But the display isn't like a simple MTF indicator. This is the real display of the indicator on its timeframe. Here's the options available in the FFx divergences indicator: Select the timeframes to be displayed (M1 to Monthly). Define the width (number of bars) for each ti
The FFx Dashboard MTF alerter will show you on a single chart all the timeframes (M1 to Monthly) with their own status for the indicator. 2 Alert Options: Single timeframe: each selected timeframe alert separately when a signal occurs Multi timeframes: all selected timeframes must agree for an alert to be triggered Both options have an input to select the timeframes to be used for the alert(s). How to Understand the Status: Green/Red square: histogram above/below 0 line Green square + Red bord
The FFx Dashboard MTF alerter will show you on a single chart all the timeframes (M1 to Monthly) with their own status for the indicator. 2 Alert Options: Single timeframe: each selected timeframe alert separately when a signal occurs Multi timeframes: all selected timeframes must agree for an alert to be triggered Both options have an input to select the timeframes to be used for the alert(s). How to understand the status: Green/Red square: RSI above/below 50 line Green square + Red border: R
The FFx Dashboard MTF alerter will show you on a single chart all the timeframes (M1 to Monthly) with their own status for the indicator. 2 Alert Options: Single timeframe: each selected timeframe alert separately when a signal occurs Multi timeframes: all selected timeframes must agree for an alert to be triggered Both options have an input to select the timeframes to be used for the alert(s). How to understand the status: Green/Red square: Stoch above/below 50 line Green square + Red border:
The FFx Dashboard MTF alerter will show you on a single chart all the timeframes (M1 to Monthly) with their own status for the indicator. 2 Alert Options: Single timeframe: each selected timeframe alert separately when a signal occurs Multi timeframes: all selected timeframes must agree for an alert to be triggered Both options have an input to select the timeframes to be used for the alert(s). How to understand the status: Green/Red square: Price above/below Cloud (Kumo) Green square + Red bo
The FFx Dashboard MTF alerter will show you on a single chart all the timeframes (M1 to Monthly) with their own status for the indicator. 2 Alert Options: Single timeframe: each selected timeframe alert separately when a signal occurs Multi timeframes: all selected timeframes must agree for an alert to be triggered Both options have an input to select the timeframes to be used for the alert(s). How to understand the status: Green/Red square: MA pointing Up/Down Green square + Red border: MA po
The FFx Dashboard MTF alerter will show you on a single chart all the timeframes (M1 to Monthly) with their own status for the indicator. 2 Alert Options: Single timeframe: each selected timeframe alert separately when a signal occurs. Multi timeframes: all selected timeframes must agree for an alert to be triggered. Both options have an input to select the timeframes to be used for the alert(s). How to understand the status: Green square: Price above PSAR Red square: Price below PSAR Options
The FFx Dashboard MTF alerter will show you on a single chart all the timeframes (M1 to Monthly) with their own status for the indicator. 2 Alert Options: Single timeframe: each selected timeframe alert separately when a signal occurs Multi timeframes: all selected timeframes must agree for an alert to be triggered Both options have an input to select the timeframes to be used for the alert(s). How to understand the status: Green/Red square: CCI above/below levels (ie. 100/-100) Grey square: C
The FFx Dashboard MTF alerter will show you on a single chart all the timeframes (M1 to Monthly) with their own status for the indicator. 2 Alert Options: Single timeframe: each selected timeframe alert separately when a signal occurs Multi timeframes: all selected timeframes must agree for an alert to be triggered Both options have an input to select the timeframes to be used for the alert(s). How to understand the status: Green/Red square: ADX above level Grey square: ADX below level Red bor
The FFx Dashboard MTF alerter will show you on a single chart all the timeframes (M1 to Monthly) with their own status. 2 Alert Options: Single timeframe: each selected timeframe alert separately when a signal occurs Multi timeframes: all selected timeframes must agree for an alert to be triggered Both options have an input to select the timeframes to be used for the alert(s). How to understand the status: Green/Red square: bullish/bearish candle Options available in the FFx Dashboard Alerter
THE GRAFF III
Charles Harper
The [GRAFF] III manual trading system is based on multiple MetaTrader (MT4) indicators. Together, the entire PACK of GRAFF III indicators makes an advanced trading tool. The system consists of over 20 different custom-built indicators which have been carefully selected and tested in the long term to produce strong and efficient trading signals. The particular indicators are based on different mathematical formulas, so the entire system is calibrated to remove false signals from its own indicator
This indicator allows you to see the strength of the trend on all timeframes. It can be used for all currency pairs. The indicator can be displayed in the form of a column (from left to right): status buy / sell / strong buy / strong sell, strength of the trend in percentage, pips last candle, body candle now, remaining time, and the timeframe of M1 to MN. Information contained below (from left to right): total trend percent, sell percent, buy percent.
FFx Universal Strength Meter PRO is more than a basic strength meter. Instead of limiting the calculation to price, it can be based on any of the 19 integrated strength modes + 9 timeframes. With the FFx USM, you are able to define any period for any combination of timeframes. For example, you can set the dashboard for the last 10 candles for M15-H1-H4… Full flexibility! Very easy to interpret... It gives a great idea about which currency is weak and which is strong, so you can find the best pai
A simplistic indicator informing a user on RSI divergence by sending messages to mobile device and email. The indicator draws 2 vertical lines, marking two RSI extrema that formed the divergence. You get the alert, open the charts and make a decision. The indicator does not show past divergences, thus when you attach it to a chart for the first time you see nothing. Graphics and alerts will appear as soon as divergences do. Drop it in Tester to see how it works. Parameters: RSIPeriod - number of
ZLevels
Sergio Andres Zuleta Lopez
This indicator is based on Market Profile methodology, which contains the Z-Zone , unlike the latter, allows visualization of multiple time frames on the same graph. This methodology has proven to be very effective for: Reduce the number of windows required to analyze or track a financial asset. Display important resistance areas (ROZ), support (SoZ) and average distribution (PoC) in different periods of time. Define areas to take profits as well locate technical stop loss. Analysis in the devel
Pan PrizMA CD Phase is an analogue of the МetaТrader 5 indicator , and is an option based on the Pan PrizMA indicator. Details . Averaging by a quadric-quartic polynomial increases the smoothness of lines, adds momentum and rhythm. Extrapolation by the sinusoid function near a constant allows adjusting the delay or lead of signals. The value of the phase - wave status parameter (which is close in meaning to the trigonometric phase or the angle of the radius-vector rotation in the trigonometric p
Green Wall Arrows
Daniel Luchinger
1 (1)
The Name Green Wall : Arrows hits a lot of TP, by changing the idea of non using SL as something bad, but instead use Small TP and a lot of free Margin and Patience. Use micro TP and a lot of Free Margin with this indicator on Forex. It also can be used with Binary Options. This strategy is intended to be traded Manually. This Indicator runs on Open Bar, arrows will delete when price are against it. The only Indicator Parameter is Alerts true/false, all the rest is included inside the code. Arro
作者的更多信息
Know your lot size before you click Buy or Sell. The Chart Mechanics Risk and Position Size is a free panel for MetaTrader 4. Set how much you want to risk and where your stop goes, and it shows the lot size to use and the money actually at risk in your account currency. It is an indicator, so it never opens, changes or closes trades. WHAT IT SHOWS - Lot size, rounded DOWN to your broker's lot step, so you never risk more than you set - Money at risk after rounding, in your account currency -
FREE
TCM SMC Indicator for MetaTrader 4 marks market structure on your chart: supply and demand zones, breaks of structure, liquidity grabs and fair value gaps. Everything is calculated from closed candles. What it shows - Fresh supply and demand zones, extended to the right until price returns to them, with the option to also show zones that have been revisited - Breaks of structure (BOS), labelled on the chart - Liquidity grabs (LQG), where price runs a recent high or low and turns back - Fair valu
TCM Trend Indicator for MetaTrader 4 highlights trend-following setups on closed candles and shows a suggested entry, stop-loss and take-profit for the latest one. What it shows - An arrow under or over the candle when a bullish or bearish trend setup appears, on closed candles only, so arrows do not repaint - Entry, stop-loss and take-profit lines for the latest setup, with the stop based on market volatility - A title and status line showing the current state Risk : reward Choose 1:1, 1:1.5, 1
TCM Trend EA is a trend-following Expert Advisor for MetaTrader 4, built for the major currency pairs and gold (XAUUSD). Every trade is opened with a stop-loss and a take-profit already set, and the position size is worked out from the risk you choose. It holds one trade at a time per chart. How it works The EA waits for a trend to be confirmed on closed candles and on a higher timeframe before it looks for an entry. It then sizes the trade from your risk setting, places the stop-loss and take-p
TCM ORB Indicator for MetaTrader 5 draws the opening range of the Asia, London and New York sessions and marks breakouts from each range on closed candles. What it shows - A box for each session's opening range (the first 30 minutes by default, adjustable) - Session times adjusted to your broker's clock and daylight saving automatically, or set manually - A breakout arrow when a candle closes outside the range - Optional entry, stop-loss and take-profit lines for each breakout, with an adjustabl
TCM SMC Indicator for MetaTrader 5 marks market structure on your chart: supply and demand zones, breaks of structure, liquidity grabs and fair value gaps. Everything is calculated from closed candles. What it shows - Fresh supply and demand zones, extended to the right until price returns to them, with the option to also show zones that have been revisited - Breaks of structure (BOS), labelled on the chart - Liquidity grabs (LQG), where price runs a recent high or low and turns back - Fair valu
TCM Trend Indicator for MetaTrader 5 highlights trend-following setups on closed candles and shows a suggested entry, stop-loss and take-profit for the latest one. What it shows - An arrow under or over the candle when a bullish or bearish trend setup appears, on closed candles only, so arrows do not repaint - Entry, stop-loss and take-profit lines for the latest setup, with the stop based on market volatility - A title and status line showing the current state Risk : reward Choose 1:1, 1:1.5, 1
TCM Trend EA is a trend-following Expert Advisor for MetaTrader 5, built for the major currency pairs and gold (XAUUSD). Every trade is opened with a stop-loss and a take-profit already set, and the position size is worked out from the risk you choose. It holds one trade at a time per chart. How it works The EA waits for a trend to be confirmed on closed candles and on a higher timeframe before it looks for an entry. It then sizes the trade from your risk setting, places the stop-loss and take-p
Know your lot size before you click Buy or Sell. The Chart Mechanics Risk and Position Size is a free panel for MetaTrader 5. Set how much you want to risk and where your stop goes, and it shows the lot size to use and the money actually at risk in your account currency. It is an indicator, so it never opens, changes or closes trades. WHAT IT SHOWS - Lot size, rounded DOWN to your broker's lot step, so you never risk more than you set - Money at risk after rounding, in your account currency -
FREE
筛选:
无评论
回复评论