Tick Bars
- Göstergeler
- Sürüm: 1.2
- Güncellendi: 15 Şubat 2022

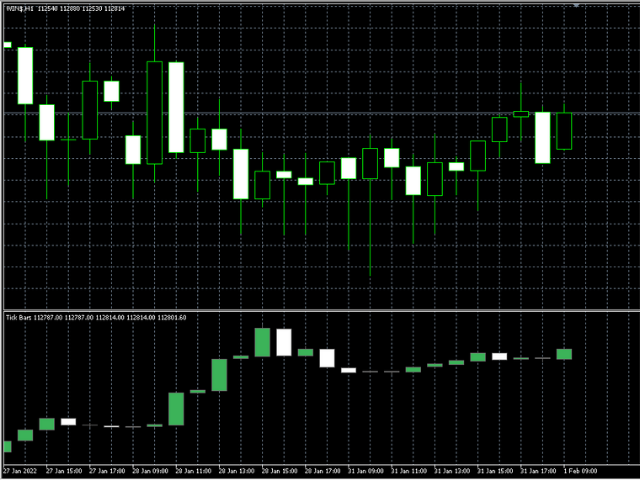
Indicator that show candlestick bars with an different sampling method than time fixed.
Real time data is sourced to the indicator and it may be used as substitute of the default graph.
Each bar is formed when a predefined amount of ticks is received, showing in the graph the OHLC of this clusteri of ticks.
The input variable is the amount of ticks of each bar.
It's a different approach of sampling, the amount of bars is proportional to the amount of negotiations insted of a sample in a fixed amount of time.
Doesn't appear to work. Displays a single bar which disappears when next bar starts. Doesn't display anything if tick ,volume, is used.