• Genel bakış
  • İncelemeler
  • Yorumlar

VSA Smart Money

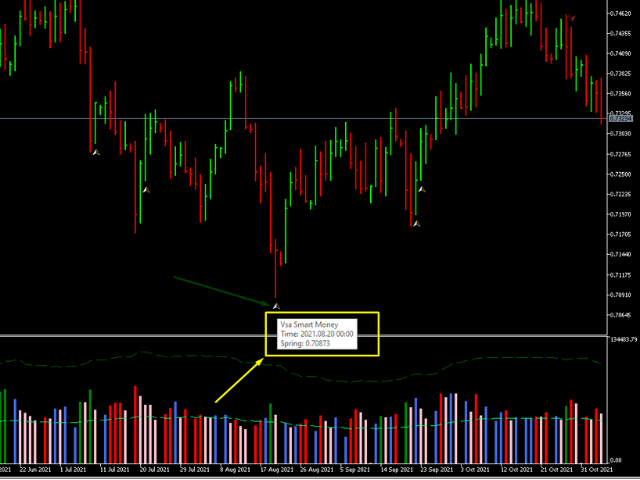
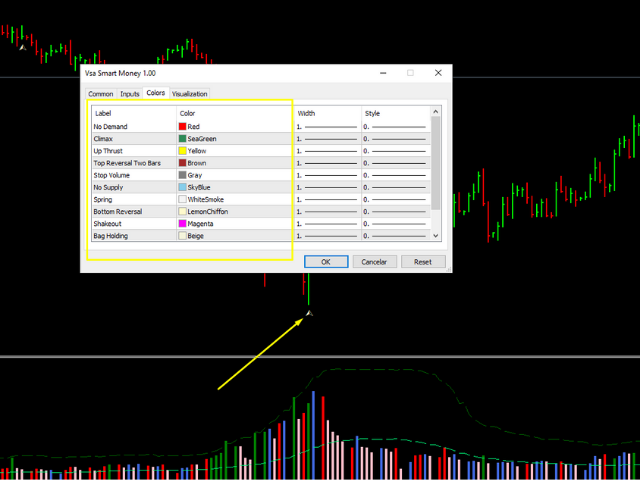
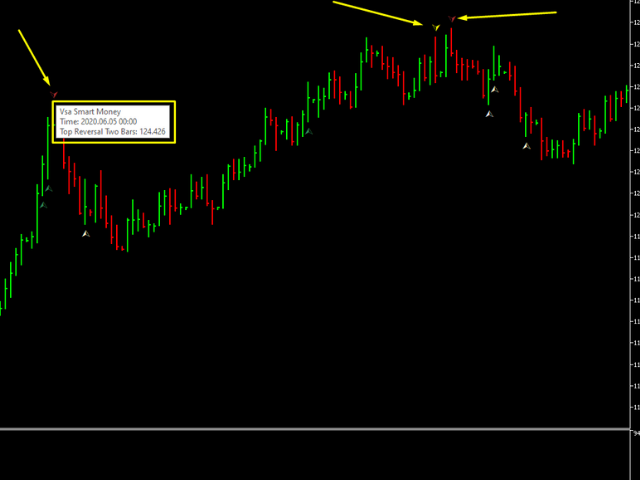
The VSA Smart Money indicator tracks the movement of professional traders, institutional trades and all compound man movements. The VSA Smart money Indicator reads bar by bar, being an excellent tool for those who use VSA, Wyckoff, PVA and Any other analysis that uses price and volume. There are 10 indications that you will find in your Chart: *On Demand *Climax *UT Thrust *Top Reversal bar *Stop Volume *No Supply *Spring *Reversal Bottom *Shakeout *Bag Holding Using this indicator you will be on the trail of Smart Money.


Önerilen ürünler
Xtrade Trend Detector
Dago Elkana Samuel Dadie
Xtrade Trend Detector is an indicator capable of finding the best opportunities to take a position in any stock market. Indeed, it is a great tool for scalpers but also for Daytraders. You could therefore use it to identify areas to trade, it fits easily on a chart. I use it to detect trends on Big timeframes and take positions on Small timeframes. Don't hesitate to give me a feedback if you test it.
Candle Pattern Scanner
Bruno Goncalves Mascarenhas
Candlestick patterns The candlestick Pattern Indicator and Scanner is designed to be a complete aid tool for discretionary traders to find and analyze charts from powerful candle patterns. Recognized Patterns: Hammer Shooting star Bearish Engulfing Bullish Engulfing Doji Marubozu Scanner Imagine if you could look at all the market assets in all timeframes looking for candlestick signals.
Fibrillar
Vitalii Zakharuk
It is very easy to use the Fibrillar indicator, since the simplest is to look at the chart and act according to the indications of the colored arrows. The algorithm takes into account the measurement of prices, and this method also focuses on measuring each of the price drops (H / C, H / O, LC, LO) - which gives more detailed information, but also more averaged. When calculating this indicator, logarithmic gains are first calculated at the closing price, which allows you to filter out the tre
The  Dragonfly Doji candlestick pattern is formed by one single candle. Here’s how to identify the Dragonfly Doji candlestick pattern: The candle has no body The wick at the bottom must be big At the top, it should have no wick, or be very small This 1-candle bullish candlestick pattern is a reversal pattern, meaning that it’s used to find bottoms. For this reason, we want to see this pattern after a move to the downside, showing that bulls are starting to take control. When a Dragonfly Doji can
Identify Engulfing   candle pattern  with Arrows & Alert ( built-in   RSI filter). This indicator helps you to identify Engulfing candle pattern or Outside bar (OB) on the chart with arrows, along with an alert when a new Engulfing candle appears. Engulfing candle pattern is one of the most important reversal Price Action signals. You can choose between standard Engulfing (Engulfing based on candle body) or non standard Engulfing (Engulfing based on candle high - low ) Alerts can be turned on
The Candlestick Patterns indicator for MT5 includes 12 types of candlestick signales in only one indicator. - DoubleTopsAndBottoms - SmallerGettingBars - BiggerGettingBars - ThreeBarsPlay - TwoBarsStrike - Hammers - InsideBars - OutsideBars - LongCandles - TwoGreenTwoRed Candles - ThreeGreenThreeRed Candles The indicator creats a arrow above or under the signal candle and a little character inside the candle to display the type of the signal. For long candles the indicator can display the exac
This multi time frame and multi symbol indicator identifies high-probability breakout patterns. It does this by identifying strong, symmetrical pennants and triangles. This pattern  DOES NOT  appear very often on higher timeframes. But when it does, it is a very high-probability setup. The indicator also includes an Inside bars scanner. It can for example be used to detect a special type of Inside bars formation which is formed by a Master candle (MC) followed by 4 inside candles (please see the
Exclusive Limited Time Offer! Grab this useful indicator for a lifetime at just $49. Note: It is requested that purchases must be refrained from if the buyer is from India, Bangladesh, or Pakistan, as developer support for these regions is unavailable due to legal restrictions. Volatility indicator dashboard designed to revolutionize how traders perceive and navigate market volatility. Track volatile for multiple currency pairs one at time for multiple timeframes. Works best with Forex Market,
CandleStick Pattern Indicator MT5
Driller Capital Management UG
5 (1)
This is a simple Candle Stick Pattern Indicator, which shows in the current time period all standardisized Patterns in the chart. All Patterns will be calculatet automatically based on standard conditions. Following Candle Stick Patterns are included: Bullish Hammer | Bearish Hammer Bullish Inverted Hammer | Bearish Inverted Hammer Bullish Engulfing | Bearish Engulfing Piercing | Dark Cloud Cover Bullish 3 Inside | Bearish 3 Inside There are only a few settings at the begining to take. Every Pat
FREE
This indicator allows you to enjoy the two most popular products for analyzing request volumes and market deals at a favorable price: Actual Depth of Market Chart Actual Tick Footprint Volume Chart This product combines the power of both indicators and is provided as a single file. The functionality of Actual COMBO Depth of Market AND Tick Volume Chart is fully identical to the original indicators. You will enjoy the power of these two products combined into the single super-indicator! Below is
This is a simple arrow system based on Engulfing Candlestick Pattern. It gives you alerts on your smartphone when there is an engulfing candlestick pattern happens. Which type of alerts available? 1. It paints on chart Up/Down Arrows. 2. Popup message and sound alert in trading terminal window. 3. Push notification or Alert on your Android and IOS mobile phones (requires MT4 or MT5 app installed!) *Note: Use it on higher timeframes like H4 (4 hours), D1 (1 Day) then find trade opportunities on s
Adaptive Trend Lines
Henri Salvatore Bigatti
4.73 (26)
This indicator shows the TLH and TLL and some trendlines that allow us to estimate the trend of market.  It also shows the values of the angles of the lines in percentage in points (pip) , the standard deviation, and the trend of each line, and when it breaks the lines of support and resistance (TLH and TLL). And finally, it also shows the points identified as supports and resistances through the fractal algorithm in the graph. The high and low trend lines are supported by the highs and lows, th
FREE
Supply Demand Ranger
Krzysztof Janusz Stankiewic
5 (2)
The indicator draws supply and demand zones. The zone timeframe can be set independently of the chart timeframe. For instance, it is possible to set M5 zones on an H4 chart. The importance of zones can be adjusted using the zone strength parameter. Demand zones are displayed if at least one candle in the range of the zone is entirely above the zone. Similarly, supply zones are displayed if at least one candle within the zone is entirely below the zone.
Fractals true extremums is a modification of the Fractals indicator. The indicator sorts out weak fractals leaving only the ones that are significant for searching the chart extreme points. The sorting is performed during fractals construction. The old data does not change. Only the last value can change (just like in the standard Fractals indicator). The indicator can show lines indicating Fractals from higher timeframes. The product can be used by EAs for comparing price extreme points on cha
Automatic pattern recognition software for MT5 Price action analysis (automatic levels) tool: https://www.mql5.com/en/market/product/94338 Trend lines Common chart patterns eg triangles, flags, pennants etc range detection with latest support and resistance levels. object updates to avoid lagging signals. Telegram updates  just place your chart ID in the inputs section and it will send you screenshots at a given interval of what is happening in the market so you do not miss out on any opportun
Description : Rainbow EA MT5 is a simple Expert advisor based on   Rainbow MT5 indicator witch is based on Moving average with period 34. The indicator is incorporated in the EA, therefore, it is not required for the EA to operate, but if you wish, you can download it from   my product page . The Expert Advisor settings are as follows : Suitable for Timeframes up to H1 The parameters below can be set according to your trading rules. StopLoss ( Stop Loss in pips) TakeProfit ( Take Profit in pi
FULL TREND KILLER is an indicator based on Bollingen Bands and it is easy to use; no internal adjustments to be made. It is specially designed for synthetic indices but also works well on Forex Assets. The best time frame to use on synthetic indices is M15, this is just a tip, however it can be used on all time frames. Settings : BANDS PERIOD Push Notification Email Notification Audible Alert
This indicator looks for 3 rather strong patterns: Spinning Top pattern Hammer or Hanging Man Inverted Hammer or Shooting Star These patterns may indicate a trend continuation or its reversal, depending on the location of the patterns. Input parameters Zero - consider candles without a body Multiplier for hammerhigh - multiplier for the larger shadow of the Hammer Multiplier for hammerlow - multiplier for the smaller shadow of the Hammer Multiplier for wolf - multiplier for the shadows of the
MTF-Candlestick (Traders Club) 特徴: このインジケータは上位足のローソク足を表示します。 この上位足のローソク足を表示のインジケータは特に1分足や 5分足トレーダ用に開発されたものになります。 現在のローソク足で上位足のローソク足を作成する部分 と過去の上位足のローソク足を作成する部分を 分けています。また、更新はティックごとではなく 指定した時間ごとになるので急な価格変動があった場合でも チャートがフリーズした状態には非常になりにくいということになります。 陽線や陰線の色を変更出来たり髭の太さを変更できるので非常に 見やすと思います。 各パラメータの説明: Indicator No:インジケータNoを設定します。もし同じチャートに複数適用したい場合には個々の数字を変更してください。 TimeFrame:表示する時間足を設定します。 Bullish candlestick color:陽線のローソク足の色の指定します。 Bearish candlestick color:陰線のローソク足の色の指定します。 Doji c
ReviewCandleChart is a unique product that can verify past price fluctuations using candlestick charts. This indicator accurately reproduces market price fluctuations in the past and can make trading decisions (entries, profits, loss cut) many times so that you can learn the trading faster. ReviewCandleCahrt is the best indicator to improve trading skills. ReviewCandleCahrt caters to both beginners and advanced traders. Advantages of the indicator This Indicator for verifying price fluctuation
Fibo Ruby
Ignacio Agustin Mene Franco
Fibo Ruby indicator 5/5 pack ruby fibo ruby ​​has the strategy of a programmed fibonacci to capture the bullish trend as bass player ideal for grabbing rebounds at the points of 23.6, 38.2, 50.0 and 61.8 It adapts to any temporality, be it for scalping or intraday. works for forex markets, all pairs It is used for synthetic index markets, all pairs great for boom and crash!
50+ Candlestick Patterns, Simulated Trading Results, Top Five Performers Candle Analysis extends Candlesticks Pattern Analysis by not only identifying Patterns but also recording the Past Performance of the Patterns. What it Does:- Identifies and plots results on chart Displays Top Patterns for both Bullish and Bearish type.  Log can be printed in experts tab to see Simulated Trading results Displays All or Selected Patterns Alerts on Pattern formation More detailed information in   Blog
Sayı dizilerinden birine "Orman Yangını Dizisi" denir. En güzel yeni dizilerden biri olarak kabul edildi. Başlıca özelliği, bu dizinin lineer trendlerden, hatta en kısa olanlardan kaçınmasıdır. Bu göstergenin temelini oluşturan bu özelliktir. Bir finansal zaman serisini analiz ederken, bu gösterge tüm olası trend seçeneklerini reddetmeye çalışır. Ve ancak başarısız olursa, bir trendin varlığını tanır ve uygun sinyali verir. Bu yaklaşım, yeni trendlerin başladığı anların doğru bir şekilde belirl
US30NinjaMT5
Satyaseelan Shankarananda Moodley
US30 Ninja is a 5 minute scalping indicator that will let know you when there is a trade set up (buy or sell). Once the indicator gives the trade direction, you can open a trade and use a 30 pip stop loss and a 30 pip to 50 pip take profit. Please trade at own own risk. This indicator has been created solely for the US30 market and may not yield positive results on any other pair. 
VWAP Daily
Anton Polkovnikov
Weighted average price indicator or VWAP. The well-known standard VWAP with the beginning of the day is added with the function of selecting the periodization. It can be calculated both every day and on other periods. Also the indicator allows to exclude the volume from the calculation, which will allow using it on the cryptocurrencies and forex. There is an alert for a VWAP price crossing. There are 1 and 2 standard deviation. Settings: Volume: turning volume on and off in the calculation mecha
The indicator is designed for pair trading with 2 highly correlated instruments.  Indicator charts can be displayed as lines or histograms. There is an MTF mode, the maximum and minimum deltas for the calculated number of bars are displayed with a check for a specified minimum value. It is possible to enable the calculation of trade operations with checking the current correlation coefficient for the minimum specified, the current delta in points or percent of the maximum (minimum) delta and
Welcome to the Ultimate Harmonic Patterns recognition indicator that is focused to detect advanced patterns. The Gartley pattern, Bat pattern, and Cypher pattern  are popular technical analysis tools used by traders to identify potential reversal points in the market. Our Ultimate Harmonic Patterns recognition Indicator is a powerful tool that uses advanced algorithms to scan the markets and identify these patterns in real-time. With our Ultimate Harmonic Patterns recognition Indicator, you
LevelPAttern MT5 is a technical indicator based on the daily levels and Price Action patterns. The indicator is based on the standard ZigZag indicator + reversal candlestick pattens, such as Star, Hammer (also knows as Pin bar), Engulfing and others. The indicator generates audio and text notifications when a pattern is formed and a level is touched. It also supports sending email and push notifications. Indicator operation features It is suitable for working with any CFD and FOREX trading ins
Breakeven Price MT5
Vladimir Chiosa
5 (1)
Nowadays a lot of traders need to open more positions for the same pair, because one position is not usually the best possible position. Thus a lot of trades are accumulated, sometimes with different lot sizes, and it is not easy to calculate the breakeven price of all opened positions. For solving this issue the Breakeven Price indicator was created. Breakeven Price is an MT5 indicator which calculates real time the breakeven price of all Buy & Sell positions opened by trader or EAs. It shows r
This is a multi frame stochastic indicator, you can attach any time frame of stoch indicator on one chart. It is very useful if you like to check multi time frame stoch data. If you are interested in EA,click below links to take a look: https://www.mql5.com/en/market/product/80170 https://www.mql5.com/en/market/product/81136 How to use: > Atach the first time frame you want on to the currency pair's chart > Atach the second time frame you want on to the currency pair's   chart > Atach the thir
FREE
Bu ürünün alıcıları ayrıca şunları da satın alıyor
Atomic Analyst MT5
Issam Kassas
3.64 (11)
Öncelikle belirtmek gerekir ki bu Ticaret Göstergesi Yeniden Çizim Yapmaz, Gecikmez ve Gecikme Göstermez, bu da hem manuel hem de robot ticareti için ideal hale getirir. Atom Analisti, Piyasada Daha İyi Bir Avantaj Bulmak İçin Fiyatın Gücünü ve Momentumunu Kullanan PA Fiyat Hareketi Göstergesidir. Gürültüleri ve Yanlış Sinyalleri Kaldırmaya ve Ticaret Potansiyelini Artırmaya Yardımcı Olan Gelişmiş Filtrelerle Donatılmıştır. Birden fazla katmanlı karmaşık göstergeler kullanarak, Atom Analisti
Öncelikle, bu Ticaret Sistemi'nin Non-Repainting, Non-Redrawing ve Non-Lagging Göstergesi olduğunu vurgulamak önemlidir, bu da hem manuel hem de robot ticareti için ideal hale getirir. "Smart Trend Trading System MT5", yeni ve deneyimli tüccarlar için özelleştirilmiş kapsamlı bir ticaret çözümüdür. 10'dan fazla premium göstergeyi birleştiriyor ve 7'den fazla sağlam ticaret stratejisi sunuyor, bu da çeşitli piyasa koşulları için esnek bir seçim yapar. Trend Takip Stratejisi: Trendleri etkili bir
Quantum Trend Sniper
Bogdan Ion Puscasu
5 (37)
Tanıtım       Kuantum Trend Keskin Nişancı Göstergesi   , trend tersine dönmeleri belirleme ve ticaret yapma şeklinizi değiştiren çığır açan MQL5 Göstergesi! 13 yılı aşkın ticaret tecrübesine sahip deneyimli tüccarlardan oluşan bir ekip tarafından geliştirilmiştir.       Kuantum Trend Keskin Nişancı Göstergesi       trend dönüşlerini son derece yüksek doğrulukla belirlemenin yenilikçi yolu ile ticaret yolculuğunuzu yeni zirvelere taşımak için tasarlanmıştır. ***Kuantum Trend Keskin Nişancı Gö
Trend Screener Pro MT5
STE S.S.COMPANY
4.89 (61)
Trend Göstergesi, Trend Alım Satım ve Filtreleme için Çığır Açan Benzersiz Çözüm, Tüm Önemli Trend Özellikleriyle Tek Bir Araç İçinde Yerleştirildi! Forex, emtialar, kripto para birimleri, endeksler ve hisse senetleri gibi tüm sembollerde/araçlarda kullanılabilen %100 yeniden boyamayan çoklu zaman çerçevesi ve Çoklu para birimi göstergesidir. Trend Screener, grafikte noktalarla ok trend sinyalleri sağlayan etkili bir trend trend göstergesidir. Trend analizörü göstergesinde bulunan özellikler: 1.
FX Volume MT5
Daniel Stein
4.94 (17)
Sabah Brifingimiz aracılığıyla ayrıntılar ve ekran görüntüleri ile günlük piyasa güncellemenizi alın burada mql5 ve on Telegram ! FX Volume, bir brokerin bakış açısından piyasa duyarlılığı hakkında GERÇEK bir fikir veren İLK ve TEK hacim göstergesidir. COT raporlarından çok daha hızlı bir şekilde, brokerlar gibi kurumsal piyasa katılımcılarının Forex piyasasında nasıl konumlandıklarına dair harika bilgiler sağlar. Bu bilgileri doğrudan grafiğinizde görmek, ticaretiniz için gerçek oyun değiştir
FX Power MT5 NG
Daniel Stein
5 (4)
Sabah Brifingimiz burada mql5 ve on Telegram! FX Power MT5 NG , uzun zamandır çok popüler olan döviz gücü ölçerimiz FX Power'ın yeni neslidir. Peki bu yeni nesil güç ölçer ne sunuyor? Orijinal FX Power hakkında sevdiğiniz her şey PLUS GOLD/XAU güç analizi Daha da hassas hesaplama sonuçları Ayrı ayrı yapılandırılabilir analiz dönemleri Daha da iyi performans için özelleştirilebilir hesaplama limiti Özel çokluDaha fazlasını görmek isteyenler için örnek ayarlar Her grafikte en sevdiğiniz renkler i
Öncelikle, bu Ticaret Aracının Non-Repainting, Non-Redrawing ve Non-Lagging Gösterge olduğunu vurgulamakta fayda var, bu da onu profesyonel ticaret için ideal hale getiriyor. Akıllı Fiyat Hareketi Kavramları Göstergesi, hem yeni hem de deneyimli tüccarlar için çok güçlü bir araçtır. İleri ticaret fikirlerini, Inner Circle Trader Analizi ve Smart Money Concepts Ticaret Stratejileri gibi 20'den fazla kullanışlı göstergeyi bir araya getirerek bir araya getirir. Bu gösterge, büyük kurumların tica
Advanced Supply Demand MT5
Bernhard Schweigert
4.53 (15)
Herhangi bir Acemi veya Uzman Tüccar için En İyi Çözüm! Bu gösterge benzersiz, yüksek kaliteli ve uygun fiyatlı bir ticaret aracıdır çünkü bir dizi tescilli özelliği ve yeni bir formülü bir araya getirdik. Bu güncelleme ile çift zaman dilimi dilimlerini gösterebileceksiniz. Yalnızca daha yüksek bir TF gösteremeyeceksiniz, aynı zamanda TF grafiğini ve ARTIK daha yüksek TF'yi de gösterebileceksiniz: YUVARLAK BÖLGELERİ GÖSTERMEK. Tüm Arz Talebi tüccarları buna bayılacak. :) Önemli Bilgiler Açıkland
RelicusRoad Pro MT5
Relicus LLC
4.81 (21)
Şimdi 147 $ (birkaç güncellemeden sonra 499 $ 'a yükseliyor) - Sınırsız Hesaplar (PC'ler veya Mac'ler) RelicusRoad Kullanım Kılavuzu + Eğitim Videoları + Özel Discord Grubuna Erişim + VIP Durumu PİYASAYA BAKMAK İÇİN YENİ BİR YOL RelicusRoad, forex, vadeli işlemler, kripto para birimleri, hisse senetleri ve endeksler için dünyanın en güçlü ticaret göstergesidir ve yatırımcılara kârlı kalmaları için ihtiyaç duydukları tüm bilgileri ve araçları sağlar. Başlangıç ​​seviyesinden ileri seviyey
XQ Indicator MetaTrader 5
Marzena Maria Szmit
5 (1)
Step into the realm of Forex trading with confidence and precision using XQ, a cutting-edge Forex indicator designed to elevate your trading game to unprecedented heights. Whether you're a seasoned trader or just stepping into the world of currency exchange, XQ Forex Indicator empowers you with the insights and signals needed to make informed trading decisions. The signal conditions are a combination of three indicators, and XQ Forex Indicator only display  medium and long-term trends . The ind
The Volume by Price Indicator for MetaTrader 5 features Volume Profile and Market Profile TPO (Time Price Opportunity). Get valuable insights out of currencies, equities and commodities data. Gain an edge trading financial markets. Volume and TPO histogram bar and line charts. Volume Footprint charts. TPO letter and block marker charts including split structures. Versatile segmentation and compositing methods. Static, dynamic and flexible ranges with relative and/or absolute visualizations. Lay
Tanıtım       Quantum Breakout PRO   , Breakout Bölgeleri ile ticaret yapma şeklinizi değiştiren çığır açan MQL5 Göstergesi! 13 yılı aşkın ticaret tecrübesine sahip deneyimli tüccarlardan oluşan bir ekip tarafından geliştirilmiştir.       Kuantum Breakout PRO       yenilikçi ve dinamik koparma bölgesi stratejisiyle ticaret yolculuğunuzu yeni zirvelere taşımak için tasarlanmıştır. Kuantum Breakout Göstergesi, size 5 kar hedefi bölgesi ile kırılma bölgelerinde sinyal okları ve kırılma kutusuna
Top indicator for MT5   providing accurate signals to enter a trade without repainting! It can be applied to any financial assets:   forex, cryptocurrencies, metals, stocks, indices .  Watch  the video  (6:22) with an example of processing only one signal that paid off the indicator! MT4 version is here It will provide pretty accurate trading signals and tell you when it's best to open a trade and close it. Most traders improve their trading results during the first trading week with the help of
ICT, SMC, SMART MONEY CONCEPTS, SMART MONEY, Smart Money Concept, Support and Resistance, Trend Analysis, Price Action, Market Structure, Order Blocks, BOS/CHoCH,   Breaker Blocks ,  Momentum Shift,   Supply&Demand Zone/Order Blocks , Strong Imbalance,   HH/LL/HL/LH,    Fair Value Gap, FVG,  Premium  &   Discount   Zones, Fibonacci Retracement, OTE, Buy Side Liquidity, Sell Side Liquidity, BSL/SSL Taken, Equal Highs & Lows, MTF Dashboard, Multiple Time Frame, BigBar, HTF OB, HTF Market Structure
AW Trend Predictor MT5
AW Trading Software Limited
4.76 (54)
Tek bir sistemde trend ve kırılma seviyelerinin kombinasyonu. Gelişmiş bir gösterge algoritması piyasa gürültüsünü filtreler, trendi, giriş noktalarını ve olası çıkış seviyelerini belirler. Gösterge sinyalleri, sinyal geçmişinin etkinliğini gösteren en uygun enstrümanların seçilmesine izin veren bir istatistiksel modüle kaydedilir. Gösterge Kâr Al ve Zararı Durdur işaretlerini hesaplar. Kılavuz ve talimatlar ->   BURAYA   / MT4 versiyonu ->   BURAYA Gösterge ile nasıl ticaret yapılır: Trend Pre
Auto Order Block with break of structure based on ICT and Smart Money Concepts Futures Break of Structure ( BoS )             Order block ( OB )            Higher time frame Order block / Point of Interest ( POI )    shown on current chart           Fair value Gap ( FVG ) / Imbalance   ,  MTF      ( Multi Time Frame )    Volume Imbalance     ,  MTF          vIMB Gap’s Equal High / Low’s     ,  MTF             EQH / EQL Liquidity               Current Day High / Low           HOD /
Blahtech Supply Demand MT5
Blahtech Limited
4.57 (14)
Was: $299  Now: $99   Supply Demand uses previous price action to identify potential imbalances between buyers and sellers. The key is to identify the better odds zones, not just the untouched ones. Blahtech Supply Demand indicator delivers functionality previously unavailable on any trading platform. This 4-in-1 indicator not only highlights the higher probability zones using a multi-criteria strength engine, but also combines it with multi-timeframe trend analysis, previously confirmed swings
Gann Kare Göstergesi, W.D. Gann tarafından yazılan "Piyasa Tahminleri için Matematiksel Formül" makalesine dayalı güçlü bir piyasa analizi aracıdır. Bu araç, piyasa analizi için matematiksel ve Gann teorilerini kullanarak hassas analizler gerçekleştirir. 144, 90, 52 karelerini ve ayrıca 9 karesini kullanır. Ayrıca, ın 9 karesi ve bu kareyle ilişkili kanallar ve yıldız modelleri için yöntemini içerir. Kullanıcı Kılavuzu ve Uygulama: Bu göstergeleri kullanmadan önce, kullanıcı kılavuzunu okumanız
TrendMaestro5
Stefano Frisetti
note: this indicator is for METATRADER4, if you want the version for METATRADER5 this is the link:  https://www.mql5.com/it/market/product/108106 TRENDMAESTRO recognizes a new TREND in the bud, he never makes mistakes. The certainty of identifying a new TREND is priceless. DESCRIPTION TRENDMAESTRO identifies a new TREND in the bud, this indicator examines the volatility, volumes and momentum to identify the moment in which there is an explosion of one or more of these data and therefore the mome
Fiyat tersine döndükçe ve geri çekildikçe piyasa yapısından elde edilen kâr değişir. Piyasa yapısını tersine çevirme uyarısı göstergesi, bir trendin veya fiyat hareketinin ne zaman tükenmeye yaklaştığını ve tersine dönmeye hazır olduğunu tanımlar. Genellikle bir geri dönüş veya büyük bir geri çekilme meydana gelmek üzereyken meydana gelen piyasa yapısındaki değişiklikler konusunda sizi uyarır. Gösterge, olası bir tükenme noktasının yakınında her yeni yüksek veya düşük oluştuğunda, başlangıçta
Trend Line Map Pro MT5
STE S.S.COMPANY
4.67 (9)
Trend Line Map indicator is an addons for   Trend Screener Indicator . It's working as a scanner for all signals generated by Trend screener ( Trend Line Signals ) . It's a Trend Line Scanner based on Trend Screener Indicator.  If you don't have Trend Screener Pro Indicator,   the Trend Line Map Pro will not work.     LIMITED TIME OFFER : Trend Line Map Indicator is available for only 50 $ and lifetime. ( Original price 125$ ) By accessing to our MQL5 Blog,  you can find all our premium indica
TrendLine PRO MT5
Evgenii Aksenov
4.78 (49)
The Trend Line PRO indicator is an independent trading strategy. It shows the trend change, the entry point to the transaction, as well as automatically calculates three levels of Take Profit and Stop Loss protection Trend Line PRO is perfect for all Meta Trader symbols: currencies, metals, cryptocurrencies, stocks and indices Advantages of Trend Line PRO Never redraws its signals The possibility of using it as an independent strategy It has three automatic levels Take Profit and Stop Loss lev
Owl Smart Levels MT5
Sergey Ermolov
4.47 (36)
MT4 versiyonu  |  FAQ Owl Smart Levels Indicator , Bill Williams'ın gelişmiş fraktalları , piyasanın doğru dalga yapısını oluşturan Valable ZigZag ve kesin giriş seviyelerini gösteren Fibonacci seviyeleri gibi popüler piyasa analiz araçlarını içeren tek gösterge içinde eksiksiz bir ticaret sistemidir. pazara ve kar elde edilecek yerlere. Stratejinin ayrıntılı açıklaması Gösterge ile çalışma talimatı Baykuş Yardımcısı ticaretinde Danışman Yardımcısı Kullanıcıların özel sohbeti -> Satın aldıktan
TPSpro TRENDPRO  - is a trend indicator that automatically analyzes the market and provides information about the trend and each of its changes, as well as giving signals for entering trades without redrawing! The indicator uses each candle, analyzing them separately. referring to different impulses - up or down impulse. Exact entry points into transactions for currencies, crypto, metals, stocks, indices!  -  Version MT4                  DETAILED DESCRIPTION        /       TRADING SETUPS       
Gartley Hunter Multi
Siarhei Vashchylka
5 (5)
Gartley Hunter Multi - An indicator for searching for harmonic patterns simultaneously on dozens of trading instruments and on all classic timeframes: (m1, m5, m15, m30, H1, H4, D1, Wk, Mn). Manual (Be sure to read before purchasing) | Version for MT4 Advantages 1. Patterns: Gartley, Butterfly, Shark, Crab. Bat, Alternate Bat, Deep Crab, Cypher 2. Simultaneous search for patterns on dozens of trading instruments and on all classic timeframes 3. Search for patterns of all possible sizes. Fr
Was: $249  Now: $99   Market Profile defines a number of day types that can help the trader to determine market behaviour. A key feature is the Value Area, representing the range of price action where 70% of trading took place. Understanding the Value Area can give traders valuable insight into market direction and establish the higher odds trade. It is an excellent addition to any system you may be using. Inspired by Jim Dalton’s book “Mind Over Markets”, this indicator is designed to suit the
Black Dragon indicator mt5
Ramil Minniakhmetov
4.82 (56)
Trend algılama göstergesi, herhangi bir stratejiyi tamamlayacak ve bağımsız bir araç olarak da kullanılabilir. ÖNEMLİ! Talimatlar ve bonus almak için satın alma işleminden hemen sonra benimle iletişime geçin!   Faydalar Kullanımı kolay; grafiği gereksiz bilgilerle aşırı yüklemez. Herhangi bir strateji için filtre olarak kullanma yeteneği. Hem kar elde etmek hem de zararı durdurmayı ayarlamak için kullanılabilen, yerleşik dinamik cupport ve direnç seviyeleri içerir. Mum kapandıktan sonra g
Golden Spikes Detector
Batsirayi L Marango
5 (1)
Golden Spikes Detector This indicator is based on an advanced strategy primarily for trading spikes on Boom and Crash Indices. Complex algorithms were implemented to detect high probability entries only. It alerts on potential Buy and Sell entries. To trade spikes on the Deriv or Binary broker, only take Buy Boom and Sell Cash alerts. It was optimised to be loaded on 5-minute timeframe although multiple timeframe analysis is done in the background. Features ·             Desktop pop up and sound
Matrix Arrow Indicator MT5
Juvenille Emperor Limited
5 (14)
Matrix Arrow Indicator MT5 ,   forex ,   emtialar ,   kripto   para birimleri ,   endeksler ,   hisse senetleri   gibi tüm sembollerde/araçlarda kullanılabilen   %100 yeniden boyamayan   çoklu zaman çerçevesi göstergesini izleyen benzersiz bir 10'u 1 arada trenddir.  Matrix Arrow Indicator MT5 , mevcut eğilimi erken aşamalarında belirleyecek ve aşağıdakiler gibi 10'a kadar standart göstergeden bilgi ve veri toplayacaktır: Ortalama Yönlü Hareket Endeksi (ADX) Emtia Kanal Endeksi (CCI) Klasik Hei
Bu, zirveleri ve dipleri değerlendirmek için net bir göstergedir ve Salınımlı piyasa için iyi çalışır. Promosyon fiyatı 49$ → 59$ özellikler üstleri ve dipleri yargılamada iyi Yeniden çizme yok, sürüklenme yok Hızlı hesaplama, gecikme yok Zengin hatırlatma modu Birden fazla parametre ve renk ayarlanabilir parametre "======== Ana ========" YüksekDüşükDönem1 = 9 YüksekDüşükPeriyod2 = 60 YüksekDüşükPeriyod3 = 34 YüksekDüşükEMAPeriyodu = 4 MASignalPeriod = 5 "======== Bildir ========" UseAler
Yazarın diğer ürünleri
WAPV Full MT5
Eduardo Da Costa Custodio Santos
## WAPV Full kullanarak profesyonelce çalışın ve takip edin büyük oyuncuların parası nerede Elinizde okumayı tek başına yapan bir araç olduğunu hayal edin. en iyi ticaret bölgelerini gösteren başlıca Piyasa Oyuncuları Fiyat ve Hacim analizine dayalı. WAPV Full, eksiksiz bir araçtır ve %100 R. Wyckoff'un operasyonel özelliklerine odaklanmıştır. Ticaret dalgalarındaki piyasa hareketlerini haritalamaya ek olarak, aynı zamanda Fiyat ve Hacmi okuyarak Pazar. Profesyonel Pazar, R. Wyckoff'un 3 yasası
WAPV Box Effort x Result
Eduardo Da Costa Custodio Santos
MT5 için WA_PV_BOX_EFFORT X SONUÇ WAPV Box Effort x Result Indicator, Paket Göstergeleri grubunun (Wyckoff Academy Wave Market) bir parçasıdır. MT5 için WAPV Box Effort x Result Indicator , fiyat ve hacmi okumanıza yardımcı olur. Okuması, çaba x sonucunun tanımlanmasına yardımcı olmaktan ibarettir. grafik tarafından oluşturulan dalgalarda. Kutu yeşil olduğunda MT5 için WAPV Kutusu Eforu x Sonuç Göstergesi, hacmin talebin lehine olduğu ve kutunun kırmızı olduğu anlamına gelir hacim arzdan yana. K
HLC bar MT5 Wyckoff
Eduardo Da Costa Custodio Santos
MT5 için "HLC_bar_MT5 Wyckoff" göstergesi, işlem sırasında analizi kolaylaştırmak için oluşturulmuştur. HLC Çubuğu Richard Wyckoff tarafından kullanılmıştır ve şu anda "VSA" operasyonlarında yaygın olarak kullanılmaktadır. Wyckoff, Yüksek, Düşük ve Yakın kullanmanın grafiği çok daha temiz ve analiz etmeyi kolaylaştırdığını buldu. "HLC_bar_MT5 Wyckoff" Göstergesi şunları sağlar: # Çubuk genişliğini değiştirin; # Çubuğu aynı renkte bırakın; # Ve aynı fiyattan açılan ve kapanan çubuğu vurgulayın. R
Segmented Volume MT5
Eduardo Da Costa Custodio Santos
MT5 Segmentli Hacim göstergesi , fiyat ve hacim analizi, VSA, VPA, Wyckoff Metodu ve Akıllı Para Sistemini kullanarak işlem yapanlara kolaylık sağlamak için oluşturulmuştur. Bölümlere ayrılmış hacim, herhangi bir Piyasada (Kripto, CFD, Forex, Vadeli İşlemler, Hisse Senetleri...) ve herhangi bir Grafik zamanında çalışır. Yorumunuzun ne kadar kolay olduğunu görün: #Yeşil: Hacim piyasa ortalamasının çok üzerinde #Koyu pembe: Ortalama hacimden daha büyük #Mavi: Pozitif normal hacim #Kırmızı: Negatif
Volume Zone Fractal
Eduardo Da Costa Custodio Santos
VZO Plus is an indicator that shows overbought and oversold regions based on traded volume. #When the indicator line is between -40 and -60 it is oversold #When the indicator line is between 40 and 60 it is overbought. Outside these regions, the market is following its natural path by inertia. Above the green line, it means that the market is positive, Another way to analyze the indicator is through divergence regions. When we have the bottom higher than the other in a downtrend or One botto
Jac Trend
Eduardo Da Costa Custodio Santos
MT5 için JAC Trend Göstergesi, piyasa trendinin kolay ve çevik bir şekilde tanımlanmasını kolaylaştırmak için oluşturulmuştur. # JAC Trend göstergesi yeşil olduğunda, yükseliş trendi için bir ön trendimiz var. #JAC Trend göstergesi Kırmızı olduğunda, düşüş trendi piyasası için bir ön trendimiz var. # JAC Trend göstergesi gri olduğunda, gücü olmayan bir yan pazarımız var. Bu şekilde, Piyasanın açık ve objektif bir şekilde gidebileceği tüm taraflara sahip olursunuz.
Z Score Plus MT5
Eduardo Da Costa Custodio Santos
Finansta Z Puanları, bir gözlemin değişkenliğinin ölçüleridir ve tüccarlar tarafından piyasa oynaklığının belirlenmesine yardımcı olmak için kullanılabilir. Z puanları, Traders'a bir puanın belirli bir veri kümesi için tipik mi yoksa atipik mi olduğunu söyler. Z puanları aynı zamanda analistlerin birden fazla veri kümesinden alınan puanları uyarlayarak birbirleriyle daha doğru bir şekilde karşılaştırılabilecek puanlar oluşturmasını sağlar. # Pratikte, sıfır noktalı ZScore'umuz ve ultra yüksek no
Trend Everest
Eduardo Da Costa Custodio Santos
Trend Everest MT5 göstergesi, karar vermeye yardımcı olan bir trend takip göstergesidir. Yardımcı olan ATR'nin ve ortalama gövdenin hesaplanmasına dayanır. Önemli bir konu, Trend Everest MT5 adayının yeniden boyamamasıdır, böylece daha fazla güvenle geriye dönük test yapabilirsiniz. Yeşil Yüksek Trend olduğunda Kırmızı düşüş trendi olduğunda. Piyasa fraktal olduğundan değil, bu nedenle grafik süresi ne kadar uzun olursa, iddialılık derecesi o kadar yüksek olur.
JAC Trend Color Candle
Eduardo Da Costa Custodio Santos
The indicator "JAC Trend Color Candle" for Meta Trader 5, was created to visually facilitate the trend for the trader. It is based on three parameters, which identifies the uptrend, downtrend and non-trending market. The colors are trader-configurable, and the average trader-configurable as well. trend parameters cannot be configured as they are the indicator's differential.
WAPV adh Supply and Demand
Eduardo Da Costa Custodio Santos
WAPV ADH Arz ve Talep göstergesi, (Wyckoff Academy Wave Market) adı verilen bir dizi göstergenin parçasıdır. WAPV ADH Arz ve Talep Göstergesi MT5 için alıcılar ve satıcılar arasında kazanan tarafı belirlemeyi amaçlamaktadır. Okuması çok basittir, yeşil çizgi kırmızı çizginin üzerinde olduğunda talep komuta altındadır, kırmızı çizgi yeşil çizginin üzerinde olduğunda arz komuta altındadır. Yeşil ve kırmızı çizgiler ne kadar pozitifse, hacim girişi o kadar yüksek, sıfıra veya negatife o kadar yakın
WAPV adh Supply and Demand Forex
Eduardo Da Costa Custodio Santos
WAPV ADH Arz ve Talep Forex Göstergesi, (Wyckoff Academy Wave Market) adlı bir dizi Göstergenin parçasıdır. WAPV ADH Forex Arz ve Talep Göstergesi MT5 için alıcılar ve satıcılar arasında kazanan tarafı belirlemeyi amaçlamaktadır. Okuması çok basittir, yeşil çizgi kırmızı çizginin üzerinde olduğunda talep komuta altındadır, kırmızı çizgi yeşil çizginin üzerinde olduğunda arz komuta altındadır. Yeşil ve kırmızı çizgiler ne kadar pozitifse, hacim girişi o kadar yüksek, sıfıra veya negatife o kadar
Wapv Price and volume
Eduardo Da Costa Custodio Santos
MT5 için WAPV Fiyat ve Hacim Göstergesi, (Wyckoff Academy Wave Market) ve (Wyckoff Academy Fiyat ve Hacim) araç setinin bir parçasıdır. MT5 için WAPV Fiyat ve Hacim Göstergesi, grafikteki hacim hareketini sezgisel bir şekilde görselleştirmeyi kolaylaştırmak için oluşturuldu. Bununla, piyasanın profesyonel bir ilgisinin olmadığı en yüksek hacim anlarını ve anları gözlemleyebilirsiniz. Piyasanın "akıllı para" hareketiyle değil, ataletle hareket ettiği anları belirleyin. Kullanıcı tarafından değişt
Weis Wave Double Side
Eduardo Da Costa Custodio Santos
MT5 için Weis Wave Bouble Yan Göstergesi, araç setinin bir parçasıdır (Wyckoff Academy Wave Market) MT5 için Weis Wave Bouble yan Göstergesi, David Weis tarafından oluşturulan halihazırda kurulmuş Weis Wave'e dayalı olarak oluşturulmuştur. Weis Wave Çift Taraflı göstergesi, piyasayı olduğu gibi dalgalar halinde okur 1900 yılında R. Wyckoff tarafından. Çaba x sonuç, neden ve sonuç ve arz ve talebi belirlemeye yardımcı olur. Diferansiyeli, sıfır ekseninin altında kullanılabilmesi ve daha da iyileş
Weis Wave Double Side Alert
Eduardo Da Costa Custodio Santos
MT5 için Weis Wave Bouble Yan Göstergesi, araç setinin bir parçasıdır (Wyckoff Academy Wave Market) MT5 için Weis Wave Bouble yan Göstergesi, David Weis tarafından oluşturulan halihazırda kurulmuş Weis Wave'e dayalı olarak oluşturulmuştur. Weis Wave Çift Taraflı göstergesi, R. Wyckoff'un 1900'de yaptığı gibi piyasayı dalgalar halinde okur. Çaba x sonuç, neden ve sonuç ve arz ve talebi belirlemeye yardımcı olur. Diferansiyeli, sıfır ekseninin altında kullanılabilmesi ve şunu gösteren bir koparma
VSA Candle Signal
Eduardo Da Costa Custodio Santos
MT5 için VSA Candle Signal, araç setinin (Wyckoff Academy Fiyat ve Hacim) bir parçasıdır. İşlevi, mum oluşumunda Fiyat ve Hacim ilişkisini belirlemektir. Oluşturulması, Fiyat ve Hacim analizinde bir öncü olan R.Wyckoff'un öncüllerine dayanmaktadır. MT5 için VSA Candle Signal, karar vermede yardımcı olur ve okumanızı bırakır daha net ve akıcı. Aşağıdaki resimlere bakın.
Force and Weakness Trading
Eduardo Da Costa Custodio Santos
The Force and Weakness Indicator for MT5 Forex is part of the (Wyckoff Academy Price and Volume) Toolkit The Force and Weakness Indicator for MT5 Forex was developed to identify the Strength and Weakness of volume in an accumulated way. Enabling the vision of a panorama between price and volume. The Indicator can be used as an oscillator and as a histogram. As usual it has all the premises of R. Wyckoff's three laws when put together with the price: Cause and Effect, Effort x Result and Supply a
WAPV Force and Weakness MT5
Eduardo Da Costa Custodio Santos
MT5 Real Volume için Kuvvet ve Zayıflık Göstergesi, (Wyckoff Academy Fiyat ve Hacim) araç setinin bir parçasıdır MT5 Real Volume için Kuvvet ve Zayıflık Göstergesi, hacmin Gücünü ve Zayıflığını toplu bir şekilde belirlemek için geliştirilmiştir. Fiyat ve hacim arasında bir panorama vizyonunun etkinleştirilmesi. Gösterge, bir osilatör ve bir histogram olarak kullanılabilir. Bir fantezi olarak, fiyatla bir araya getirildiğinde R. Wyckoff'un üç yasasının tüm önermelerine sahiptir: Sebep ve Etki, Ça
WAPV Weis Wave Chart Forex
Eduardo Da Costa Custodio Santos
MT5 için Weis Wave Chart Forex bir Fiyat ve Hacim göstergesidir. Fiyat ve Hacim okuması, Richard Demille Wyckoff tarafından oluşturulan üç yasaya dayalı olarak geniş çapta dağıtıldı: Arz ve Talep, Neden ve Etki ve Çabaya Karşı Sonuç. 1900'de R.Wyckoff, analizlerinde dalga grafiğini zaten kullanmıştı. Yıllar sonra, 1990 civarında, David Weis Otomatikleştirilmiş R. Wyckoff'un dalga grafiği ve bugün size David Weis'in dalga grafiğinin evrimini sunuyoruz. Varlıkta üretilen dalga ile ilgili Hacim mik
WAPV Weis Wave Chart MT5
Eduardo Da Costa Custodio Santos
MT5 için Weis Dalga Tablosu bir Fiyat ve Hacim göstergesidir. Fiyat ve Hacim okuması, Richard Demille Wyckoff tarafından oluşturulan üç yasaya dayalı olarak geniş çapta dağıtıldı: Arz ve Talep, Neden ve Etki ve Çabaya Karşı Sonuç. 1900'de R.Wyckoff, analizlerinde dalga grafiğini zaten kullanmıştı. Yıllar sonra, 1990 civarında, David Weis Otomatikleştirilmiş R. Wyckoff'un dalga grafiği ve bugün size David Weis'in dalga grafiğinin evrimini sunuyoruz. Varlıkta üretilen dalga ile ilgili Hacim miktar
WA Order Block FVG bos MT5
Eduardo Da Costa Custodio Santos
O  WA Order Block FVG bos MT5  é um indicador com base no estudo de SMC (Smart Money Concepts) criado pelo ICT Inner Circle Trader, eleplota no seu gráfico as informações de Order Blocks em 3 tempos gráficos diferentes, fair Value Gaps e Regiões de Liquidez além do BOS ( Break os Structures), tudo em um só indicador. Dessa forma você não precisa colocar essas informações de forma manual. Agora você tem tudo isso de forma automática em seu gráfico.
Filtrele:
İnceleme yok
İncelemeye yanıt