ON Trade Channels MT5
- Göstergeler
-
Abdullah Alrai
 All source codes for sell
. Feel free to reach out to us through direct messages or via Telegram at:
https://t.me/forex_manager - Sürüm: 1.0
- Etkinleştirmeler: 5
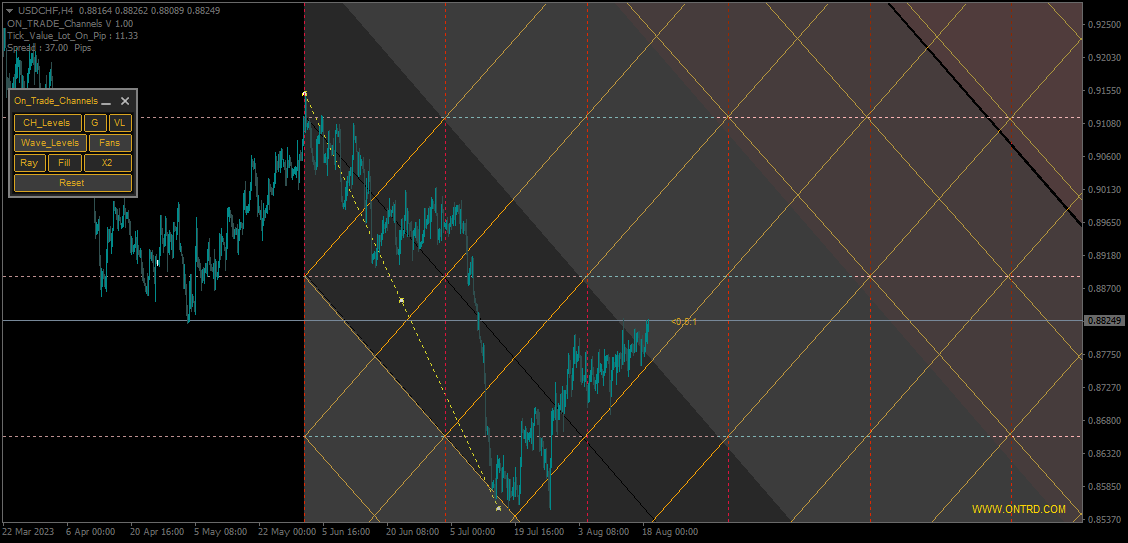
Bu araç sayesinde grafiklerinizde regresyon kanalını kontrol etme yeteneği elde edersiniz. Kanal seviyelerini, destek ve direnç seviyelerini sağlayacaktır. Ayrıca düzeltme dalgası seviyelerini sunar. Ayrıca, dolum ve ışın seçenekleri gibi kanalı doğrudan kontrol etme imkanını sağlayan bir kontrol paneli üzerinden kanalı yönetebilirsiniz. Ayrıca, farklı çiftlerle işlem yaparken daha iyi bir görünüm elde etmek için daha yüksek zaman dilimlerinden veri yükleyebilirsiniz.
Nasıl Kullanılır:
-
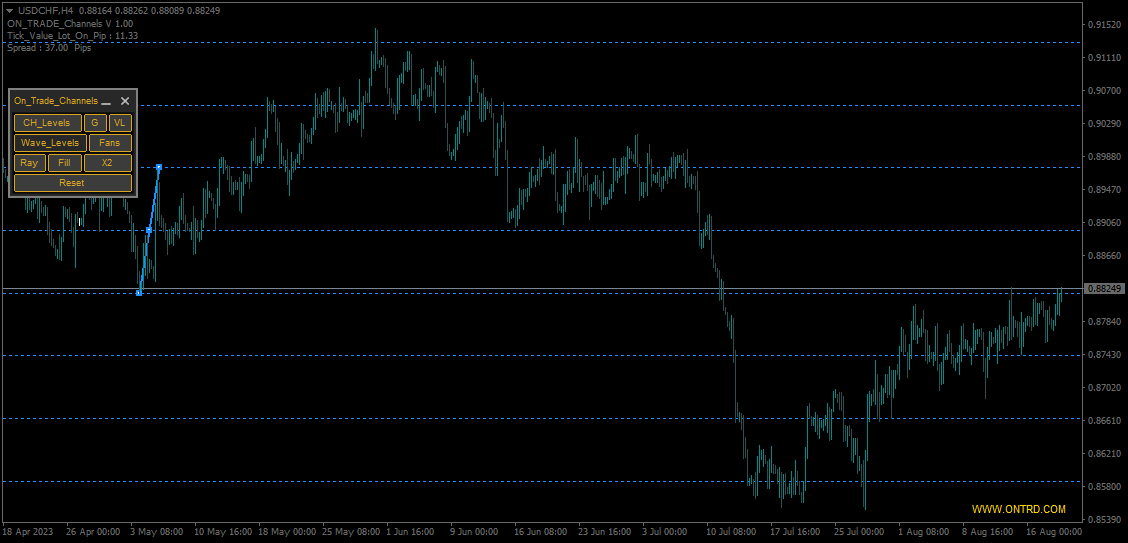
Trend Çizgisini Ayarlama: Bir dalganın hareketinin başlangıcına trend çizgisini yerleştirerek başlayın. Eğer trend yukarı yönlü ise, düşük noktaya yerleştirin. Eğer trend aşağı yönlü ise, yüksek noktaya yerleştirin.
-
Trend Çizgisini Bitirme: Eğer trend ayı piyasasıysa (aşağı yönlü), trend çizgisini son yüksek noktaya uzatın. Eğer trend boğa piyasasıysa (yukarı yönlü), trend çizgisini son düşük noktaya uzatın.
-
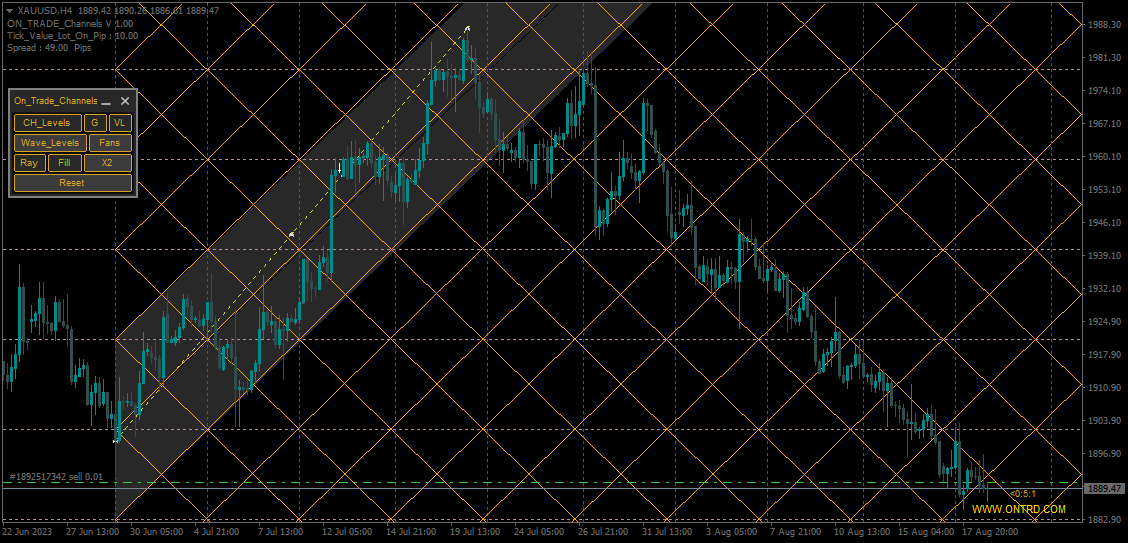
Kanal Seviyeleri Yöntemi: Kanal seviyeleri yöntemini etkinleştirerek, potansiyel giriş ve çıkış noktaları olarak hareket eden kanal seviyelerini görselleştirebilirsiniz. Yukarı yönlü bir trendde, üst kanal seviyesine yakın yerlerde satış düşünün. Aşağı yönlü bir trendde, alt kanal seviyesine yakın yerlerde alım düşünün.
-
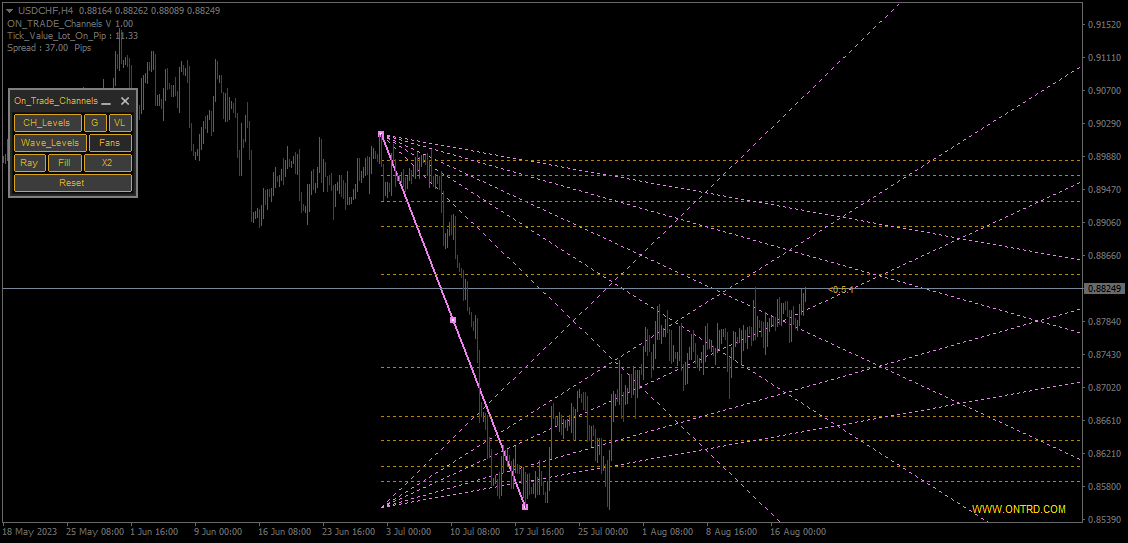
Düzeltme Dalga Seviyeleri: Düzeltme dalgaları ile etkileşime geçmek için düzeltme dalgasının başlangıcına trend çizgisi yerleştirin.
-
Hedef Belirleme: Kanalın merkezi, hem alım hem de satım pozisyonları için stratejik bir hedeftir.
Parametreler:
- Use_System_Theme: Sistem temasını etkinleştirme/devre dışı bırakma.
- Trends_Color: Ana trend kanalının rengini seçme.
- Channel_Color: Kanalın rengini seçme.
- Show_Center_CH_Levels: İkincil kanal seviyelerini etkinleştirme/devre dışı bırakma.
- Max_Ch_Levels: Maksimum kanal seviyesi sayısını ayarlama.
- Ch_Levels_Color: Kanal seviyelerinin rengini seçme.
- Verticals_Colors: Dikey kanal seviyelerinin rengini seçme.
- Max_Wave_Levels: Maksimum düzeltme dalga seviyesi sayısını ayarlama.
- Wave_Levels_Color: Düzeltme dalga seviyelerinin rengini seçme.
- Upper_Dupilcate_Color: Üst kopyalanmış kanalın rengini seçme.
- Lower_Duplicate_Color: Alt kopyalanmış kanalın rengini seçme.
- Fans_Color: Fanların rengini seçme.
- Show_Last_Candle_Counter: Mum zaman sayacını etkinleştirme/devre dışı bırakma.
- Candle_Counter_Color: Mum zaman sayacı metni rengini seçme.
Özetlemek gerekirse, bu gösterge, piyasa trendlerini analiz etmek ve bilinçli ticaret kararları almak için trader'lara kapsamlı bir araç seti sunar. Kanal seviyelerini, destek/direnç bölgelerini ve düzeltme dalgalarını vurgulama yeteneği, herhangi bir trader'ın cephaneliğine değerli bir katkı yapar. Bu göstergenin özelliklerini ve parametrelerini kullanarak, trader'lar fiyat dinamiklerini daha iyi anlayabilir ve ticaret stratejilerini geliştirebilirler.