ON Trade Numerology Station

User Manual Download link:

https://ontrd.com/our-books/

For all who are asking about indicator 

ON Trade Numerology Station

It obtain about 16 numerology strategies it make together completed unit control your trading .

Basic strategies to work with it are 3 strategies statistics about them are the following :

1. RBA levels success rate more then 95%.

2. FF more then 96% 

3.RBA SUN 98%

We will not say 100 % as they are ..

Ratio rates as following : 

1.Rba levels more then 1/3 to 1/6 .

2.FF MORE THEN 1/2 to 1/35 .

3. RBA SUN 1/1 to 1/5 .


All of other methods work like approvals/ define targets / define breakeven levels .


Usage of this tool isnt conplex like what you take first idea about it when you see it no it is so simple and you can use it directly after one day of training. 


We released many trial versions of it that end today and for who needs to have it you can contact us directly on our id 

When you request it we can make coaching for you untill you can using it .

We sent a lot of signals from it at last days on channel here or on our lives you can check all is clear 

There is orders which take sl and there os orders with so big targets that proof what we say above about ratios.

This product done after a lot of researches between me and mr Eng.rabie assaf  since 2007 .

If you want it tell me on private 

Eng. Abdullah 


for sure after buying it you will be trained on it about 2 to 3 days only no need for more and you will be able to work by your self 


Please if you tried it dont forgot to out here your comment with feedback about it on this post with a lot of thanks from us to you .


This indicator has a lot of numerology analyzing methods that can support your analyzes or can work as custom strategy by it self ..we will start to explain them one by one :


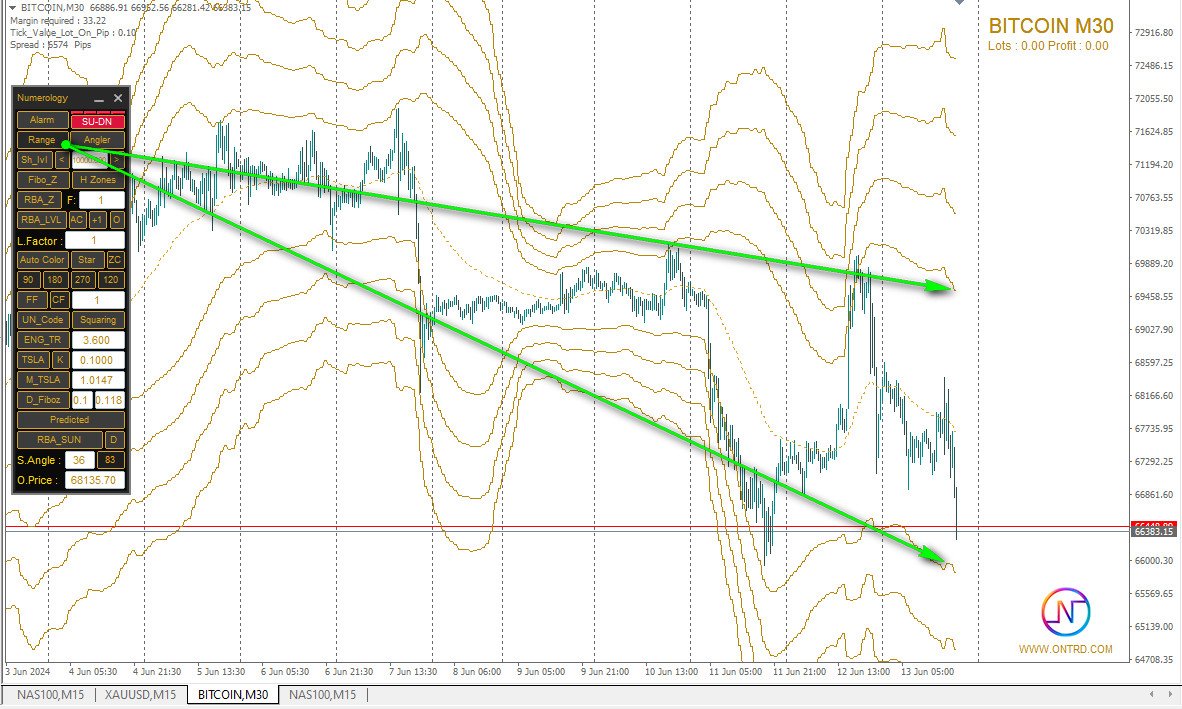
1-Range channel that draws the limits of daily movements to detect places of buy and places of sell .


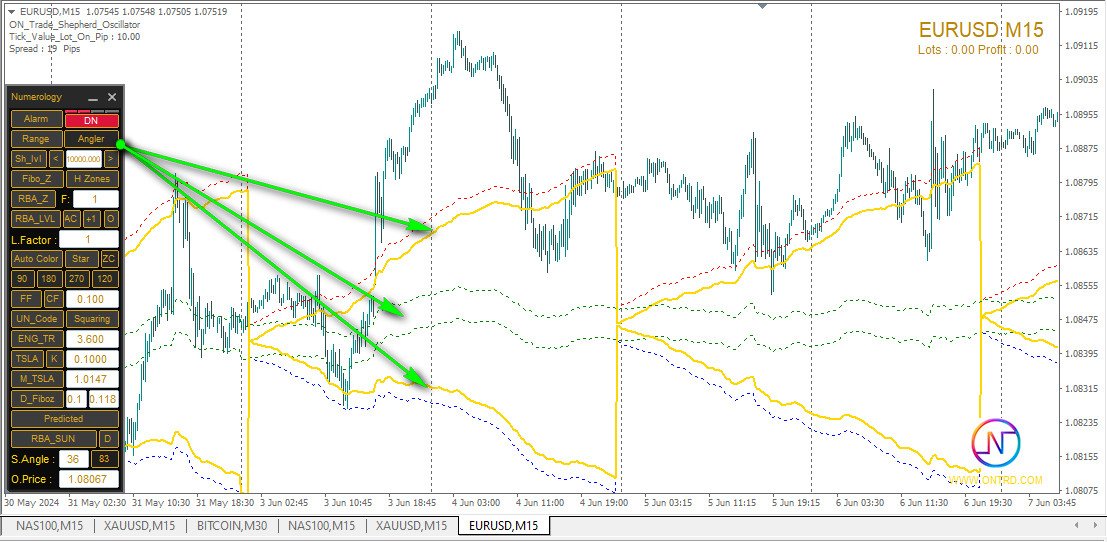
2- Angler will detect Dynamic numeral levels that result of time and price squaring with custom numeral method that works like support and resistant and will support your analyzes


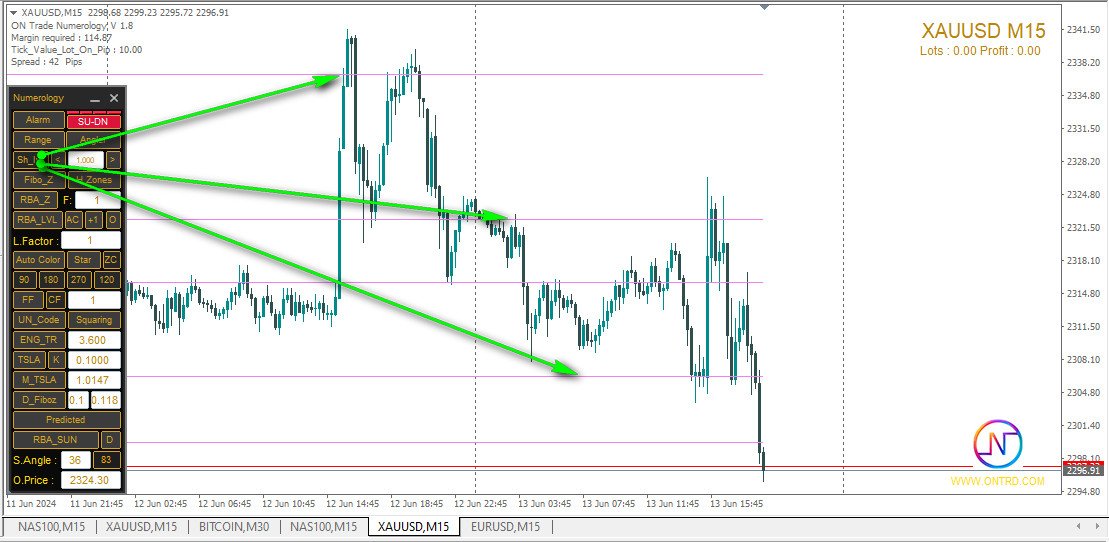
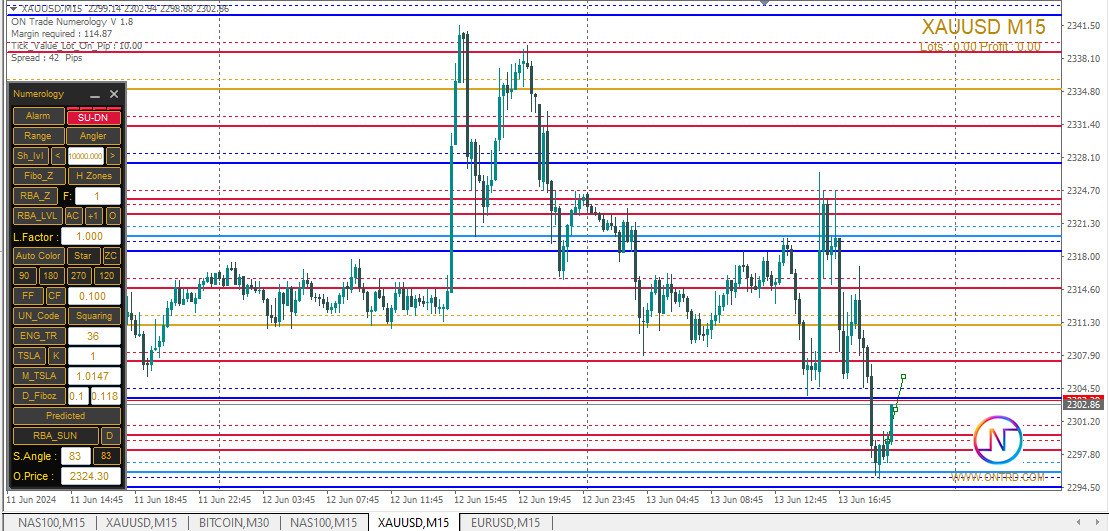
3- Shepherd Levels it is levels that work like support and resistance but they are the result of complicated numerology method and they are good to approve your entries on other methods like harmonic or supply and demand they will give you the right places of price reversing zone you can control spacing between the levels by adjusting factor as you see it compatible with chart movement speed .


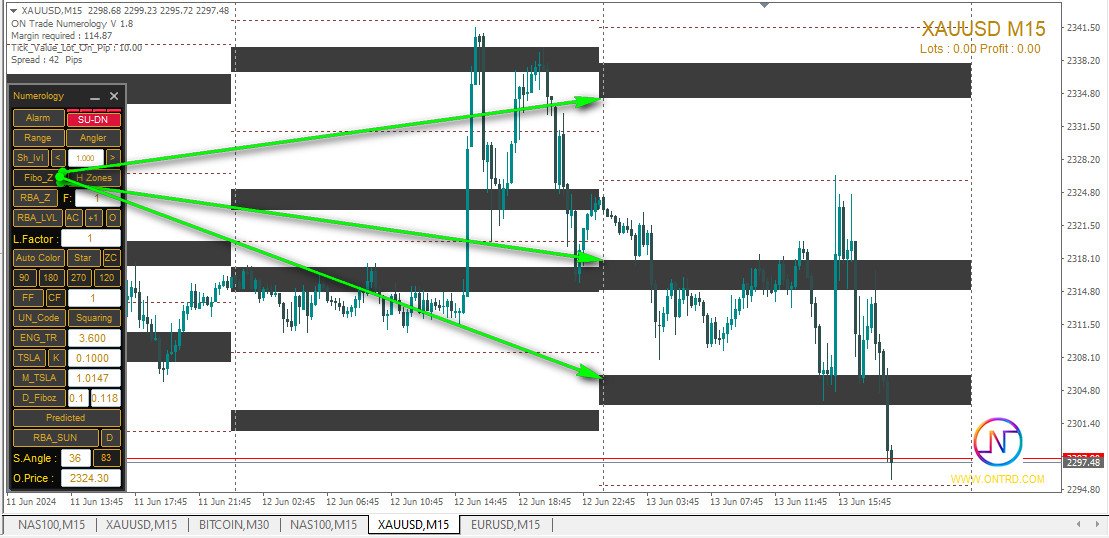
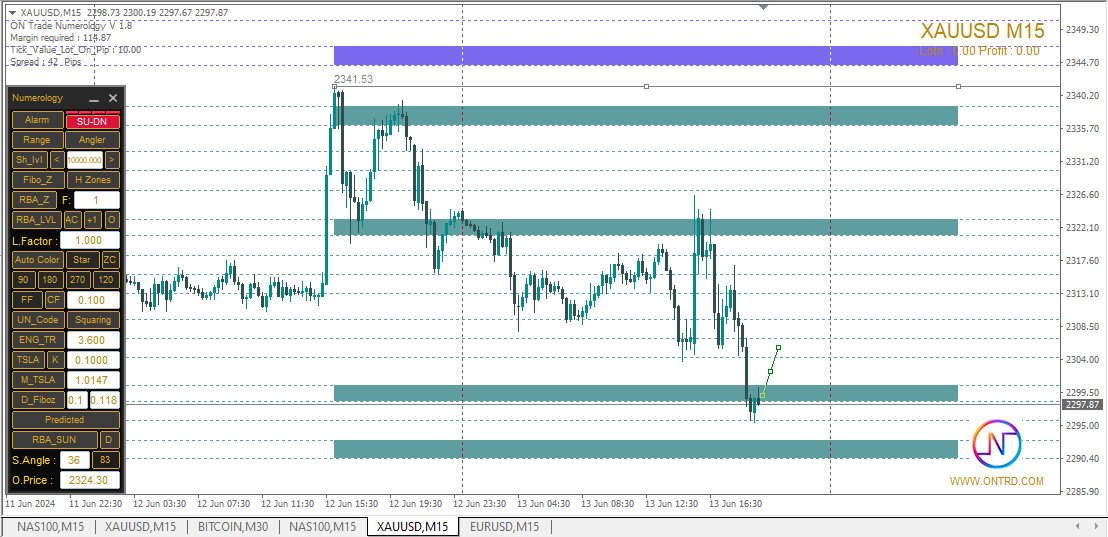
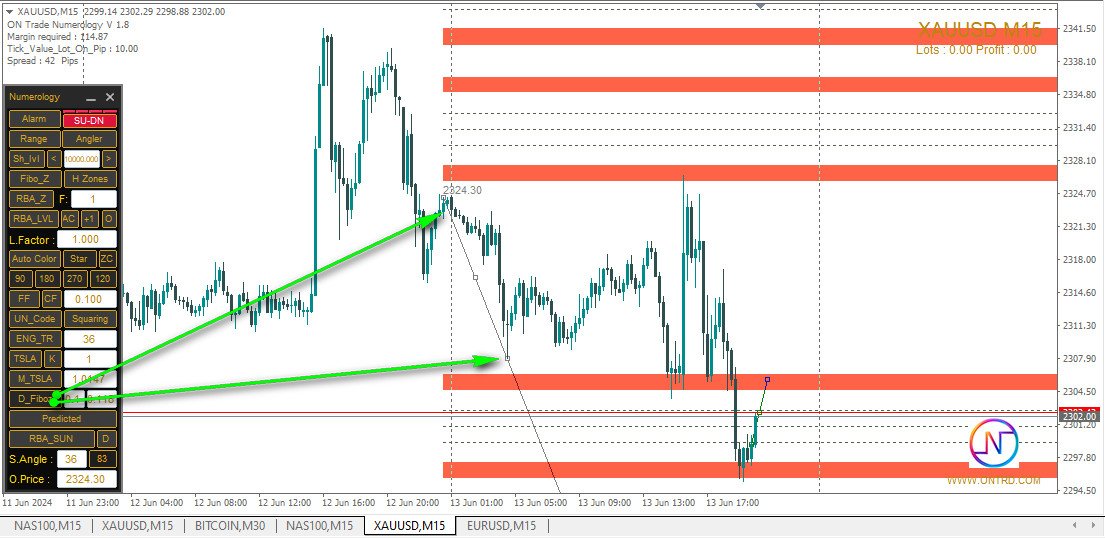
4- Fibo Zones this function will draw daily zones depending on adjusted fibo parameters this zones work fine alone or mixed with other strategy like supply and demand or square of nine levels they are suitable to work with this zones note working with this zones is as same as working with supply and demand .


5- The Hourly Zones will draw zones at specified times that obtained in settings that can be used as center of movement in day .


6- RBA Zones  this method will draw zones that can be controlled if its size by changing the factor value and this zones can work alone and can work with other methods also we can use it as martingale work with small lots on every zone it will give great profits


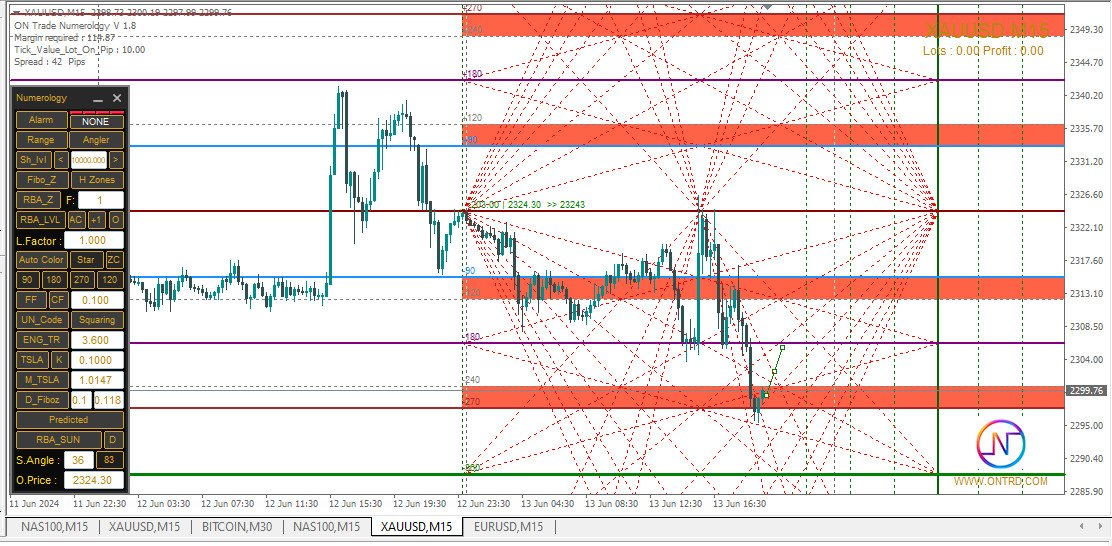
7 - RBA Levels this is so strong method that can work alone and can work mixed with any other analyze even if it is trend line ...

just turn on its button and press ac (Auto Calc) but put the price in the range of current day time and indicator will make all numeral calcs to move lines to its places or you can depend on daily open by just pressing o and indicator will move also every thing to its place .


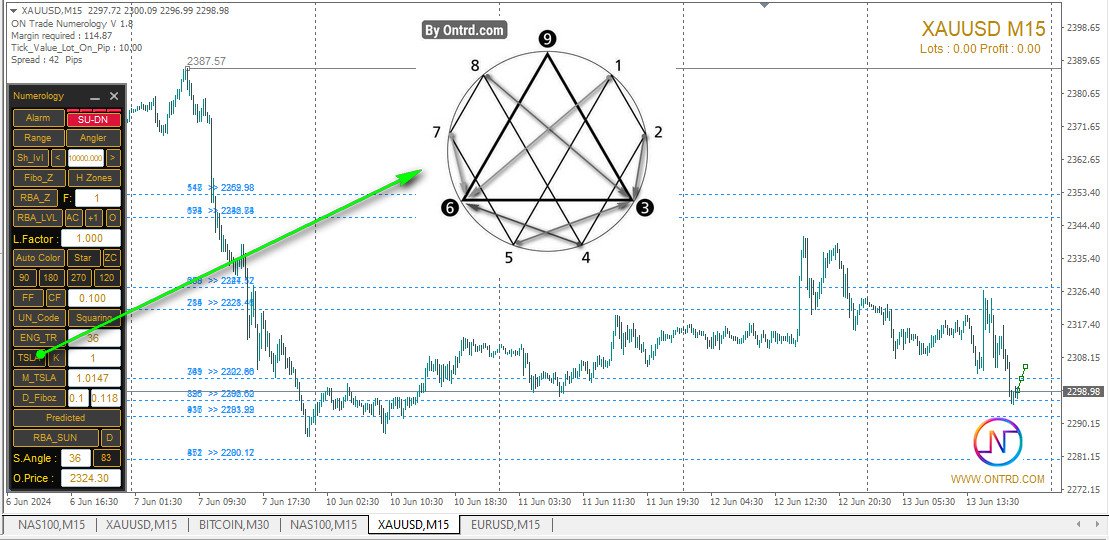
you can use the numerology star with this method because of its walls can work as support and resistance lines .. like this example


8 -  The FF Method is great tool can be used alone it has specific way to work with it you can ask me about it if you like to buy indicator  and it can be merged with range method and it will give great results .


9 - The Universal Code method is numerology support and resistance levels you can combine it with other methods for approval only .


10 - Squaring method one of the most greatest tools to predict the time of reverse depend on some easy rules can be used to support your analyze with it ..


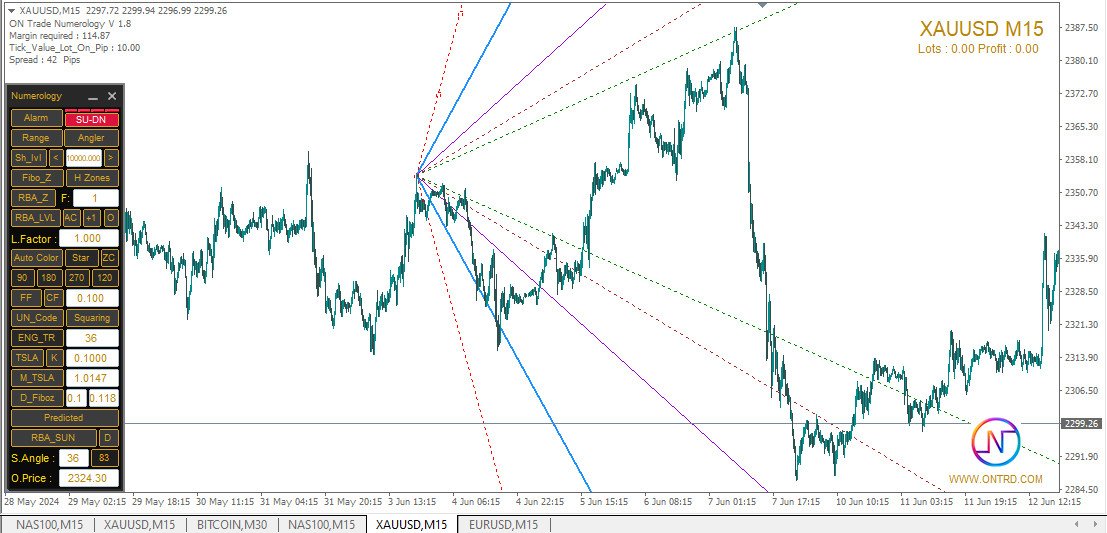
11- Engineering Trend is numeral trend that can be used to support your analyzes with it by use it with last peaks and leaks


12- Tesla Levels this method is the result of numerology calculations and analyzes on tesla circle and it is so effective on chart as you can see this photo as example


13 - Manual Tesla it works like you are turning the tesla disk by your hand onto the charts  it can be used alone or with range or with any other strategy


14- D_Fiboz Method will predict daily high and low levels ... i can also explain it for you it can be used combined with other method


15- Predicted this method will predict high and low depend on quantum numerology analyzes it is weak method but some times help combined with other method


16 - RBA_SUN this method use the sun angle to draw support and resistance levels can be used for scalping trading and it is strong strategy can be used alone or combined with other method ..
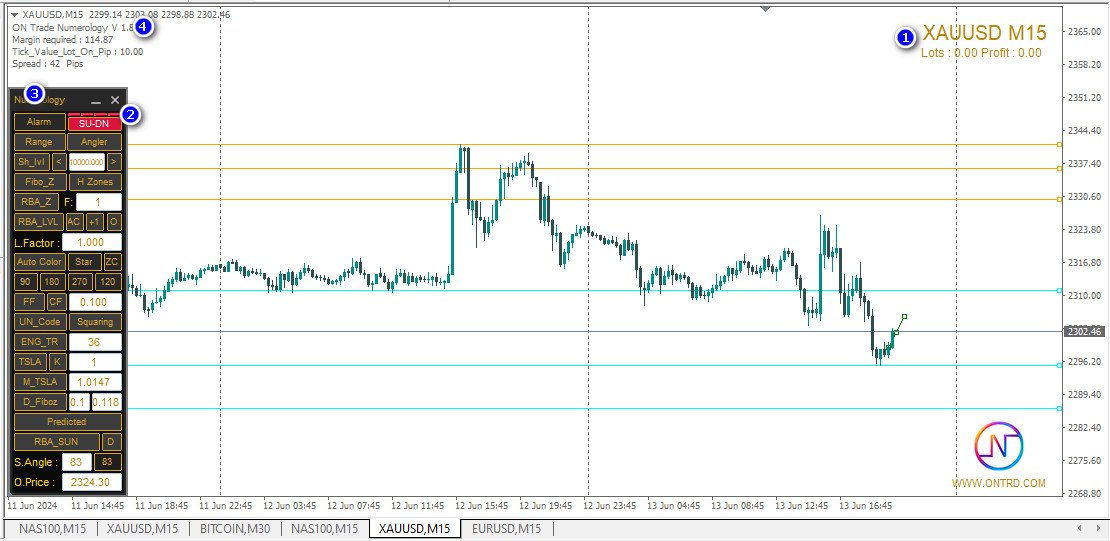

other functions

1- symbol name and profits with opened lots

2-trend now and its strength

3-alarm with 4 alarm lines can send notifications to phone or alert on platform

4- info about symbol spread and margin required .


Önerilen ürünler
BSA Indicator
Ahmet Metin Yilmaz
BSA indikatörü ZigZag bazlı bir indikatördür. Bu indikatör fiyatın geri dönüş seviyesini bulmakta kullanılır. Girdilerde mevcut risk oranı ve hesaplama timeframe ini kullanım tercihinize göre optimize ederek kullanabilirsiniz.  Düşük zaman dilimlerinde indikatör yeniden boyama yapabilir. Daha sağlıklı sonuçlar için uygulayacağınız grafiğe göre bir süre gözlem yaparak en az yeniden boyamayı tespit edebilirsiniz. 
Embark on the pinnacle of Binary Options evolution. Our indicator isn't just adaptive—it's relentless. Picture a ninja riding a serpent, shadowing its every move; that's how this tool trails the market trend, unwavering till the end. Built upon the foundational prowess of the Ichimoku indicator and honed with an array of fine-tuned oscillators, it epitomizes accuracy and precision. Dive deep without getting lost in the Ichimoku's intricacies—our indicator simplifies the process for you. Perhaps
This indicator is designed for scalping on low timeframes (M1-M15) in volatile markets like major forex pairs (e.g., EURUSD, GBPUSD). It generates non-repainting buy (green up arrow) and sell (red down arrow) signals based on EMA crossover confirmed by RSI momentum and MACD crossovers, minimizing false signals in ranging markets. How to Use: Attach the indicator to your MT4 chart. Look for arrows on the chart: Buy on green up arrow, Sell on red down arrow. Signals appear at the open of the new
This is an arrow indicator without a future function,developed based on the most advanced profit trading algorithms.It has the most innovative and advanced dual trend analysis module, as well as the latest and highly effective market trend prediction algorithm.Trends are your friends, and following larger trends can earn the maximum profit in foreign exchange. This indicator helps traders identify current trends and track them. Someone once made a profit of 10 times in a week by relying on it.No
Classic Fractals indicator for MT4, with additional Trendlines connecting the latest couples of fractals ( fractals are showing highest high, and lowest low on each period) Rules for trendlines: -if new top fractal is below the last one = new resistance line -if new bot fractal is above the last one = new support line -Trendlines can be hidden -Fractals can be hidden Fractal Period = can be both even or uneven number, as it is setting for half (one side) of the bars sequence for findin
Öncelikle, bu Ticaret Aracının Non-Repainting, Non-Redrawing ve Non-Lagging Gösterge olduğunu vurgulamakta fayda var, bu da onu profesyonel ticaret için ideal hale getiriyor. Çevrimiçi kurs, kullanıcı kılavuzu ve demo. Akıllı Fiyat Hareketi Kavramları Göstergesi, hem yeni hem de deneyimli tüccarlar için çok güçlü bir araçtır. İleri ticaret fikirlerini, Inner Circle Trader Analizi ve Smart Money Concepts Ticaret Stratejileri gibi 20'den fazla kullanışlı göstergeyi bir araya getirerek bir araya g
YK-Fibo Pivot Indicator: Trade Smarter with Fibonacci Pivot Points The YK-Fibo Pivot Indicator is a powerful technical analysis tool that combines the precision of Fibonacci retracements with the insights of Pivot Points. Whether you're a novice or seasoned trader, this indicator empowers you to spot profitable opportunities in the market with ease. Why Choose YK-Fibo Pivot? Pinpoint Support & Resistance: By calculating Fibonacci levels based on the previous day's high, low, and close prices, y
Bu gösterge, manuel ve otomatik yöntemlerle çizilen harmonik desenleri tespit edecektir. Lütfen görüşlerinizi ekleyin. Notlar: Bu gösterge bir kontrol paneline sahiptir ve her (grafik ve zaman dilimi) ayarını kaydedecektir. Daha fazla grafik alanı için onu küçültebilir ve diğer analiz araçlarıyla çalışmayı tercih ederseniz tüm gösterge verilerini gizlemek için kapatma düğmesini kullanabilirsiniz. Bu göstergenin ayarlarını değiştirirken Hareketli Ortalama veya Bollinger Bantları gibi göstergeler
Koala Supply Demand
Ashkan Hazegh Nikrou
5 (3)
MetaTrader 4 için Koala Arz Talep Göstergesi'ni tanıtıyoruz (İster olumlu ister olumsuz olsun, yorumlarınızı veya geri bildirimlerinizi paylaşmanızı öneririz, böylece diğer yatırımcılar da deneyimlerinizden faydalanabilir.) : Koala Supply Demand Göstergesi'ne hoş geldiniz. Bu göstergeler, kesintisiz arz ve talep bölgelerini tanımlamak için tasarlanmıştır. Bu gösterge, tüccarın piyasayı bölge alanları olarak görmesine yardımcı olabilir; fiyatın bazı güçlü bölgelere nasıl saygı gösterdiğini göreb
FREE
There are 8 types of this indicator. Consisted of 1. Bullish and Bearish Engulfing 2. Morning and Evening Star 3. Three Green Soldiers and Three Red Crows 4. Three Inside Up and Down 5. Three Outside Up and Down 6. Bullish and Bearish Harami 7. Tweezers Top and Bottom 8. Piercing and Dark cloud cover Signal Filter :: 1. The appearance of the candle stick 2. SMA 3. 2EMA :: EMA Fast and EMA Slow 4. RSI N otification :: 1. Via screen 2. Email 2. Phone For trading 1. Scaling 2. Binary options 3.
Forex Kiss
Olufemi Ogunremi
FOREX KISS is an indicator that picks out reversal/turning points , it is a combination of levels , clusters and volumes , works on all time frame and all instruments. While doing the paper works which took me 5 years, my aim was to build something that will give me consistent profit all over again while keeping it simple and stupid. My hope that this indicator will bring you confidence and precision.
This is the complete REX package. It consists of the lite, pro and ULTRA version.  Perfect for beginners and intermediates. REX complete is 100% non repaint. The strategy is based on a mix of different strategies, statistics, including pivot points, oscillators and patterns.  As the trading idea consists of a variety of some classic indicators like Momentum, Williams Percent Range, CCI, Force Index, WPR, DeMarker, CCI, RSI and Stochastic, it is clear that the fundamental indicators have being u
It will be the best tool for you to make a profit! Through unique algorithms You're going to see an amazing amount of right trading signals Make huge profits every day and realize more possibilities!   Like the car no money to buy it, the love of the girls dare not to pursue?Or the credit card bill is not paid, the rent does not have the extra money to settle?Or are you fed up with being bossed around by your boss and Hope to get more people's respect?Can't afford to buy the things you want ? wa
BinaryScalping
Andrey Spiridonov
BinaryScalping is a professional indicator for trading binary options and scalping. The algorithm of the indicator is based on the calculation of pivot points for each time period separately, the location of the price of the trading instrument relative to the pivot points is analyzed and the probability of a trading operation is calculated. The indicator has a built-in filter of trading signals based on the global trend. The indicator is installed in the usual way and works with any trading inst
Towers
Yvan Musatov
Towers - Trend indicator, shows signals, can be used with optimal risk ratio. It uses reliable algorithms in its calculations. Shows favorable moments for entering the market with arrows, that is, using the indicator is quite simple. It combines several filters to display market entry arrows on the chart. Given this circumstance, a speculator can study the history of the instrument's signals and evaluate its effectiveness. As you can see, trading with such an indicator is easy. I waited for an a
BinaryUniversal is a signal indicator for binary options and Forex. In its work, the indicator uses a complex algorithm for generating signals. Before forming a signal, the indicator analyzes volatility, candlestick patterns, important support and resistance levels. The indicator has the ability to adjust the accuracy of the signals, which makes it possible to apply this indicator for both aggressive and conservative trading. The indicator is set in the usual way, it works on any time period and
Bu gösterge, Elliott dalga teorisi ile iki şekilde çalışır: Otomatik Çalışma: Bu modda gösterge, Elliott dalga teorisine uygun olarak grafikteki beş hareket dalgasını otomatik olarak tespit edecek ve tahminlerde bulunacak, potansiyel ters dönüş bölgelerini belirleyecektir. Ayrıca, önemli gelişmeler hakkında tüccarları uyarılar ve bildirimlerle bilgilendirebilme yeteneğine sahiptir. Bu otomatik işlev, Elliott dalga desenlerinin tanımlanması ve analiz sürecini basit hale getirir. Manuel Çalışma: B
OFFER! OFFER! NEXT Price Will be 650$ and the rental option will be removed after this. Don't miss the current price offer before it is too late. Dear Traders I am so glad to introduce my Super Powers Indicator.  The purpose of this trading tool is to help serious traders who want to make trading one of their main source of income.  I know trading is not an easy task but if you have the right tools, knowledge and motivation to trade then you are ready to go in this industry. My role is to help y
Gold Trader Pro Indicator
Massimiliano Tuzzolino
5 (2)
Gold Trader Pro is an advanced analytical tool specifically engineered for professional trading on XAUUSD (Gold). It provides an immediate comprehensive overview of market structure across 7 different timeframes, allowing traders to identify flow direction and signal strength through a modern, draggable, and interactive interface. Key Features Multi-Timeframe Analysis: Real-time monitoring of M1, M5, M15, M30, H1, H4, and D1. Two Operational Modes: MODE_SCALPING: Optimized for fast-paced analys
FREE
PipFinite Exit EDGE
Karlo Wilson Vendiola
4.83 (115)
Did You Have A Profitable Trade But Suddenly Reversed? In a solid strategy, exiting a trade is equally important as entering. Exit EDGE helps maximize your current trade profit and avoid turning winning trades to losers. Never Miss An Exit Signal Again Monitor all pairs and timeframes in just 1 chart www.mql5.com/en/blogs/post/726558 How To Trade You can close your open trades as soon as you receive a signal Close your Buy orders if you receive an Exit Buy Signal. Close your Sell orders if
Fxland Price Reversal Zones (MT4) FXLAND Smart Reversal Indicator is a professional technical analysis tool designed to help traders identify potential price reversal zones and key market turning points with clarity and precision. The best reversal indicator and price return by choosing only one ceiling or floor in each time frame A masterpiece of combining mathematics and Gann, fractal matrix, Fibonacci, movement angle and time. Completely intelligent Key Features Detects potential pr
LDS Scalper
Justice Chinemelum Clement
PLEASE LEAVE US A 5-STAR REVIEW   LDS Scalper User Manual+ Extra LDS CSDIF INDICATOR + Training Videos   ABOUT LDS SCALPER INDICATOR STRATEGY Built on  15+ years of trading experience. LDS Scalper is a very powerful  trading indicator for scalping strategy, returns very high accuracy rate in forex, futures, cryptocurrencies, stocks and indices. This indicator displays arrow signals based on price action information with high accuracy. The LDS Scalper Indicator strategy when applied can turn a ne
WanaScalper MT4
Isaac Wanasolo
1 (1)
A scalping indicator based on mathematical patterns, which on average gives signals with relatively small SL, and also occasionally helps to catch big moves in the markets (more information in the video) This indicator has three main types of notifications: The first type warns of a possible/upcoming signal on the next bar The second type indicates the presence of a ready signal to enter the market/open a position The third type is for SL and TP levels - you will be notified every time price re
FiboRec
Alfred Kamal
This indicator depends on Fibonacci lines but there is a secret lines i used them, by using FiboRec indicator you will be able to know a lot of important information in the market such as: Features You can avoid entry during market turbulence. You can enter orders in general trend only. You will know if the trend is strong or weak. Signal Types and Frame used You can use this indicator just on H1 frame. Enter buy order in case Candle break out the square area and closed over it, at least 20 pi
EFW Pattern Trader is a powerful pattern scanner for Forex and Stock trading. The pattern detection in EFW Pattern Trader uses the Fractal Wave Theory, which captures the endless up and down movement of the market. Therefore, EFW Pattern Trader can be considered as the robust price action indicator. Any patterns in EFW Pattern Trader can be backtested visually in your strategy tester. Visual backtesting with pattern will show you how pattern will likely behave in the live trading. Therefore, you
DMS Fibo
Diogo Mitsunaga Dos Santos
Fibonacci retracements are trend lines drawn between two significant points, usually between absolute lows and absolute highs, plotted on a chart. Intersecting horizontal lines are placed at the Fibonacci levels. Fibonacci retracements are useful tools that help traders identify support and resistance levels. With the information gathered, they can place orders, identify stop-loss levels, and set price targets. Although useful, traders often use other indicators to make more accurate assessments
TSO Fibonacci Chains
Dionisis Nikolopoulos
5 (1)
Fibonacci retracement is a method of technical analysis for determining support and resistance levels. The TSO Fibonacci Chains Indicator is different from a simple Fibonacci Retracements indicator in that it provides the targets for each retracement level. In other words, there is an Extension Level (D) for every Retracement Level (C). In addition, if an Extension Level is reached, then a new Fibonacci setup is created automatically. These consecutive Fibonacci setups create a chain that reveal
For this set of indicators 1. General information     - Calculates with high performance mathematical algorithms.     - Calculated from the price of candles     - The entry point of this order is filtered by the train EMA and the oscillator.     - Calculate the integrity of the candle 2. How does it work?     - You can see two types of order entry points: the notification on the monitor and the arrow.     - You can trust 75-95 percent of this entry point. 3. Settings     - A complete candle i
Shark Surfer is a new generation indicator applying a well-established trend-following trading. The product is good both for scalping, as well as medium- and long-term trading. Shark Surfer analyzes a selected symbol and shows the recommended market entry, take profit and stop loss levels. Shark Surfer trades on all symbols and timeframes. It also features email and push notifications concerning the new trading signals. The indicator searches for suitable market entry points on an already formed
Perfect Real Trade System   indicator is designed for trend and signal trading. This indicator generates trend signals.  It uses many algorithms and indicators to generate this signal. It tries to generate a signal from the points with the highest trend potential. This indicator is a complete trading product. This indicator does not need any additional indicators.  You can only trade with this indicator. The generated signals are displayed on the graphical screen.  Thanks to the alert features y
Bu ürünün alıcıları ayrıca şunları da satın alıyor
Miraculous Göstergesi – Gann Dokuz Kareye Dayalı %100 Tekrarlamayan Forex ve İkili Araç Bu video, Forex ve İkili Opsiyon traderları için özel olarak geliştirilmiş son derece doğru ve güçlü bir ticaret aracı olan Miraculous Göstergesi 'ni tanıtıyor. Bu göstergeyi benzersiz kılan, efsanevi Gann Dokuz Karesi ve Gann Titreşim Yasası 'na dayanmasıdır; bu da onu modern ticarette mevcut en hassas tahmin araçlarından biri yapmaktadır. Miraculous Göstergesi tamamen tekrarlamaz ; yani mum kapandıktan son
Precautions for subscribing to indicator This indicator only supports the computer version of MT4 Does not support MT5, mobile phones, tablets The indicator only shows the day's entry arrow The previous history arrow will not be displayed (Live broadcast is for demonstration) The indicator is a trading aid Is not a EA automatic trading No copy trading function The indicator only indicates the entry position No exit (target profit)  The entry stop loss point is set at 30-50 PIPS Or the front hi
Pulse Scalping Line - an indicator for identifying potential pivot points. Based on this indicator, you can build an effective Martingale system. According to our statistics, the indicator gives a maximum of 4 erroneous pivot points in a series. On average, these are 2 pivot points. That is, the indicator shows a reversal, it is erroneous. This means that the second signal of the indicator will be highly accurate. Based on this information, you can build a trading system based on the Martingale
El indicador "MR BEAST ALERTAS DE LIQUIDEZ" es una herramienta avanzada diseñada para proporcionar señales y alertas sobre la liquidez del mercado basándose en una serie de indicadores técnicos y análisis de tendencias. Ideal para traders que buscan oportunidades de trading en función de la dinámica de precios y los niveles de volatilidad, este indicador ofrece una visualización clara y detallada en la ventana del gráfico de MetaTrader. Características Principales: Canal ATR Adaptativo: Calcula
PairMaster Buy Sell Arrow Indicator for MT4 Trade Reversals Like a Pro — Catch Every Swing Point with Precision The PairMaster Buy Sell Arrow Indicator is a powerful MetaTrader 4 tool built to identify high-probability swing trading opportunities . Designed for traders who value accuracy, clarity, and simplicity, PairMaster detects key market turning points and plots intuitive buy and sell arrows directly on your chart. Key Features Accurate Swing Point Detection – Automatically identifies ma
BinaryIndicator is a highly accurate indicator for trading binary options. It shows excellent results in scalping. This indicator is based in multifactor analysis of trend indicators, as well as confirmation oscillators, which in the end gives an increased accuracy of signals. Advantages of the indicator Increased accuracy of signals. Excellent results when trading binary options with a short expiration time from M30 to M1 . It works on any timeframes. Works with any trade symbols. Parameters
Rtc ML Ai | Predictor CORE MACHINE LEARNING ENGINE Adaptive ML Market Predictor – Multi-Bar Trend & Candle Forecast What This Indicator Does This indicator is a  real-time market prediction engine  designed to analyze price behavior and estimate  future market tendencies . Unlike conventional indicators, this system  does not rely on static parameters or historical curve-fitting , but adapts its internal state dynamically during live market operation. Instead of using static rules, the indic
*This is tradingview indicator converted to mql4* The Chandelier Exit Indicator is a popular technical analysis tool developed by Chuck LeBeau. It is designed to help traders identify potential exit points for their trades based on market volatility and the concept of trailing stops. The Chandelier Exit Indicator consists of three main components: Average True Range (ATR): The indicator utilizes the Average True Range, which measures market volatility. The ATR calculates the average range betwe
FFx Engulfing Setup Alerter gives trade suggestions with Entry, Target 1, Target 2 and StopLoss. Below are the different options available: Entry suggestion - pips to be added over the break for the entry 3 different options to calculate the SL - by pips, by ATR multiplier or at the pattern High/Low 3 different options to calculate the 2 TPs - by pips, by ATR multiplier or at Risk/Reward Offset the dashboard - any place on the chart Remove the suggestion once the price reached the SL line Lines
FFx InsideBar Setup Alerter gives trade suggestions with Entry, Target 1, Target 2 and StopLoss. Below are the different options available: Entry suggestion - pips to be added over the break for the entry Minimum candle size - to avoid too close buy/sell entry suggestions 3 different options to calculate the SL - by pips, by ATR multiplier or at the pattern High/Low 3 different options to calculate the 2 TPs - by pips, by ATR multiplier or at Risk/Reward Offset the dashboard - any place on the c
FFx OutsideBar Setup Alerter gives trade suggestions with Entry, Target 1, Target 2 and StopLoss. Below are the different options available: Entry suggestion - pips to be added over the break for the entry. 3 different options to calculate the SL - by pips, by ATR multiplier or at the pattern High/Low. 3 different options to calculate the 2 TPs - by pips, by ATR multiplier or at Risk/Reward. Offset the dashboard - any place on the chart. Remove the suggestion once the price reached the SL line.
FFx PinBar Setup Alerter gives trade suggestions with Entry, Target 1, Target 2 and StopLoss. Below are the different options available: Entry suggestion - pips to be added over the break for the entry Minimum candle size - to avoid too small candles 3 different options to calculate the SL - by pips, by ATR multiplier or at the pattern High/Low 3 different options to calculate the 2 TPs - by pips, by ATR multiplier or at Risk/Reward Offset the dashboard - any place on the chart Remove the sugges
The purpose of this new version of the MT4 standard indicator provided in your platform is to display in a sub-window multiple timeframes of the same indicator with its divergences. See the example shown in the picture below. But the display isn't like a simple MTF indicator. This is the real display of the indicator on its timeframe. Here's the options available in the FFx divergences indicator: Select the timeframes to be displayed (M1 to Monthly) Define the width (number of bars) for each tim
The purpose of this new version of the MT4 standard indicator provided in your platform is to display in a sub-window multiple timeframes of the same indicator with its divergences. See the example shown in the picture below. But the display isn't like a simple MTF indicator. This is the real display of the indicator on its timeframe. Here's the options available in the FFx divergences indicator: Select the timeframes to be displayed (M1 to Monthly). Define the width (number of bars) for each ti
The FFx Dashboard MTF alerter will show you on a single chart all the timeframes (M1 to Monthly) with their own status for the indicator. 2 Alert Options: Single timeframe: each selected timeframe alert separately when a signal occurs Multi timeframes: all selected timeframes must agree for an alert to be triggered Both options have an input to select the timeframes to be used for the alert(s). How to Understand the Status: Green/Red square: histogram above/below 0 line Green square + Red bord
The FFx Dashboard MTF alerter will show you on a single chart all the timeframes (M1 to Monthly) with their own status for the indicator. 2 Alert Options: Single timeframe: each selected timeframe alert separately when a signal occurs Multi timeframes: all selected timeframes must agree for an alert to be triggered Both options have an input to select the timeframes to be used for the alert(s). How to understand the status: Green/Red square: RSI above/below 50 line Green square + Red border: R
The FFx Dashboard MTF alerter will show you on a single chart all the timeframes (M1 to Monthly) with their own status for the indicator. 2 Alert Options: Single timeframe: each selected timeframe alert separately when a signal occurs Multi timeframes: all selected timeframes must agree for an alert to be triggered Both options have an input to select the timeframes to be used for the alert(s). How to understand the status: Green/Red square: Stoch above/below 50 line Green square + Red border:
The FFx Dashboard MTF alerter will show you on a single chart all the timeframes (M1 to Monthly) with their own status for the indicator. 2 Alert Options: Single timeframe: each selected timeframe alert separately when a signal occurs Multi timeframes: all selected timeframes must agree for an alert to be triggered Both options have an input to select the timeframes to be used for the alert(s). How to understand the status: Green/Red square: Price above/below Cloud (Kumo) Green square + Red bo
The FFx Dashboard MTF alerter will show you on a single chart all the timeframes (M1 to Monthly) with their own status for the indicator. 2 Alert Options: Single timeframe: each selected timeframe alert separately when a signal occurs Multi timeframes: all selected timeframes must agree for an alert to be triggered Both options have an input to select the timeframes to be used for the alert(s). How to understand the status: Green/Red square: MA pointing Up/Down Green square + Red border: MA po
The FFx Dashboard MTF alerter will show you on a single chart all the timeframes (M1 to Monthly) with their own status for the indicator. 2 Alert Options: Single timeframe: each selected timeframe alert separately when a signal occurs. Multi timeframes: all selected timeframes must agree for an alert to be triggered. Both options have an input to select the timeframes to be used for the alert(s). How to understand the status: Green square: Price above PSAR Red square: Price below PSAR Options
The FFx Dashboard MTF alerter will show you on a single chart all the timeframes (M1 to Monthly) with their own status for the indicator. 2 Alert Options: Single timeframe: each selected timeframe alert separately when a signal occurs Multi timeframes: all selected timeframes must agree for an alert to be triggered Both options have an input to select the timeframes to be used for the alert(s). How to understand the status: Green/Red square: CCI above/below levels (ie. 100/-100) Grey square: C
The FFx Dashboard MTF alerter will show you on a single chart all the timeframes (M1 to Monthly) with their own status for the indicator. 2 Alert Options: Single timeframe: each selected timeframe alert separately when a signal occurs Multi timeframes: all selected timeframes must agree for an alert to be triggered Both options have an input to select the timeframes to be used for the alert(s). How to understand the status: Green/Red square: ADX above level Grey square: ADX below level Red bor
The FFx Dashboard MTF alerter will show you on a single chart all the timeframes (M1 to Monthly) with their own status. 2 Alert Options: Single timeframe: each selected timeframe alert separately when a signal occurs Multi timeframes: all selected timeframes must agree for an alert to be triggered Both options have an input to select the timeframes to be used for the alert(s). How to understand the status: Green/Red square: bullish/bearish candle Options available in the FFx Dashboard Alerter
The [GRAFF] III manual trading system is based on multiple MetaTrader (MT4) indicators. Together, the entire PACK of GRAFF III indicators makes an advanced trading tool. The system consists of over 20 different custom-built indicators which have been carefully selected and tested in the long term to produce strong and efficient trading signals. The particular indicators are based on different mathematical formulas, so the entire system is calibrated to remove false signals from its own indicator
FFx Universal Strength Meter PRO is more than a basic strength meter. Instead of limiting the calculation to price, it can be based on any of the 19 integrated strength modes + 9 timeframes. With the FFx USM, you are able to define any period for any combination of timeframes. For example, you can set the dashboard for the last 10 candles for M15-H1-H4… Full flexibility! Very easy to interpret... It gives a great idea about which currency is weak and which is strong, so you can find the best pai
Pan PrizMA CD Phase is an analogue of the МetaТrader 5 indicator , and is an option based on the Pan PrizMA indicator. Details . Averaging by a quadric-quartic polynomial increases the smoothness of lines, adds momentum and rhythm. Extrapolation by the sinusoid function near a constant allows adjusting the delay or lead of signals. The value of the phase - wave status parameter (which is close in meaning to the trigonometric phase or the angle of the radius-vector rotation in the trigonometric p
Green Wall Arrows
Daniel Luchinger
1 (1)
The Name Green Wall : Arrows hits a lot of TP, by changing the idea of non using SL as something bad, but instead use Small TP and a lot of free Margin and Patience. Use micro TP and a lot of Free Margin with this indicator on Forex. It also can be used with Binary Options. This strategy is intended to be traded Manually. This Indicator runs on Open Bar, arrows will delete when price are against it. The only Indicator Parameter is Alerts true/false, all the rest is included inside the code. Arro
Yazarın diğer ürünleri
MT4 / MT5 için Astronomi Göstergesini Tanıtıyoruz: En İleri Göksel Ticaret Arkadaşınız Ticaret deneyiminizi göksel seviyelere yükseltmeye hazır mısınız? MT4 için devrim niteliğindeki Astronomi Göstergemizi arayın. Bu yenilikçi araç karmaşık algoritmaları kullanarak eşsiz astronomik içgörüler ve hassas hesaplamalar sunmak için geleneksel ticaret göstergelerini aşmaktadır. Bilgi Evreni Parmaklarınızın Ucunda:   Göksel verilerin hazinelerini açığa çıkaran kapsamlı bir paneli gözlemleyin. Gezegenl
Sizlere ON Trade Waves Patterns Harmonic Elliot Wolfe'u tanıtmaktan mutluluk duyarız. Bu, manuel ve otomatik yöntemleri kullanarak piyasada çeşitli desenleri tespit etmek için tasarlanmış gelişmiş bir göstergedir. İşte nasıl çalıştığı: Harmonik Desenler: Bu gösterge, grafiğinizde görünen harmonik desenleri tanımlayabilir. Bu desenler, Scott Carney'in "Harmonic Trading vol 1 & 2" adlı kitabında açıklandığı gibi harmonik ticaret teorisini uygulayan tüccarlar için önemlidir. Onları manuel olarak ç
"Bu gösterge basit bir eğilim tespit aracıdır. Skalping modu gibi iyi girişlere sahip olmak için stratejinizle birlikte kullanabilirsiniz. Fiyatın etrafında bir kanal çizecektir ve zaman arttıkça genişleyecektir; özel dönemlerde algoritma çalışma süresi ve fiyatı bir araya getirerek artış noktasının başlangıcına dönecektir. Ters dönüş işaretleri göründükten sonra kanalın en düşük sınırından satın alabilirsiniz. Ve ters dönüş işaretlerini gördükten sonra en yüksek kanal sınırından satabilirsiniz
"Bu gösterge, Bystra deseni teorisine dayalı olarak girişleri tespit eder ve hedef ve durma seviyeleri ile sınırlı emirleri yerleştirmek için giriş değerlerini sağlar. Bu, risk yüzdesini hesaplamanıza olanak tanır. Notlar: Bu gösterge, Uzman Danışmanlar (EA) içinde kullanım için tamponlara sahiptir. Bu ürünle çalışırken iyi bir para yönetimi uygulamanız önemlidir. Zaman diliminizi değiştirdiğinizde, Gösterge, son oturumunuzda kullanılan şablonu kaydedecektir. Bu yöntemi öğrenmek için bir kitaba
Altın Gram Fiyatı Hesaplayıcı Gösterge Tanıtımı Yerel para biriminizdeki altın fiyatını sürekli olarak takip etmek istiyor musunuz? Daha fazla aramayın, Altın Gram Fiyatı Hesaplayıcı Gösterge, tercih ettiğiniz yerel para biriminde gerçek zamanlı olarak gram başına altın fiyatını hesaplamanıza olanak sağlayan yenilikçi bir araç sunar. Bu gösterge ile finansal bilgileri kullanarak bilinçli kararlar alabilirsiniz. Ana Özellikler: Yerelleştirilmiş Altın Fiyatı: Altın Gram Fiyatı Hesaplayıcı Gösterge
FREE
ON Trade Pivoteer
Abdullah Alrai
4 (1)
Introducing the Pivot Point Selector Indicator: Your Ultimate Tool for Custom Pivot Levels Are you ready to take your trading to the next level? Say hello to the Pivot Point Selector Indicator, a game-changing tool that puts you in control of your pivot levels. This innovative indicator empowers you to choose three specific points that will determine the pivot level calculations, giving you unparalleled customization and precision in your trading strategy. Key Features and Benefits: Custom Pivo
FREE
Bu gösterge, ticaret grafiğinizde Donchian kanalını görsel olarak temsil etme amacını taşır. Donchian kanalı, belirli bir dönemde en yüksek yüksek ve en düşük düşük arasındaki aralığı gösteren basit bir teknik araçtır. Bu gösterge, fiyat hareketlerinin görsel analizini geliştirerek potansiyel kırılma ve trend devam noktalarına dair anlayış sunar. Donchian kanalı, bu seçeneği etkinleştirmeyi tercih ederseniz hem geçerli zaman dilimine hem de daha yüksek bir zaman dilimine uygulanabilir. Gösterge
FREE
ON Trade Pivots is A technical indicator that Draws all Pivot levels depending on time frame that defined in settings. Notes It will be good tool for all traders who use pivot levels in their trades. Let me inform you that this indicator draw this level as buffers not as objects then you can connect it easily to EA. This indicator allow you to find pivots levels for any time frame not only daily you are free to choose time frame from settings. Parameters Use_System_Visuals - Enable /Disable Sy
FREE
Bu gösterge, Elliott dalga teorisi ile iki şekilde çalışır: Otomatik Çalışma: Bu modda gösterge, Elliott dalga teorisine uygun olarak grafikteki beş hareket dalgasını otomatik olarak tespit edecek ve tahminlerde bulunacak, potansiyel ters dönüş bölgelerini belirleyecektir. Ayrıca, önemli gelişmeler hakkında tüccarları uyarılar ve bildirimlerle bilgilendirebilme yeteneğine sahiptir. Bu otomatik işlev, Elliott dalga desenlerinin tanımlanması ve analiz sürecini basit hale getirir. Manuel Çalışma: B
Bu araç sayesinde grafiklerinizde regresyon kanalını kontrol etme yeteneği elde edersiniz. Kanal seviyelerini, destek ve direnç seviyelerini sağlayacaktır. Ayrıca düzeltme dalgası seviyelerini sunar. Ayrıca, dolum ve ışın seçenekleri gibi kanalı doğrudan kontrol etme imkanını sağlayan bir kontrol paneli üzerinden kanalı yönetebilirsiniz. Ayrıca, farklı çiftlerle işlem yaparken daha iyi bir görünüm elde etmek için daha yüksek zaman dilimlerinden veri yükleyebilirsiniz. Nasıl Kullanılır: Trend Çiz
Güçlü Forex göstergemizi sizlere sunuyoruz. Bu gösterge, ticaret stratejinizi geliştirmeniz ve size piyasa trendleri hakkında kesin bilgiler sağlamanız için tasarlanmıştır. Bu yenilikçi araç, mum ölçümlerini ayrıntılı bir şekilde analiz eden ve en iyi hassasiyeti elde etmek için ayarlamalar yapan sofistike bir özel algoritma kullanır. Sonuç? Grafiğinizde stratejik giriş noktalarını gösteren dikkatlice çizilmiş bir ok takımı. Bu göstergenin arkasındaki dahilik, mum desenlerinin gücünden faydalanm
Bu gösterge, Gann teorisinden türetilmiş özel bir desen olan elmas Gann dalgalarını tespit etmek ve görselleştirmek için tasarlanmıştır. Desenin ABC noktalarına dayanarak noktaları (P) çizerek traderlere potansiyel piyasa dönüşleri hakkında görüşler sunar. Ayrıca, gösterge tahmin edilen noktalardan (P) dikey çizgiler çizerek traderlerin potansiyel dönüş noktalarını daha kolay tanımasına yardımcı olur. Gösterge Özellikleri: Use_System_Visuals: Bu parametre, göstergenin görünümü için sistem teması
"Fibo Star" göstergesi, Fibonacci Fanlarını yıldız şeklinde grafik üzerine çizmek için tasarlanmıştır. Bu Fibonacci Fanları, fiyat hareketlerini analiz etmek için güçlü bir araçtır ve potansiyel destek ve direnç seviyeleri hakkında görüşler sunabilir. Bu gösterge, çizim ve yapılandırma sürecini kolaylaştırmayı amaçlayan kullanıcı dostu bir kontrol paneli ile donatılmıştır, böylece zaman ve çaba tasarrufu sağlar. Kullanım Talimatları: Bu gösterge manuel kullanım içindir. Etkili bir şekilde kullan
"Para Birimi Gücü" göstergesi, forex piyasasındaki farklı para birimlerinin göreceli gücünü sağlamak amacıyla tasarlanmış güçlü bir araçtır. Her bir para biriminin belirtilen zaman dilimine göre gücünü hesaplayarak ve temsil ederek, bu gösterge, trader'lara potansiyel işlem fırsatlarını tanımlama imkanı sunar, özellikle belirgin ayrışmalar veya kesişmeler gözlendiğinde. Gösterge Ana Özellikleri: 1. Para Birimi Gücü Hesaplama: Gösterge, her bir para biriminin belirtilen zaman dilimine göre gücünü
Gann Kare Göstergesi, W.D. Gann tarafından yazılan "Piyasa Tahminleri için Matematiksel Formül" makalesine dayalı güçlü bir piyasa analizi aracıdır. Bu araç, piyasa analizi için matematiksel ve Gann teorilerini kullanarak hassas analizler gerçekleştirir. 144, 90, 52 karelerini ve ayrıca 9 karesini kullanır. Ayrıca, 'ın 9 karesi ve bu kareyle ilişkili kanallar ve yıldız modelleri için yöntemini içerir. Kullanıcı Kılavuzu ve Uygulama: Bu göstergeleri kullanmadan önce, kullanıcı kılavuzunu okumanız
Bu gösterge, manuel ve otomatik yöntemlerle çizilen harmonik desenleri tespit edecektir. Lütfen görüşlerinizi ekleyin. Notlar: Bu gösterge bir kontrol paneline sahiptir ve her (grafik ve zaman dilimi) ayarını kaydedecektir. Daha fazla grafik alanı için onu küçültebilir ve diğer analiz araçlarıyla çalışmayı tercih ederseniz tüm gösterge verilerini gizlemek için kapatma düğmesini kullanabilirsiniz. Bu göstergenin ayarlarını değiştirirken Hareketli Ortalama veya Bollinger Bantları gibi göstergeler
Hikkake Japon Şamdan Deseni, grafikte oluşan Hikkake Fiyat Hareket Desenlerini belirlemek ve tespit etmek üzere tasarlanmış özel bir göstergedir. Bu desenler, genellikle potansiyel ticaret fırsatlarına yol açan bir iç çubukta sahte bir dışarı çıkma kavramına dayanır. Göstergenin temel işlevi, grafiğin son beş şamdanını analiz etmek ve bu şamdanların Hikkake deseninin özelliklerini sergileyip sergilemediğini belirlemektir. Bu desen onaylandığında, gösterge deseni oluşturan şamdanların etrafına bi
Güçlü Fiyat Hareketi Desenlerini Algılayan Teknik Gösterge: Pin Bar, Inside Bar ve Outside Bar Giriş: Teknik analizin alanında, fiyat hareketi desenleri potansiyel piyasa hareketlerinin önemli göstergeleri olarak işlev görür. Grafiklerde sağlam fiyat hareketi desenlerini tanımlamanın kolaylaştırıldığı sofistike bir teknik gösterge geliştirdik. Göstergemiz, üç temel deseni tanıma konusunda uzmanlaşmıştır: Pin Bar, Inside Bar ve Outside Bar. Ana Desenlerin Algılanması: Pin Bar: Pin Bar deseni, piy
MetaTrader için Numeroloji Temelli Destek ve Direnç Göstergesi Giriş: MetaTrader için geliştirdiğimiz Numeroloji Temelli Destek ve Direnç Göstergesi ile teknik analizde yeni bir boyut keşfedin. Bu benzersiz araç, numerolojinin gücünü kullanarak grafiklerinizdeki ana destek ve direnç seviyelerini belirlemek suretiyle potansiyel fiyat hareketleri hakkında değerli görüşler sunar. Ana Konseptler: Tradingde Numeroloji: Numeroloji, sayıların ve anlamlarının mistik olarak incelenmesidir. Numeroloji ilk
Shepherd Numeroloji Seviye Göstergesi ile ticarette devrim yaratan bir yaklaşımı keşfedin. Bu yenilikçi araç, geleneksel ticaret tekniklerini antik numeroloji bilgisiyle birleştirerek grafiklerinizdeki önemli destek ve direnç seviyelerini belirlemenize yardımcı olur. Dokuzun karesi yöntemini kullanarak bu gösterge, piyasa mekanizmalarına farklı bir bakış açısı sunar ve daha bilinçli ticaret kararları almanıza olanak tanır. Ana Özellikler ve Avantajlar: Numeroloji ve Dokuzun Karesi: Shepherd Nume
Conclusioni: L'Indicatore ON Trade Numerology Mirror introduce una nuova prospettiva nell'analisi delle inversioni di prezzo integrando la saggezza antica della numerologia. Decifrando i modelli invertiti delle sequenze di numeri, ottieni una prospettiva unica sulle possibili inversioni di prezzo. Poiché il successo nel trading dipende da molti fattori, considera questo indicatore come parte integrante della tua strategia di trading globale. [Avviso: Il trading comporta rischi, e l'indicatore d
MT4 için Astronomi Göstergesini Tanıtıyoruz: En İleri Göksel Ticaret Arkadaşınız Ticaret deneyiminizi göksel seviyelere yükseltmeye hazır mısınız? MT4 için devrim niteliğindeki Astronomi Göstergemizi arayın. Bu yenilikçi araç karmaşık algoritmaları kullanarak eşsiz astronomik içgörüler ve hassas hesaplamalar sunmak için geleneksel ticaret göstergelerini aşmaktadır. Bilgi Evreni Parmaklarınızın Ucunda: Göksel verilerin hazinelerini açığa çıkaran kapsamlı bir paneli gözlemleyin. Gezegenlerin geo/h
Introducing the ON Trade Melad Pattern Indicator: Enhance Your Trading Strategy with Breakout Patterns Discover the power of the ON Trade Melad Pattern Indicator—an intuitive tool designed to elevate your trading decisions by detecting and highlighting breakout patterns on your charts. This indicator is your key to identifying crucial breakout points and potential trend shifts with simplicity and precision. Key Features: Breakout Pattern Detection: The ON Trade Melad Pattern Indicator focuse
This indicator will give you entries as result of scalping strategy that will be applied on 14 symbols in same time and you are able to be notified with this entries  Note :   This indicator for scalping on 5 minutes timeframe only . How to use it : 1-Open chart and adjust settings (edit symbols names as your platform names , activate the alert system if you need it . 2-Wait for any signal you have it from this scanner you will have it as alert and as notification and you will see it on board
This indicator gives you the signal of real cross on stochastic indicator. This indicator is easy to attach to an ea. This indicator will work best on All time frames. Arrow appears depending on many algorithms that study the cross parameters. Indicator properties Use_System_Visuals: enable/disable visual styles. Stochastic_K_Period. Stochastic_D_Period. Stochastic_Slowing. Use_Notifications: enable/disable Push Notifications. Use_Alert: enable/disable Alerts. Use_E_Mail: enable/disable Email n
Tanıtıyoruz: "ON Trade VSA" - Hacim ve Dağılım Analizi için Ultimate Araç! Gücünü, hacim ve dağılım analizinin (VSA) öncü göstergesi "ON Trade VSA" ile keşfedin. VSA, piyasa gücünü değerlendirmek, trendleri tanımlamak ve bilinçli kararlar almak için trader'lar tarafından kullanılan güçlü bir metodolojidir. Şimdi "ON Trade VSA"yı, ticaret cephaneliğinizde vazgeçilmez bir araç haline getiren temel özelliklere göz atalım: Çok Renkli Hacim Mumları : Ortalama harekete dayalı olarak farklı renkler ata
This product is a part of  ON Trade Waves Patterns Harmonic Elliot Wolfe you can test free version on EURJPY from this link  Wolf Waves Indicator Kurt Dalgalarını Keşfedin - En İyi Ticaret Aracınız! Herhangi bir zaman diliminde Kurt Dalgalarını kolayca tespit etmek için güçlü bir araç mı arıyorsunuz? Daha fazla aramayın! Kurt Dalgaları göstergemiz bu işi zahmetsizce halleder. İşte neden sizin için mükemmel olduğunu anlatıyoruz: Ana Özellikler: Otomatik Algılama:   Kurt Dalgaları göstergemiz a
This program serves as an effective tool for sending messages through a Telegram bot using the MetaTrader platform. It enables you to send your trading recommendations related to the orders you open on the trading platform directly to your Telegram channel or group. These messages may include details about open trades and can be accompanied by illustrative images of the orders. Alternatively, they can be configured to be without images based on your preferences. This means that if you are the ow
Yeni gösterge tanıtıyoruz: [ON Trade Breakout Zone] Her türlü trader için basit ancak güçlü bir piyasa analiz aracı! Profesyoneller ve yeni başlayanlar için uygun Trading stratejinizi güçlendirmeye hazır mısınız? En son göstergemiz, piyasa analizini basitleştirmeyi ve her seviyeden trader'a güç vermayi amaçlıyor. Tecrübeli bir profesyonel veya yeni başlayan biri olun, [ON Trade Breakout Zone], piyasadaki potansiyel karları açmanız için anahtardır. [ON Trade Breakout Zone] Nasıl Kulla
Bu ürün, birçok fonksiyonla siparişlerinizi ve hesabınızı kontrol etmenizi sağlayacaktır. 1- 1 lot büyüklüğü için hesap büyüklüğünüze/SL büyüklüğünüze/çift puan değerine bağlı olarak doğru lot büyüklüğünü hesaplayacaktır. 2- Satırların yerlerine bağlı olarak size mevcut sipariş durumunu verecektir (target sl tp ). 3- 1 butona basıldığında tüm emirleri hedef/sl'ye taşıyacaktır. 4- Size hesabınız ve emirlerinizi açmak için gereken teminat hakkında bilgi verecektir. 5- Tüm emirleri (sembol ve
Filtrele:
Değerlendirme yok
Değerlendirmeye yanıt