Tick Poly Regression Channel

/////////////////////////////////////////////////////////////////////////////////// / /////////////////////////////////////////////////////////////////

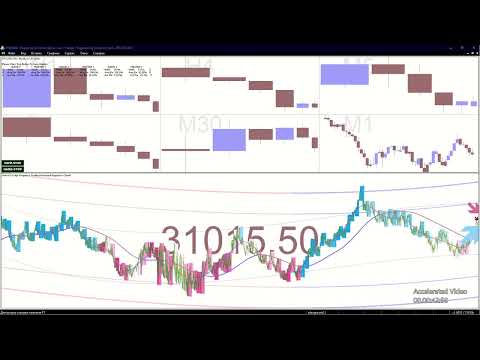
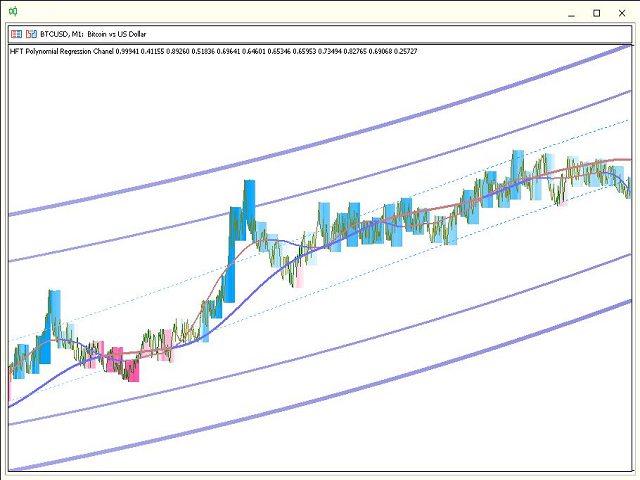
Questo indicatore mostra un canale di regressione polinomiale non lineare. Funziona molto velocemente come un fulmine. Soprattutto quando si utilizza la tecnologia di accelerazione OpenCL.

A breve sarà disponibile una versione speciale di questo indicatore, che prevede anche il prezzo per un po' di tempo.

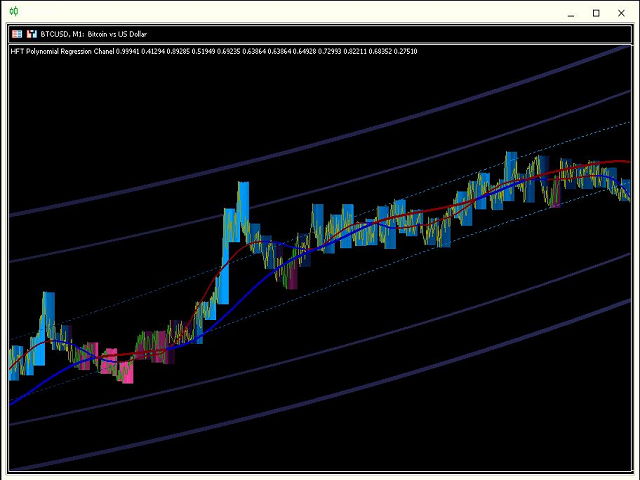
Queste sono linee colorate adattive e lisce.

Ci sono quattro opzioni per questo indicatore:

1) 1 secondo di tempo

2) 2 secondi di tempo

3) 12 secondi di tempo

4) lasso di tempo del grafico

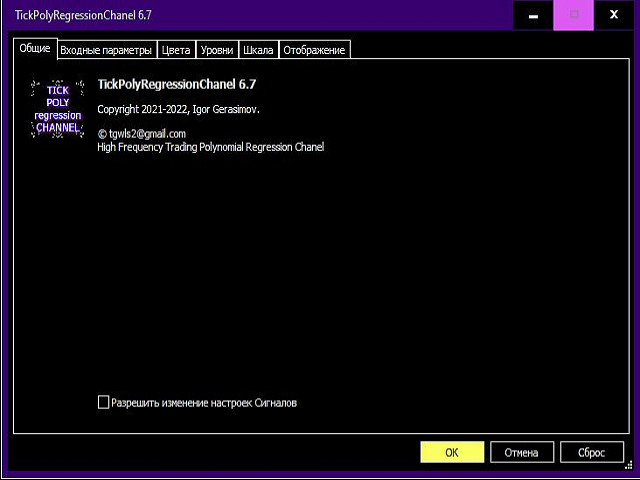
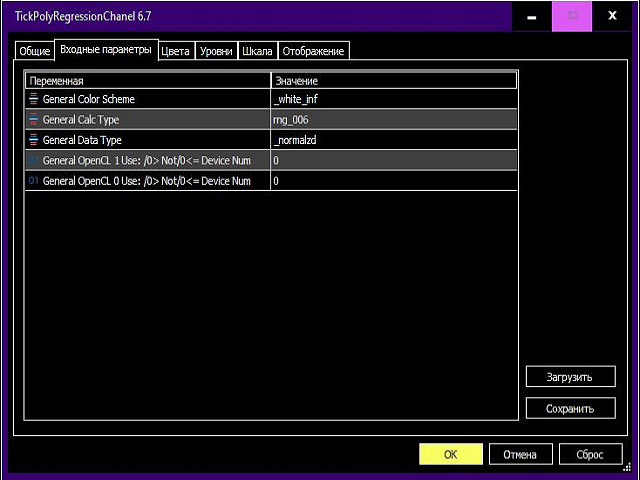
Tutte le impostazioni sono molto semplici, tra le quali le principali sono:

0) scelta dei tempi

1) la scelta del tipo di normalizzazione dei dati.

2) scelta dell'acceleratore OpenCL

3) altre semplici impostazioni.

Puoi anche cambiare i colori se lo desideri.

Comprendere le letture di questo indicatore è molto semplice, blu - compra, rosso - vendi.

E puoi anche costruire ulteriormente sulle linee del canale, che a loro volta cambiano anche colore a seconda dell'angolo di inclinazione.

Per utilizzare questo indicatore, è sufficiente osservarne il lavoro per un breve periodo per trovare e comprendere i modelli. L'utilizzo di questo indicatore aumenterà l'efficienza del tuo trading.

Questo indicatore non funziona nel tester di strategia, quindi guarda il video per dimostrare le possibilità.

/////////////////////////////////////////////////////////////////////////////////// / /////////////////////////////////////////////

Per utilizzare questo indicatore, ci sono requisiti hardware minimi per il tuo computer:

1) Il processore deve avere più di 4 core,

2) La quantità di RAM è superiore a 2 gigabyte.

3) Per un uso accelerato e confortevole, è auspicabile

utilizzare una moderna scheda video che supporti lo standard minimo OpenCL 2.0

/////////////////////////////////////////////////////////////////////////////////// / /////////////////////////////////////////////////////////////////

Spero che questo indicatore ti sia molto utile per fare trading di successo.


In bocca al lupo.

Prodotti consigliati
Displays trends in current chart. You can display trends of multiple timeframes in one chart by inserting this indicator as often as you want. Key features: displays trend line by finding highs and lows counts number of high/low of current trend in different color (long/short) allows you to display multiple timeframe trends in one chart Settings: Indicator Name: if you want to show M5 and H1 on one chart add TITrend twice to your current chart and rename M5 to "TITrendM5" and H1 to "TITrendH1" C
Murrey Math Lines The concept of this technical analysis system was developed by T. Henning Murrey in 1995 and described in The Murrey Math Trading System; For All Markets. The main concept here is that all markets behave in the same manner based upon the observations made by W.D. Gann. To date, the Murrey Math Line X it is one the most popular methods of Forex analysis and trading. Formula The Murrey Math Line X is calculated with the help of price movement segment, which, in accordance to Gan
My Pivot
Ashok Kumar Singha
My Pivot is an Indicator based on Pivot Lines and Support-Resistance zones. This Indicator will Plot 11 SR zones including Pivot Line which will definitely help you to understand the exact SR zones of the Market. Steps to Setup the Indicator: Install the Custom Indicator; Set all the Lines Color, Width and Styles; Set visualization to All Timeframe; and DONE It can be used for: All Pairs: Forex, Cryptocurrencies, Metals, Stocks, Indices.  All Timeframe All Brokers All type of Trading S
Limitless MT5
Dmitriy Kashevich
Limitless MT5 is a universal indicator suitable for every beginner and experienced trader. works on all currency pairs, cryptocurrencies, raw stocks Limitless MT5 - already configured and does not require additional configuration And now the main thing Why Limitless MT5? 1 complete lack of redrawing 2 two years of testing by the best specialists in trading 3 the accuracy of correct signals exceeds 80% 4 performed well in trading during news releases Trading rules 1 buy signal - the ap
FiboChampion
Marius Ovidiu Sunzuiana
The Next Evolution in Fibonacci Intelligence FiboChampion  isn’t just another Fibonacci tool—it’s a paradigm shift in how traders interpret price action. Engineered for precision and adaptability, this advanced indicator fuses quantum-inspired logic , machine-learned pattern recognition , and non-linear Fibonacci geometry to uncover market turning points with uncanny accuracy. What Sets FiboChampion Apart: Non-Linear Fibonacci Mapping : Goes beyond static retracements by adapting to fractal m
TheStrat FTFC MT5
Robert Gerald Wood
FTFC si riferisce alla Full Timeframe Continuity come definita da   The Strat   di Rob Smith. Questo indicatore disegna due linee sul grafico, una delle più alte tra i livelli di apertura trimestrale, mensile, settimanale, giornaliera o oraria e la seconda tra i più bassi di questi valori. Questo ti dà un canale sopra o sotto il quale è più probabile che il trading sia molto fortemente in una direzione. Tra le righe, l'azione dei prezzi sarà più instabile e potresti utilizzare stop più ampi. Vie
ndicatore Monthly Levels + Pin Bar Pro Descrizione L’indicatore Monthly Levels + Pin Bar Pro combina i livelli chiave mensili (Massimo, Minimo, Apertura, Chiusura) con il rilevamento automatico dei pattern di inversione Price Action (Pin Bars) . Progettato per trader tecnici e istituzionali, aiuta a prevedere le zone di reazione del mercato e genera segnali chiari sul grafico. Caratteristiche principali Livelli mensili automatici : Massimo, Minimo, Apertura, Chiusura. Rilevamento Pin
LevelsFib DTZ
Vitaliy Davydov
The combined Levels Ib DTZ indicator helps to determine the trend direction when trading. Displaying signals on the chart about a possible upcoming trend change. The indicator is a combination of Fibonacci levels with overbought and oversold zones and a trend indicator based on ZigZag and ATR indicators. The Levels Ib DTZ indicator helps traders predict future price movements and adjust their strategy accordingly. It works on all timeframes.
Risk Guardian Pro
Henry Armando Baltazar
️ Risk Guardian Pro V7.62 | Control de DRAWDOWN y GESTIÓN DE RIESGO con Presupuesto Diario (Ideal para Prop Firms) ¡Controla tu Presupuesto de Riesgo Diario, Evita la Sobreoperación y Activa el Plan de Recuperación Automático tras Pérdidas!   Risk Guardian Pro V7.62 es la herramienta esencial de Gestión de Riesgo Inteligente diseñada para traders que operan en Cuentas de Fondeo (Prop Firms) y cuentas personales. Este indicador funciona como un monitor de cabina inteligente en tiempo real, tra
Kingtrend
Antonio Blazquez
KingTrend — Price Action Trend Analysis Tool KingTrend is a trend-following indicator based on long-standing price action principles involving Highs, Lows, Open, and Close. The logic behind this tool comes from concepts passed on to me by my mentor and translated into code for consistent structure recognition. Features: Identifies market structure using price action logic Detects trend direction and key turning points Marks Higher Highs, Lower Lows, and extensions Suitable for discretionary or
Linear Regression Channel (MTF) Indicator The Linear Regression Channel MTF is an advanced technical indicator that uses statistical analysis to plot a linear regression channel on the price chart, with the capability to display data from a different time frame (Multi Time Frame) for enhanced trend accuracy and analysis. Key Features of the Indicator: Main Line (Linear Regression Line): Represents the overall price trend over the selected period, allowing traders to easily observe the general s
FREE
Engulfing with EMAs Indicator Unlock the power of advanced candlestick pattern detection with the Engulfing with EMAs Indicator , a cutting-edge tool designed for MetaTrader 5. This futuristic indicator combines the precision of engulfing pattern analysis with the trend-following strength of Exponential Moving Averages (EMA 21 and EMA 50), empowering traders to identify high-probability setups across all currency pairs and timeframes. Key Features: Comprehensive Engulfing Detection : Detects b
Alien Scalper MTF
Gianfranco Piccolo
Rivoluziona il Tuo Trading con l'Indicatore di Segnali Scalping su Timeframe Multipli   Scopri il segreto del successo nel trading con il nostro esclusivo indicatore di SEGNALI scalping su timeframe multipli. Questo strumento avanzato è progettato per trovare segnali efficienti e precisi, aiutandoti a massimizzare i profitti e a ridurre i rischi associati al trading veloce L'indicatore di segnali Alien Scalper MTF è uno strumento di analisi tecnica altamente efficace, progettato per identificare
Anchored Linear Regression Channel
Jorge Adalberto Do Valle Junior
English: Anchored Linear Regression Channel (ALRC) Description: The Anchored Linear Regression Channel (ALRC) is an advanced technical analysis tool that enhances the traditional linear regression channel by allowing it to be anchored to a confirmed pivot point. This provides a more accurate and reliable reading of price behavior in relation to key structural points on the chart. Key Features: Anchoring to Confirmed Pivots: Manually select a significant pivot to fix the channel, ensuring t
Ticks Candles Chart indicator build equi-volume candles and designed for Oracle Strategy The Period in ticks is set directly on the chart Tick chart opens in a separate window Recommended to use tick periods from 50 and above Works on real time only Input Parameters Ticks_In_Bar - default period in ticks Counting_Bars - how many tick bars of history to build Custom_Symbol_Suffix - additional suffix for symbols
Dynamic Market Insights for Smart Trading Our goal is to provide seamless, high-quality services that empower market participants, traders, and analysts with real-time market insights and key indicators for informed decision-making. Advanced & User-Friendly Trend Analysis This is a cutting-edge, highly robust, and easy-to-use dynamic trend analysis indicator. The  DYJ Market Watch Indicator  evaluates market bullish and bearish strength using two distinct methods—each designed to measure differe
This is a powerful multi cycle, multi currency pair, and multi indicator monitoring tool for MT5 version, with main functions including: 1. Monitor real-time performance of multiple indicators, including RSI, MACD, MA, and STO. 2. Monitor multiple currency pairs, customizable to add or delete currency pairs, and automatically update indicators. 3. Monitor multiple currency pairs over multiple cycles. 4. After clicking, you can directly switch to the chart and cycle you want to view. 5. Click th
Buy Sell Chill Indicator
Santino Emanuele Ventre
Take the stress out of trading with the Buy Sell Chill Indicator —your ultimate companion for effortless trend identification. This easy-to-use tool gives you a clear visual arrow to show the direction the market is about to take, making trading decisions as simple and "chill" as possible. Why Choose the Buy Sell Chill Indicator? Relaxed and Intuitive : Designed to make trading less stressful and more enjoyable by giving you straightforward signals with no clutter. Customizable Features : ATR Pe
AIS MT5 INDICATOR 5 ALL INCLLUSIVE SET GUIDE CHAPTER 1  IMPORTANT INFORMATION <1> THIS INDICATOR IS ONE OF THE SERIES OF NEW AIS INDICATORS AIS MT5 INDICATOR 1 =ADVANCED CLASSIC= AIS MT5 INDICATOR 2 =MULTIFRAMES= AIS MT5 INDICATOR 3 =LINES= AIS MT5 INDICATOR 4 =MARKET PROFILES= AIS MT5 INDICATOR 5 =ALL INCLUSIVE SET CHAPTER 2 GENERAL FEATURES OF THE SERIES <1> AIS MT5 INDICATOR 1 =ADVANCED CLASSIC= < DEVELOPMENT PAUSED >     DISPLAYS MAIN TIME POINTS AND PRICE LEVELS OF THE CHART      SUCH
### EMA Oscillator Analysis   **Working Principle:**   1. **Main Line Calculation (BufferV):**      - Computes price deviation from adaptive EMA.      - Formula: `BufferV[i] = Close[i] - (alpha * Close[i] + (1-alpha) * BufferV[i-1])`      - Where `alpha = 2/(ema_period+1)`.   2. **Volatility Bands:**      - `BufferDev`/`BufferNegDev`: ±1 standard deviation.      - `BufferDevLimit`/`BufferNegDevLimit`: ±2 standard deviations (multiplied by `limit_factor`).      - Standard deviation is calculate
Libera la potenza di Fibonacci con l’Adaptive Fibonacci Trend Ribbon (AFTR)! Sei pronto a rivoluzionare la tua strategia di trading? AFTR non è solo un indicatore, è il tuo strumento definitivo per individuare i trend, analizzare le inversioni e prendere decisioni precise con chiarezza senza eguali. Costruito con l'allineamento delle sequenze di Fibonacci e un insieme di medie mobili avanzate, questo indicatore è pensato per i trader che esigono precisione e flessibilità.  Caratteristiche princi
SMMA Bands Indicator
Elie Baptiste Granger
The SMMA Bands indicator is an advanced volatility-based trading tool that creates 6 dynamic support and resistance levels around an envelope formed by two Smoothed Moving Averages (SMMA).  This indicator combines the reliability of SMMA trend identification with the precision of standard deviation-based volatility bands, making it suitable for both trend-following and mean-reversion strategies. Every band has its own buffer for use in EA. feel free to make suggestions and add reviews , i will
Spike detector pro
Rocky Clyde Van Coller
the Spike detector show multiple indication for entries, for max profits enter on each indication  given u can also add on lots size as entries go to secure max profits before spike occure, the more entries you enter  along the way ,the more profits u have after the initial spike, after spike hold 3-5 candles before close for max profits .  good on al timeframes max stop loss  is 22candles.
PZ Mean Reversion MT5
PZ TRADING SLU
3 (2)
Indicatore unico che implementa un approccio professionale e quantitativo al trading di reversione. Sfrutta il fatto che il prezzo devia e ritorna alla media in modo prevedibile e misurabile, il che consente regole di entrata e uscita chiare che superano di gran lunga le strategie di trading non quantitative. [ Installation Guide | Update Guide | Troubleshooting | FAQ | All Products ] Segnali di trading chiari Incredibilmente facile da scambiare Colori e dimensioni personalizzabili Implementa l
The Antique Trend Indicator is a revolutionary trend trading and filtering solution with all the important features of a trend tool built into one tool! The Antique Trend indicator is good for any trader, suitable for any trader both for Forex and binary options. There is no need to configure anything, everything has been perfected by time and experience, it works great during flats and trends. The Antique Trend indicator is a tool for technical analysis of financial markets, reflecting curren
Trend and Signals MT5  indicator scans  30 trading Instruments (Forex, Metals and Indices).     It uses special algorithm on the  current market   based on   Pure Price Action   and display the overall trend and signal on the dashboard. When signals are produced the indicator sends alert and notification. Strategy for Signals This indicator uses the daily timeframe to determine the direction of the trend. The hourly timeframe is used to identify possible entries. Main trend and is determined by
Manyal trading system, CovEchoTrend Robot, focuses on reliability and flexibility. By employing statistical analysis methods to study the relationships between the base indicator and market patterns, the system enables a deeper understanding of market processes. Intelligent pattern analysis: The application of statistical data processing helps identify key trend reversal points more accurately, signaling significant market shifts. Informed decision-making is based on the intersection of indicato
Heat Map OSW
William Oswaldo Mayorga Urduy
OSW MAPPA TESTA Questo indicatore è ideale per conoscere lo stato attuale di tutte le combinazioni di valute e per conoscerne la variazione. La variazione è calcolata dallo spostamento percentuale del prezzo dal prezzo corrente a 24 ore fa, o quanto configurato nel menu. Per conoscere la variazione di una valuta, devi semplicemente guardare la valuta principale, ad esempio: nell'EUR devi guardare verticalmente per confrontare con altre valute e alla fine trovi la media di tutti questi valor
BeST Swing Strategy MT5 is a Metatrader indicator based on the corresponding Jim Berg's work about volatility as described in his article "The Truth About Volatitlity" (TASC 2/2005).The indicator consists of 2 channel lines deriving as (MA+/- times the ATR) and can be used as a standalone trading system.The outlier prices of the Market as of the indicator's values can be used for producing Entry and Exit Signals. Advantages of the indicator == Uses 2 Swing Strategies == Never repaints its Sig
Range Directional Force Indicator – Designed for You to Optimize! The Range Directional Force Indicator is a cutting-edge tool designed to empower traders by visualizing market dynamics and directional strength. Built to offer insights into market trends and reversals, this indicator is an invaluable asset for traders seeking precision in their strategies. However, it is important to note that this indicator is not optimized, leaving room for you to tailor it to your unique trading preferences.
Gli utenti di questo prodotto hanno anche acquistato
Divergence Bomber
Ihor Otkydach
4.96 (77)
Ogni acquirente dell’indicatore riceverà inoltre gratuitamente: L’utilità esclusiva “Bomber Utility”, che gestisce automaticamente ogni operazione, imposta i livelli di Stop Loss e Take Profit e chiude le posizioni secondo le regole della strategia I file di configurazione (set file) per adattare l’indicatore a diversi asset I set file per configurare il Bomber Utility in tre modalità: “Rischio Minimo”, “Rischio Bilanciato” e “Strategia di Attesa” Una guida video passo-passo per installare, conf
Azimuth Pro
Ottaviano De Cicco
5 (1)
LAUNCH PROMO Azimuth Pro price is initially set at 299 $ for the first 100 buyers. Final price will be 499 $ . THE DIFFERENCE BETWEEN RETAIL AND INSTITUTIONAL ENTRIES ISN'T THE INDICATOR — IT'S THE LOCATION. Most traders enter at arbitrary price levels, chasing momentum or reacting to lagging signals. Institutions wait for price to reach structured levels where supply and demand actually shift. Azimuth Pro maps these levels automatically: swing-anchored VWAP, multi-timeframe structure lines,
Quantum TrendPulse
Bogdan Ion Puscasu
5 (20)
Ecco   Quantum TrendPulse   , lo strumento di trading definitivo che combina la potenza di   SuperTrend   ,   RSI   e   Stocastico   in un unico indicatore completo per massimizzare il tuo potenziale di trading. Progettato per i trader che cercano precisione ed efficienza, questo indicatore ti aiuta a identificare con sicurezza le tendenze di mercato, i cambiamenti di momentum e i punti di entrata e uscita ottimali. Caratteristiche principali: Integrazione SuperTrend:   segui facilmente l'andame
Grabber System MT5
Ihor Otkydach
4.81 (21)
Ti presento un eccellente indicatore tecnico: Grabber, che funziona come una strategia di trading "tutto incluso", pronta all’uso. In un solo codice sono integrati strumenti potenti per l’analisi tecnica del mercato, segnali di trading (frecce), funzioni di allerta e notifiche push. Ogni acquirente di questo indicatore riceve anche gratuitamente: L’utility Grabber: per la gestione automatica degli ordini aperti Video tutorial passo dopo passo: per imparare a installare, configurare e utilizzare
ARIPoint
Temirlan Kdyrkhan
1 (1)
ARIPoint is a powerful trading companion designed to generate high-probability entry signals with dynamic TP/SL/DP levels based on volatility. Built-in performance tracking shows win/loss stats, PP1/PP2 hits, and success rates all updated live. Key Features: Buy/Sell signals with adaptive volatility bands Real-time TP/SL/DP levels based on ATR Built-in MA Filter with optional ATR/StdDev volatility Performance stats panel (Success, Profit/Loss, PP1/PP2) Alerts via popup, sound, push, or email Cu
Gartley Hunter Multi
Siarhei Vashchylka
5 (11)
Gartley Hunter Multi - An indicator for searching for harmonic patterns simultaneously on dozens of trading instruments and on all possible timeframes. Manual (Be sure to read before purchasing) | Version for MT4 Advantages 1. Patterns: Gartley, Butterfly, Shark, Crab. Bat, Alternate Bat, Deep Crab, Cypher 2. Simultaneous search for patterns on dozens of trading instruments and on all possible timeframes 3. Search for patterns of all possible sizes. From the smallest to the largest 4. All fou
Weis Wave with Alert MT5
Trade The Volume Waves Single Member P.C.
4.94 (17)
Rental/Lifetime Package Options and Privileges  Rent Monthly Six Months   Yearly/Lifetime Weis Wave with Speed with Alert+Speed Index x x x Manual  x x x Quick Set up Video x x x Blog x x x Lifetime Updates x x x Setup and Training Material x x Discord Access Channel "The SI traders"          x Rectangle Break Alert Tool      x How to trade with it:    http://www.tradethevolumewaves.com   ** If you purchase please contact me to setup your  : Training Room and  complete manual access.  Wei
Innanzitutto, vale la pena sottolineare che questo Strumento di Trading è un Indicatore Non-Ridipingente, Non-Ridisegnante e Non-Laggante, il che lo rende ideale per il trading professionale. Corso online, manuale utente e demo. L'Indicatore Smart Price Action Concepts è uno strumento molto potente sia per i nuovi che per i trader esperti. Racchiude più di 20 utili indicatori in uno solo, combinando idee di trading avanzate come l'Analisi del Trader del Circolo Interno e le Strategie di Tradin
MTF Supply Demand Zones MT5
Georgios Kalomoiropoulos
5 (1)
Nuova generazione di zone di domanda e offerta automatizzate. Algoritmo nuovo e innovativo che funziona su qualsiasi grafico. Tutte le zone vengono create dinamicamente in base all'azione dei prezzi del mercato. DUE TIPI DI AVVISI --> 1) QUANDO IL PREZZO RAGGIUNGE UNA ZONA 2) QUANDO SI FORMA UNA NUOVA ZONA Non ottieni un altro indicatore inutile. Ottieni una strategia di trading completa con risultati comprovati.     Nuove caratteristiche:     Avvisi quando il prezzo raggiunge la zona di
ACB Breakout Arrows MT5
KEENBASE SOFTWARE SOLUTIONS
5 (1)
L’indicatore ACB Breakout Arrows fornisce un segnale di ingresso fondamentale nel mercato rilevando uno specifico pattern di breakout. L’indicatore analizza costantemente il grafico per individuare un momentum stabile in una direzione e fornisce un segnale preciso subito prima del movimento principale. Ottieni lo scanner multi-simbolo e multi-timeframe da qui - Scanner per ACB Breakout Arrows MT5 Caratteristiche principali I livelli di Stop Loss e Take Profit sono forniti automaticamente dall’
Trend Forecaster
Alexey Minkov
5 (7)
The Trend Forecaster indicator utilizes a unique proprietary algorithm to determine entry points for a breakout trading strategy. The indicator identifies price clusters, analyzes price movement near levels, and provides a signal when the price breaks through a level. The Trend Forecaster indicator is suitable for all financial assets, including currencies (Forex), metals, stocks, indices, and cryptocurrencies. You can also adjust the indicator to work on any time frames, although it is recommen
Trend Flow PRO
Aliaksandr Alferchyk
TREND FLOW PRO TREND FLOW PRO is a non-repainting indicator that shows the market direction. It identifies trend reversals, as well as initial and repeated entries of major market participants. BOS marks on the chart represent true trend changes and key higher-timeframe levels. The data does not repaint and remains on the chart after each bar closes. Request and receive a detailed PDF guide with strategy examples via private messages. Main indicator elements: BOS FLOW – trend waves and real tre
SynaptixQuant Dominance Matrix
Devie Arevalo Montemayor
5 (1)
SynaptixQuant Dominance Matrix: Institutional-Grade Market State Extraction Engineered for traders who require a data-driven view of market behaviour beyond surface-level indicators. The Synaptix Quant (SQ) Dominance Matrix is not a conventional currency strength display. Behind its intentionally streamlined interface runs a sophisticated analytical architecture designed to quantify market conditions with precision. Every output is generated through layered signal processing built to identify d
Elliott Wave Trend was designed for the scientific wave counting. This tool focuses to get rid of the vagueness of the classic Elliott Wave Counting using the guideline from the template and pattern approach. In doing so, firstly Elliott Wave Trend offers the template for your wave counting. Secondly, it offers Wave Structural Score to assist to identify accurate wave formation. It offers both impulse wave Structural Score and corrective wave Structure Score. Structural Score is the rating to sh
Trade smarter, not harder: Empower your trading with Harmonacci Patterns This is arguably the most complete harmonic price formation auto-recognition indicator you can find for the MetaTrader Platform. It detects 19 different patterns, takes fibonacci projections as seriously as you do, displays the Potential Reversal Zone (PRZ) and finds suitable stop-loss and take-profit levels. [ Installation Guide | Update Guide | Troubleshooting | FAQ | All Products ] It detects 19 different harmonic pri
How many times have you bought a trading indicator with great back-tests, live account performance proof with fantastic numbers and stats all over the place but after using it, you end up blowing your account? You shouldn't trust a signal by itself, you need to know why it appeared in the first place, and that's what RelicusRoad Pro does best! User Manual + Strategies + Training Videos + Private Group with VIP Access + Mobile Version Available A New Way To Look At The Market RelicusRoad is the
PZ Swing Trading MT5
PZ TRADING SLU
5 (5)
Protect against whipsaws: revolutionize your swing trading approach Swing Trading is the first indicator designed to detect swings in the direction of the trend and possible reversal swings. It uses the baseline swing trading approach, widely described in trading literature. The indicator studies several price and time vectors to track the aggregate trend direction and detects situations in which the market is oversold or overbought and ready to correct. [ Installation Guide | Update Guide | Tro
Advanced Supply Demand MT5
Bernhard Schweigert
4.5 (14)
La migliore soluzione per qualsiasi principiante o trader esperto! Questo indicatore è uno strumento di trading unico, di alta qualità e conveniente perché abbiamo incorporato una serie di funzionalità proprietarie e una nuova formula. Con questo aggiornamento, sarai in grado di mostrare fusi orari doppi. Non solo potrai mostrare una TF più alta, ma anche entrambe, la TF del grafico, PIÙ la TF più alta: SHOWING NESTED ZONES. Tutti i trader di domanda di offerta lo adoreranno. :) Informazioni imp
PZ Divergence Trading MT5
PZ TRADING SLU
3.71 (7)
Unlock hidden profits: accurate divergence trading for all markets Tricky to find and scarce in frequency, divergences are one of the most reliable trading scenarios. This indicator finds and scans for regular and hidden divergences automatically using your favourite oscillator. [ Installation Guide | Update Guide | Troubleshooting | FAQ | All Products ] Easy to trade Finds regular and hidden divergences Supports many well known oscillators Implements trading signals based on breakouts Displays
Bill Williams Advanced
Siarhei Vashchylka
5 (10)
Bill Williams Advanced is designed for automatic chart analysis using Bill Williams' "Profitunity" system. The indicator analyzes four timeframes at once. Manual (Be sure to read before purchasing) Advantages 1. Analyzes the chart using Bill Williams' "Profitunity" system. Signals are displayed in a table in the corner of the screen and on the price chart. 2. Finds all known AO and AC signals, as well as zone signals. Equipped with a trend filter based on the Alligator. 3. Finds "Divergence Bar
Top indicator for MT5   providing accurate signals to enter a trade without repainting! It can be applied to any financial assets:   forex, cryptocurrencies, metals, stocks, indices .  Watch  the video  (6:22) with an example of processing only one signal that paid off the indicator! MT4 version is here It will provide pretty accurate trading signals and tell you when it's best to open a trade and close it. Most traders improve their trading results during the first trading week with the help of
TPSproTREND PrO MT5
Roman Podpora
4.74 (19)
TPSproTrend PRO identifica il momento in cui il mercato cambia effettivamente direzione e forma un punto di ingresso all'inizio del movimento. Si entra nel mercato quando il prezzo sta appena iniziando a muoversi, e non dopo che il movimento si è già verificato.   Indicatore       Non ridisegna i segnali e visualizza automaticamente i punti di ingresso, lo Stop Loss e il Take Profit, rendendo il trading chiaro, visivo e strutturato. ISTRUZIONI RUS   -   VERSIONE MT4 Vantaggi principali Segnali
Berma Bands
Muhammad Elbermawi
5 (7)
L'indicatore Berma Bands (BBs) è uno strumento prezioso per i trader che cercano di identificare e capitalizzare i trend di mercato. Analizzando la relazione tra il prezzo e le BBs, i trader possono discernere se un mercato è in una fase di trend o di range. Visita il [ Berma Home Blog ] per saperne di più. Le Berma Bands sono composte da tre linee distinte: la Upper Berma Band, la Middle Berma Band e la Lower Berma Band. Queste linee sono tracciate attorno al prezzo, creando una rappresentazion
Quantum Trend Sniper
Bogdan Ion Puscasu
4.74 (53)
Presentazione       Quantum Trend Sniper Indicator   , l'innovativo indicatore MQL5 che sta trasformando il modo in cui identifichi e scambi le inversioni di tendenza! Sviluppato da un team di trader esperti con un'esperienza di trading di oltre 13 anni,       Indicatore Quantum Trend Sniper       è progettato per spingere il tuo viaggio di trading verso nuove vette con il suo modo innovativo di identificare le inversioni di tendenza con una precisione estremamente elevata. *** Acquista Quantum
FootprintOrderflow
Jingfeng Luo
5 (3)
FOOTPRINTORDERFLOW: The Authoritative Guide ( This indicator is also compatible with economic providers that do not offer DOM data and BID/ASK data, It also supports various foreign exchange transactions ) 1. Overview FOOTPRINTORDERFLOW  is an advanced Order Flow analysis tool designed for MetaTrader 5 (MT5). Unlike traditional candlestick charts that only show OHLC (Open, High, Low, Close), this indicator parses real-time Tick data to visualize the microstructure inside every candle. It helps y
+++++++++++++++++++++++++++++++++++++++++++++++++++++++++++++++++++++++++++++++++++++++++++++++++ +++ Link to EURUSD Only Free Version -->  https://www.mql5.com/en/market/product/156904?source=Unknown +++++++++++++++++++++++++++++++++++++++++++++++++++++++++++++++++++++++++++++++++++++++++++++++++ Hallo Trader, This is a traditional GANN & FIBONACCI strategy based on detection of an impulsive move in the opposite direction. This is called a Breakout. At the moment of Breakout, the indicator draw
Stop calculating lot sizes manually. Stop guessing your Risk/Reward ratio. The Risk Reward Tool brings the intuitive, visual trading style of TradingView directly to your MetaTrader 5 charts. It is designed for traders who value speed, precision, and visual clarity. Whether you trade Forex, Indices (DAX, US30), or Commodities (Gold, Oil), this tool handles the math for you. Simply click "Long" or "Short," drag the lines to your levels, and the tool instantly tells you exactly how many lots to t
Hyperbolic
Konstantin Gruzdev
The indicator is stable on noise fluctuations in price and quickly reacts to the trend. It is based on an algorithm from a system of hyperbolic functions that allows you to aggressively smooth the flat with minimal lag on the trend. It can be applied directly to the price chart, to itself, or to other indicators in order to eliminate false signals. The main purpose of the indicator is to smooth out small sawtooth price movements as much as possible. The higher the Hyperbolic parameter, the stron
Prices move for many reasons and these can vary from one operator to another: software, private and institutional traders simultaneously contribute to the formation of the price, making predictive art very difficult. However, there are measurable factors that bind the price to an underlying trend in line with the physical reality that the financial asset represents: these are the macroeconomic indicators. Large investors use this information wisely to set their strategies. Understanding these m
Matreshka
Dimitr Trifonov
5 (2)
Matreshka self-testing and self-optimizing indicator: 1. Is an interpretation of the Elliott Wave Analysis Theory. 2. Based on the principle of the indicator type ZigZag, and the waves are based on the principle of interpretation of the theory of DeMark. 3. Filters waves in length and height. 4. Draws up to six levels of ZigZag at the same time, tracking waves of different orders. 5. Marks Pulsed and Recoil Waves. 6. Draws arrows to open positions 7. Draws three channels. 8. Notes support and re
Altri dall’autore
//////////////////////////////////////////////// ////////////////////////////////// An improved version of the standard Bulls Power and Bears Power indicators. Now it's two in one. The setup is simple - you just need to specify the period. It is also very easy to understand the readings of this indicator, a signal above zero is a buy, and below it is a sell. //////////////////////////////////////////////// /////////////////////////////////// I hope this indicator will be very useful to you
FREE
An improved version of the standard Standard Deviation indicator. It is now a responsive and smoothed line. The setup is not straightforward - but I hope you can do it. It is very easy to understand the readings of this indicator, the meaning is the same as that of the usual Standard Deviation. //////////////////////////////////////////////// /////////////////////////////////// I hope this indicator will be very useful to you in successful trading. Good luck.
FREE
//////////////////////////////////////////////// ////////////////////////////////// An improved version of the standard Average True Range indicator. It is now a responsive and smoothed line. The setup is not straightforward - but I hope you can do it. It is very easy to understand the readings of this indicator, the meaning is the same as that of the standard Average True Range. //////////////////////////////////////////////// /////////////////////////////////// I hope this indicator will
FREE
This expert is designed to work in pairs with the same indicator. https://www.mql5.com/ru/market/product/34836 The expert does not display anything on the screen and does not trade. It only performs calculations for the indicator, this is done to save your computer resources. Since the expert works with symbols from Market Watch, there is no way to test it in the tester. Instructions for use: 0) Select the required symbols in the Market Watch, which will be displayed in the indicator. (Note: !!
FREE
VScale Live Expert
Igor Gerasimov
4 (1)
The indicator now includes vertical volumes. !!!! The indicator now includes a forecasting module !!!!. If you want to stop annoying messages use this expert together with the purchased paid indicator "V-Scale Live Trainer". Manual trading only. A simple expert makes traders lives easier. Note: To use it, just enable one-click trading. And don't forget to disable AUTO_TRADE. With each new start of the terminal, the metatrader 4, immediately, about two times, switch between all the timeframes i
FREE
An improved version of the standard Standard Deviation indicator. It is now a responsive and smoothed line. The setup is not straightforward - but I hope you can do it. It is very easy to understand the readings of this indicator, the meaning is the same as that of the usual Standard Deviation. //////////////////////////////////////////////// /////////////////////////////////// I hope this indicator will be very useful to you in successful trading. Good luck.
FREE
This expert is designed to work in pairs with the same indicator. https://www.mql5.com/ru/market/product/34834 The expert does not display anything on the screen and does not trade. It only performs calculations for the indicator, this is done to save your computer resources. Since the expert works with symbols from Market Watch, there is no way to test it in the tester. Instructions for use: 0) Select the required symbols in the Market Watch, which will be displayed in the indicator. (Note: !!
FREE
//////////////////////////////////////////////// //////////////////////////////////////////////// ///////////////////////////////////// Go My Way is an ultra-accurate indicator of trend direction or price movement. This indicator is calculated on the basis of a dozen other indicators and has a very complex mechanism. //////////////////////////////////////////////// //////////////////////////////////////////////// ///////////////////////////////////// The settings are very simple, but it is
//////////////////////////////////////////////// ////////////////////////////////// This indicator uses polynomial regression to plot three channels and six lines accordingly. The first channel and its borders with a large period, the second with an average and the third with a small period. The setup is simple - you only need to specify the colors and enable / disable the display of price labels. It is also very easy to understand the readings of this indicator. Channel lines are used to set s
It's very simple - there are no settings. It is required to specify only the colors and the size of the arrows. It is also very easy to understand the readings of this indicator. An up arrow is a buy signal, and a down arrow is a sell signal. Try to test it in the strategy tester - you'll like it !!! //////////////////////////////////////////////// /////////////////////////////////// I hope this indicator will be very useful to you in successful trading. Good luck.
Questo è un grafico tick in secondo formato. C'è il supporto per OpenCL. Le impostazioni sono molto semplici: puoi selezionare i giorni della settimana per i quali verrà calcolato l'indicatore: ad esempio, per tali strumenti finanziari, le cui quotazioni non vengono aggiornate nei fine settimana, è necessario selezionare un qualsiasi altro giorno della settimana per il 6 e il 7 giorno, ma, ad esempio, per bitcoin, se il broker aggiorna le quotazioni, è possibile specificare per il 6 giorno -
//////////////////////////////////////////////// ////////////////////////////////// An improved version of the standard Average True Range indicator. This is now double the precision and a colored a veraging  line. The setup is quite simple - you need to specify the main period and the averaging period. It is very easy to understand the readings of this indicator, the meaning is the same as that of the standard Average True Range. //////////////////////////////////////////////// //////////
//////////////////////////////////////////////// ////////////////////////////////// This indicator displays the range of price changes in 1 minute. Great for risk management. This is an improved version of the standard Average True Range indicator for Tick Chart. This is now double the precision and a colored averaging line. The setting is quite simple - you just need to change the colors if necessary. It is very easy to understand the readings of this indicator, the meaning is the same as
Filtro:
Nessuna recensione
Rispondi alla recensione