ADR Alert Dashboard MT5
- Göstergeler
- LEE SAMSON
- Sürüm: 1.0
- Etkinleştirmeler: 10
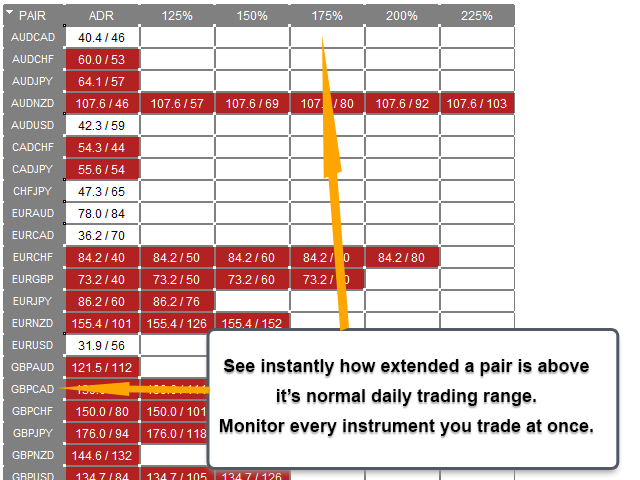
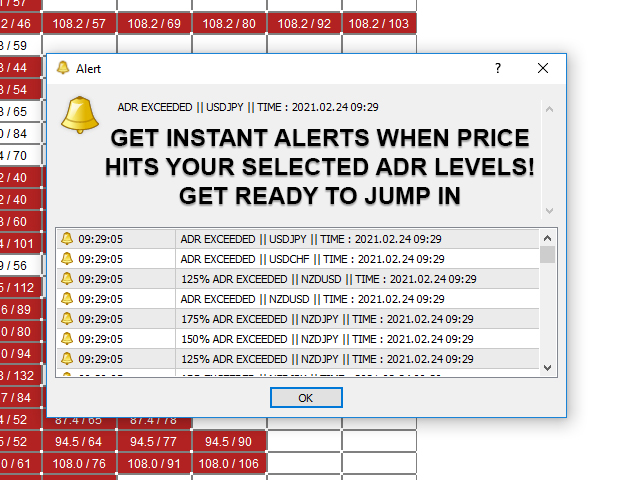
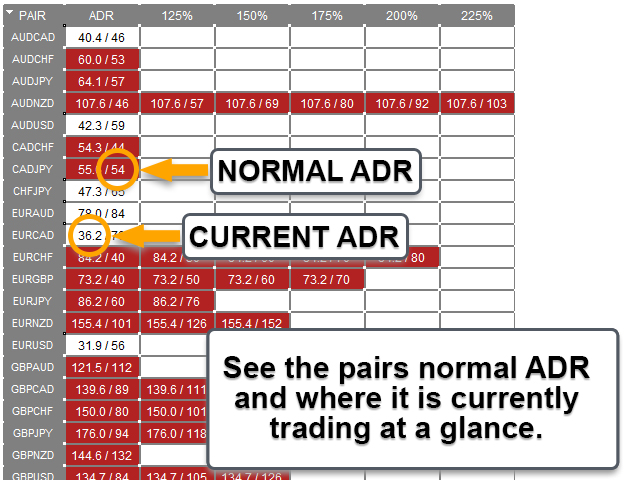
ADR Uyarı Gösterge Tablosu, normal ortalama günlük aralığa göre fiyatın şu anda nerede işlem gördüğünü bir bakışta size gösterir. Fiyat, ortalama aralığı ve seçtiğiniz seviyenin üzerindeki seviyeleri aştığında, açılır pencere, e-posta veya push yoluyla anında uyarılar alacaksınız, böylece hızlı bir şekilde geri çekilmelere ve geri dönüşlere atlayabilirsiniz. Çizgi, boş bir çizelgeye yerleştirilmek üzere tasarlanmıştır ve sadece arka planda oturun ve seviyelere ulaşıldığında sizi uyarır, böylece oturup izlemenize, hatta bakmanıza bile gerek kalmaz!
MT4 VERSİYONU BURADA MEVCUTTUR: https://www.mql5.com/en/market/product/62756
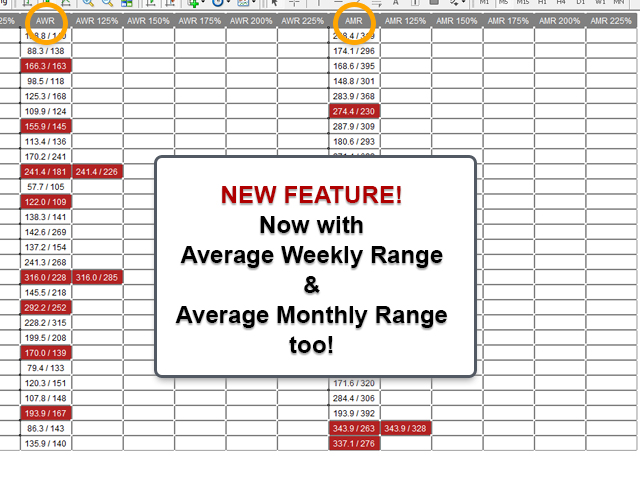
YENİ: Artık size ortalama HAFTALIK ve AYLIK aralıkları ve bunlara ilişkin uyarıları da gösteriyor!
SEVİYELERİ GRAFİĞİNİZDE ÇİZEN ADR TERSİNE DÖNÜŞ GÖSTERGESİNİ DA BURADAN ALABİLİRSİNİZ: https://www.mql5.com/en/market/product/64477
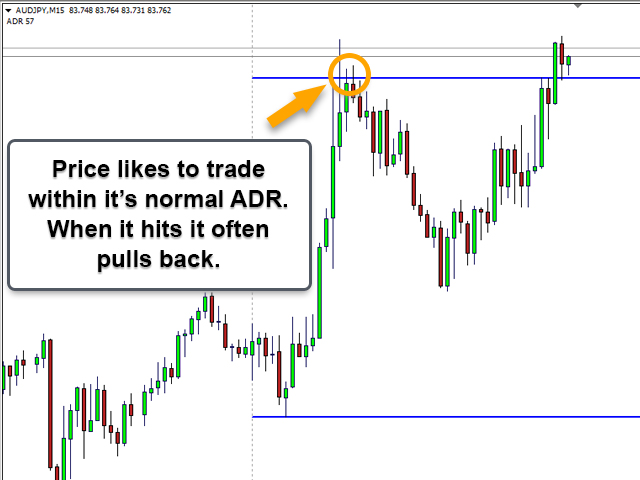
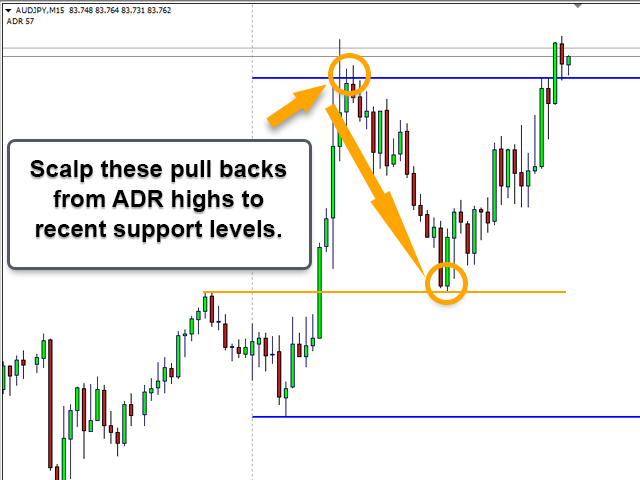
Zamanın yaklaşık %60'ı, normal ortalama günlük aralık (ADR) içinde işlem görür ve bu seviyelerin üzerindeki itmeler, genellikle, onu tipik olarak bir geri çekme (kâr alma) hareketinin izleyeceği keskin bir fiyat hareketinin bir göstergesidir. Günlük aralığın üstünden veya altından en son destek veya direnç seviyesine geri çekilme ticareti yaparak bu keskin hareketlerden yararlanabilirsiniz.
Büyük forex çiftleri ve çeşitli çaprazlar için fiyatın belirli ADR seviyelerinin ötesine geçme olasılığının ortalama yüzdesini bulmak için 20 yılı aşkın geçmiş veriler toplandı. Bu veriler, fiyatın ADR'sinin %3'ünün yalnızca %200'ünün ötesine geçtiğini, yani bu seviyede bir geri dönüş veya geri çekilme ihtimalinizin %97 olacağı anlamına geliyor!!!
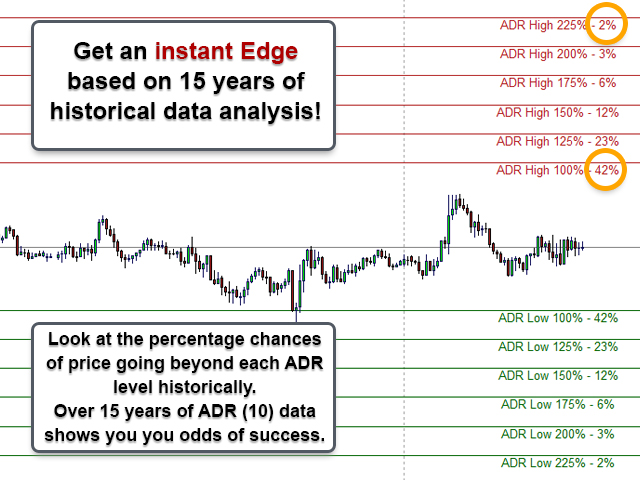
Bunlar, veriler tarafından gösterilen ADR uzantısı ortalamalarıdır:
Fiyat, zamanın yaklaşık %42'sinde ADR10'un %100'ünü aştı.
Fiyat, zamanın yaklaşık %23'ünde ADR10'un %125'ini aştı.
Fiyat, zamanın yaklaşık %12'sinde ADR10'un %150'sini aştı.
Fiyat, zamanın yaklaşık %6'sında ADR10'un %175'ini aştı.
Fiyat, zamanın yaklaşık %3'ünde ADR10'un %200'ünü aştı.
Fiyat, zamanın yaklaşık %2'sinde ADR10'un %225'ini aştı.
Yukarıdaki seviyelerden de görebileceğiniz gibi, fiyat normal ADR'sinin %150'sine ulaşırsa, daha ileri gitme olasılığı sadece %12'dir ve size büyük bir avantaj sağlar. Fiyat hareketinin size o seviyede bir dönüş işaretleri göstermesini bekleyin ve geri çekilmeye başlayın!
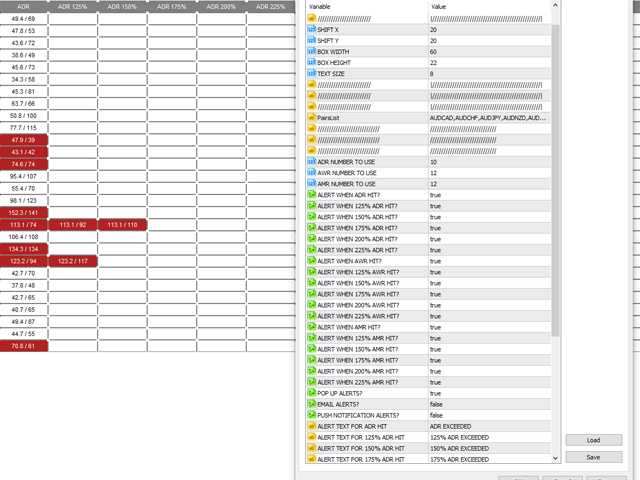
Pano Ayarları:
Panonun konumunu ayarlayın ve kutuların ve metnin boyutunu değiştirin.
İzlemek istediğiniz çiftleri seçin ve gerekirse broker önekinizi veya son ekinizi girin.
Seviyeler için hangi ADR numarasının kullanılacağını seçin (varsayılan ADR10'dur ve veri analizi neye dayanır).
Vurulduğunda hangi seviyelerde uyarı almak istediğinizi seçin.
Açılır pencerelerden, e-postalardan veya anlık uyarılardan almak istediğiniz uyarı türlerini seçin.
Her seviye için istediğiniz metin uyarısını seçin.
Giriş Stratejisi Fikri:
Fiyatın belirli bir seviyeye gelmesini ve uyarı almasını bekleyin. Seviye ne kadar yüksek olursa, geri alma şansı o kadar iyi olur, ancak alacağınız uyarı sayısı o kadar az olur. Bir uyarı aldığınızda, ya iyi bir fiyat hareketli mum kalıbının oluşmasını bekleyebilirsiniz (yutan, çekiç, kayan yıldız vb...) ya da EMA9 gibi sıkı bir EMA kullanmak ve atlamak isteyebilirsiniz. M5 veya M15 kullanmak için en iyi zaman dilimleri.
En iyi sonuçlar için, Piyasa Ters Çevirme Uyarıları Göstergesini kullanarak M5 grafiğinde piyasa yapısında onaylanmış bir kırılma bekleyin. (burada mevcuttur: https://www.mql5.com/en/market/product/46295)
Bu alım satımların, ölçekleme alım satımları olması amaçlanmıştır, bu nedenle ideal olarak, bir destek veya direnç seviyesi olarak hareket etmesi muhtemel olan en son en yüksek veya en düşük seviyeleri hedef alır. Bu ADR uyarıları genellikle Londra veya NY oturumlarında gerçekleşir, bu nedenle Asya oturumunun iniş çıkışlarını hedeflemek genellikle iyi bir fikirdir.


BIG 5 STARS, after purchasing the ADR Reversal Indicator, this tool makes things much easier for me. Another great indicator from the author