ADR Alert Dashboard MT5
- インディケータ
- LEE SAMSON
- バージョン: 1.0
- アクティベーション: 10
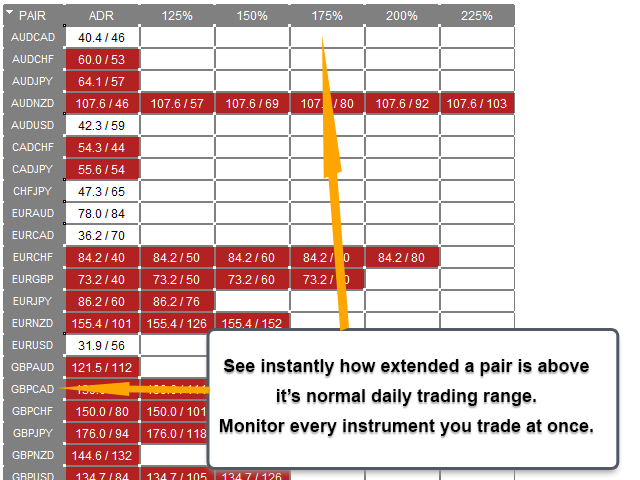
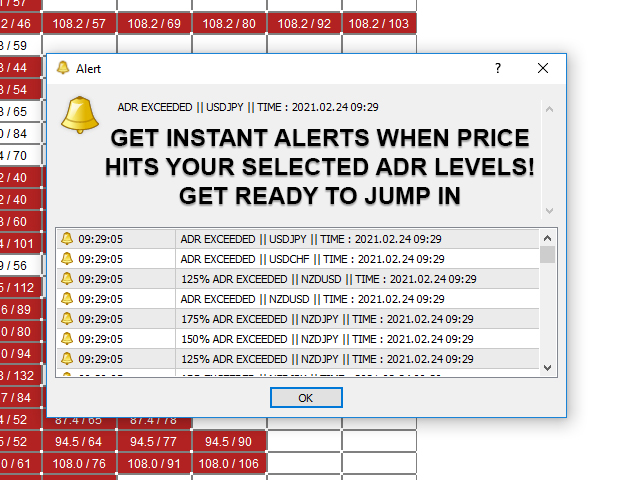
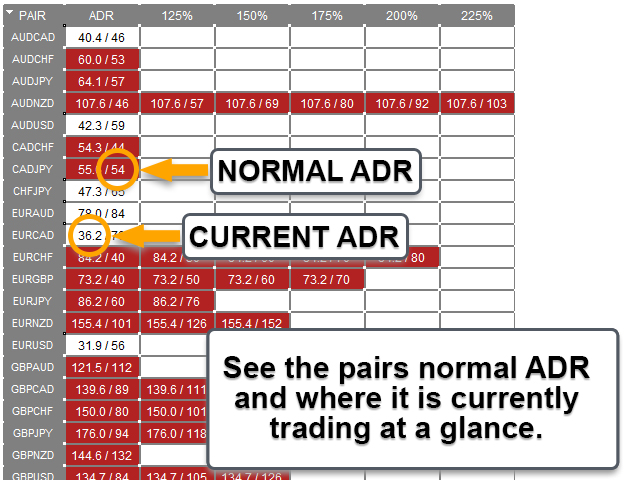
ADRアラートダッシュボードは、価格が通常の1日の平均範囲に関連して現在取引されている場所を一目で示します。価格が選択した平均範囲とレベルを超えると、ポップアップ、電子メール、またはプッシュを介して即座にアラートを受け取るため、プルバックと逆転にすばやくジャンプできます。ダッシュは空白のチャートに配置されるように設計されており、バックグラウンドに座ってレベルに達したときに警告を発するので、座って見たり、まったく見たりする必要はありません。
ここで利用可能なMT4バージョン:https://www.mql5.com/en/market/product/62756
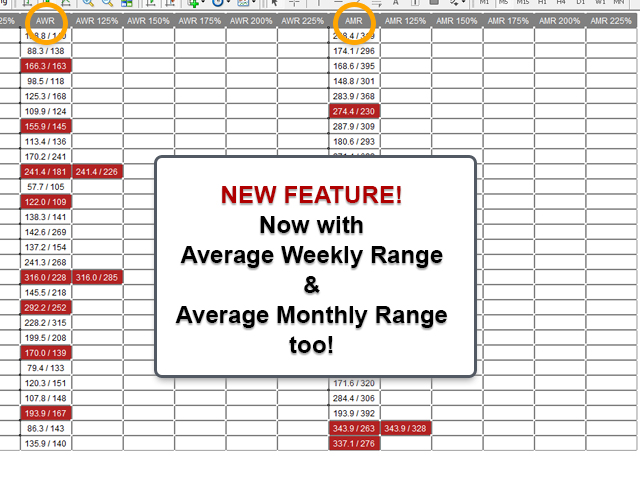
NEW:毎週と毎月の平均範囲とそれらへのアラートも表示されるようになりました!
ここでチャートのレベルを下げるADRリバースインジケーターを入手してください:https://www.mql5.com/en/market/product/64477
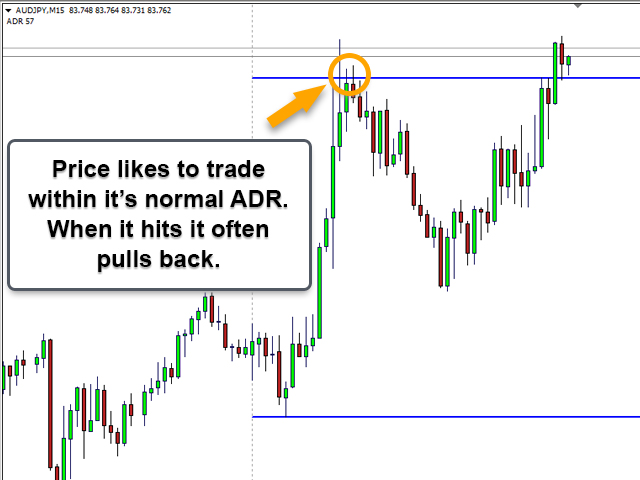
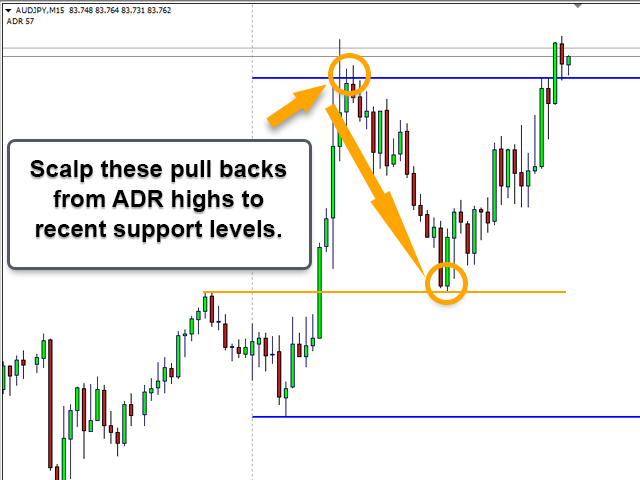
通常の1日平均レンジ(ADR)内で価格が取引され、これらのレベルを上回っている時間の約60%は、通常、その後の引き戻し(利益確定)の動きを伴う急激な価格の動きの指標です。毎日の範囲の上部または下部からのプルバックを最新レベルのサポートまたはレジスタンスにトレードバックすることで、これらの鋭い動きを利用できます。
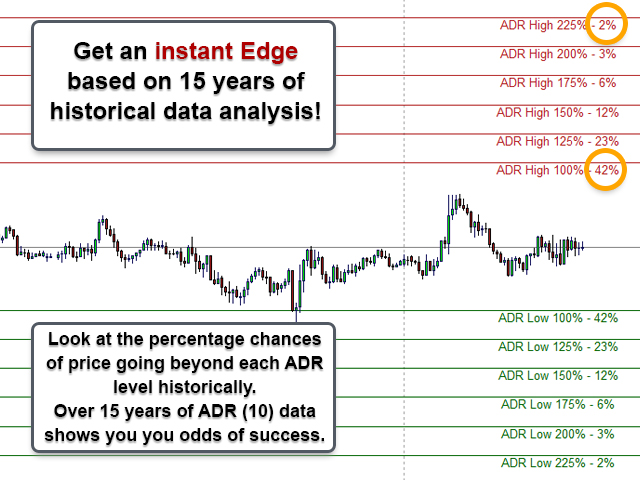
20年以上の履歴データを収集して、主要な外国為替ペアと選択したクロスの特定のADRレベルを超えて価格が変動する可能性の平均パーセンテージを見つけました。このデータは、価格がADRの200%を3%超えただけであることを示しています。つまり、そのレベルでの反転またはプルバックのオッズは97%になります!!!
これらは、データによって示されるADR拡張の平均です。
価格はADR10の100%を約42%超えました。
価格はADR10の125%を約23%超えました。
価格はADR10の150%を約12%超えました。
価格はADR10の175%を約6%超えました。
価格はADR10の200%を約3%超えました。
価格はADR10の225%を約2%超えました。
上記のレベルからわかるように、価格が通常のADRの150%に達した場合、それがさらに進む確率はわずか12%であり、大きな利点があります。価格アクションがそのレベルでのターンの兆候を示すのを待って、プルバックに飛び込んでください!
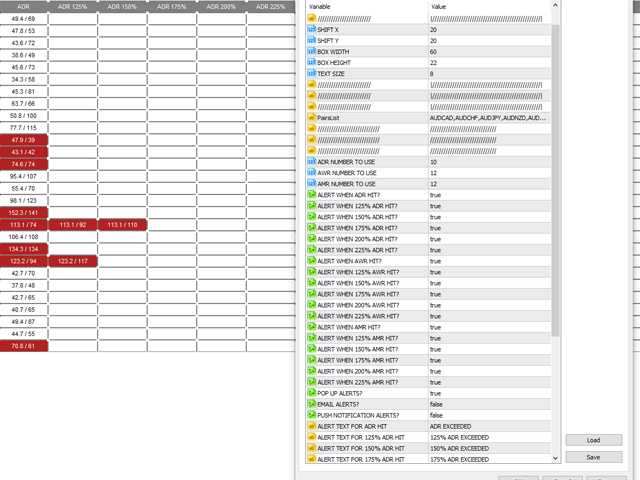
ダッシュボード設定:
ダッシュボードの位置を調整し、ボックスとテキストのサイズを変更します。
監視するペアを選択し、必要に応じてブローカーのプレフィックスまたはサフィックスを入力します。
レベルに使用するADR番号を選択します(ADR10がデフォルトであり、データ分析の基になっています)。
ヒットしたときにアラートを受け取るレベルを選択します。
ポップアップ、電子メール、またはプッシュアラートから受信するアラートのタイプを選択します。
レベルごとに必要なテキストアラートを選択します。
エントリー戦略のアイデア:
価格が特定のレベルに達するのを待ち、アラートを受け取ります。レベルが高いほど、逆転の可能性は高くなりますが、受信するアラートは少なくなります。アラートを受け取ったら、手頃な価格のアクションローソク足パターンが形成されるのを待つか(巻き込み、ハンマー、流れ星など)、EMA9のようなタイトなEMAを使用してジャンプすることができます。M5またはM15は使用するのに最適な時間枠。
最良の結果を得るには、Market Reversal AlertsIndicatorを使用してM5チャートで市場構造の確認された中断を待ちます。 (ここで入手可能:https://www.mql5.com/en/market/product/46295)
これらの取引はスキャルピング取引を意図しているため、理想的には、サポートまたはレジスタンスのレベルとして機能する可能性が高い最新の高値または安値をターゲットにします。多くの場合、これらのADRアラートはロンドンまたはニューヨークのセッションで発生するため、アジアのセッションの高値と安値をターゲットにすることをお勧めします。
グリッドトレーディングADRレベル:
多くの人がADRを使用してグリッド取引を行っています。選択したADRレベル(100%、150%、200%など)で小さなポジションを入力し、価格がレベルを超えると、新しい取引がトリガーされるたびに平均が高いポジションを獲得します。これにより、プルバックでより多くの利益を得ることができ、最初のポジションよりも高い平均価格エントリーが可能になります。
ADRに関するその他の注意事項:
基本的なニュースイベントの後に発生するADR拡張に注意してください。
ADRアラートを受け取ったら、価格レベルに注意してください。違反したばかりの最近のレベルがある場合、それは多くの場合、ストップハントの指標です。市場は人々の立ち止まりを取り除こうとしているだけであり、引き戻しや逆転の可能性ははるかに高いです。


BIG 5 STARS, after purchasing the ADR Reversal Indicator, this tool makes things much easier for me. Another great indicator from the author