ADR Alert Dashboard MT5
- 지표
- LEE SAMSON
- 버전: 1.0
- 활성화: 10
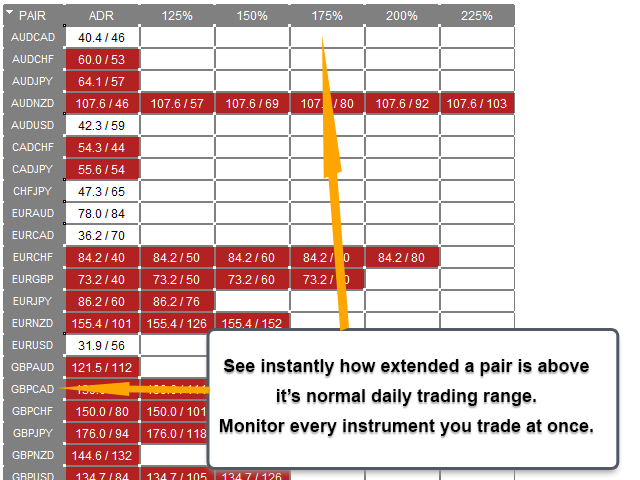
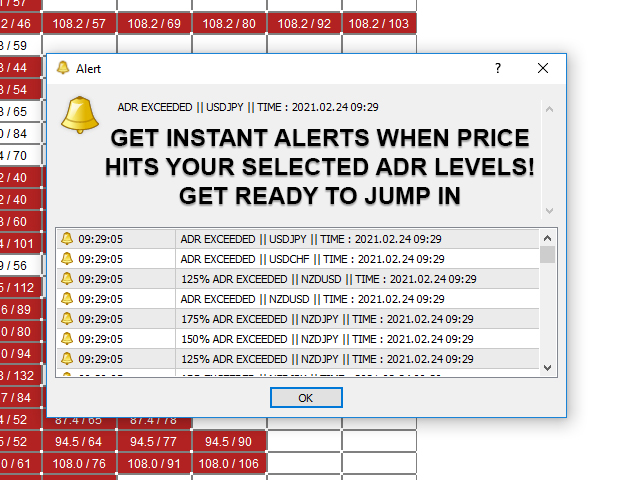
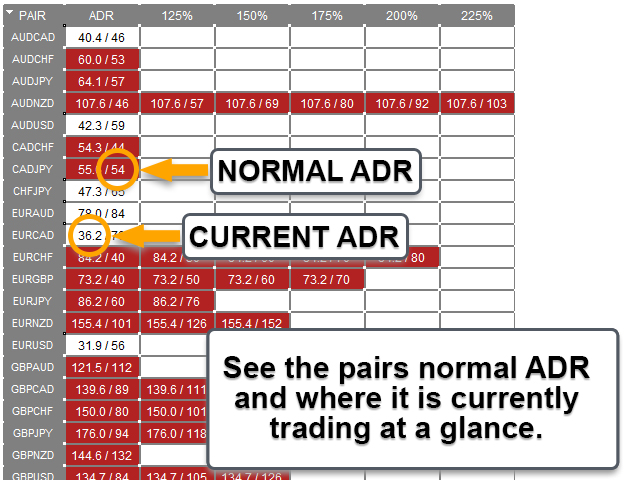
ADR 경보 대시보드는 가격이 일반적인 일일 평균 범위와 관련하여 현재 거래되고 있는 위치를 한 눈에 보여줍니다. 가격이 평균 범위를 초과하고 선택한 수준보다 높을 때 팝업, 이메일 또는 푸시를 통해 즉각적인 알림을 받을 수 있으므로 신속하게 철회 및 반전에 뛰어들 수 있습니다. 대시는 빈 차트에 배치되도록 설계되었으며 배경에 앉아서 레벨에 도달하면 경고하므로 앉아서 보거나 전혀 볼 필요가 없습니다!
MT4 버전은 여기에서 사용 가능: https://www.mql5.com/en/market/product/62756
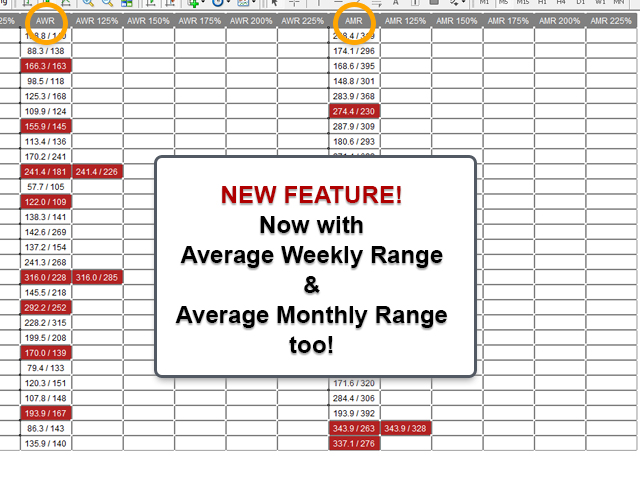
새로운 기능: 이제 평균 WEEKLY 및 MONTHLY 범위와 경고도 표시됩니다!
여기에서 차트의 수준을 나타내는 ADR 반전 표시기를 얻으십시오. https://www.mql5.com/en/market/product/64477
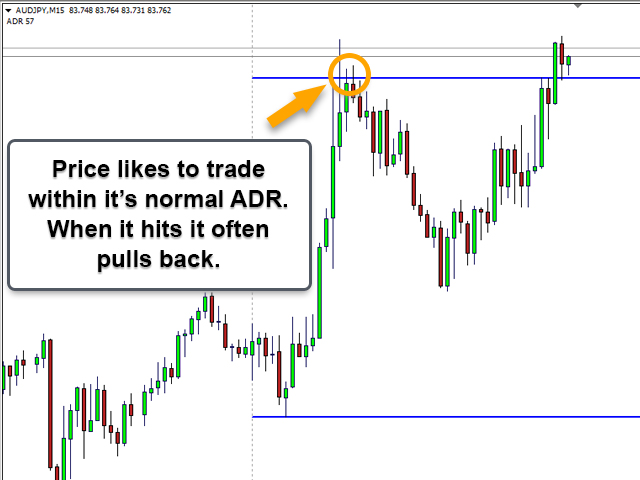
시간의 약 60%는 가격이 정상적인 일일 평균 범위(ADR) 내에서 거래되고 이 수준 이상으로 상승하면 일반적으로 급격한 가격 변동의 지표이며 일반적으로 이에 따라 후퇴(이익 차감) 움직임이 있습니다. 일일 범위의 상단 또는 하단에서 가장 최근의 지지선 또는 저항선까지 끌어내림으로써 이러한 급격한 움직임을 활용할 수 있습니다.
20년이 넘는 과거 데이터를 수집하여 주요 외환 쌍 및 교차 선택에 대한 특정 ADR 수준을 넘어 가격이 이동할 평균 백분율 기회를 찾았습니다. 이 데이터는 가격이 ADR 3%의 200% 이상으로만 움직였음을 나타냅니다. 즉, 해당 수준에서 반전 또는 철회의 확률은 97%가 됩니다!!!
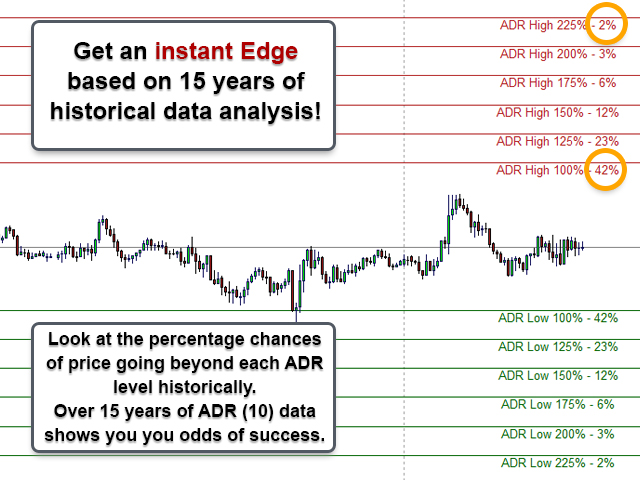
다음은 데이터에 표시된 ADR 확장 평균입니다.
가격은 약 42%의 시간에 ADR10의 100%를 초과했습니다.
가격은 대략 23%의 시간에 ADR10의 125%를 초과했습니다.
가격은 대략 12%의 시간에 ADR10의 150%를 초과했습니다.
가격은 대략 6%의 시간에 ADR10의 175%를 초과했습니다.
가격은 약 3%의 시간에 ADR10의 200%를 초과했습니다.
가격은 약 2%의 시간에 ADR10의 225%를 초과했습니다.
가격이 정상 ADR의 150%에 도달하면 위의 수준에서 알 수 있듯이 더 나아갈 확률은 12%에 불과하여 엄청난 이점을 제공합니다. 가격 조치가 해당 수준에서 회전 신호를 표시할 때까지 기다렸다가 철수에 뛰어드십시오!
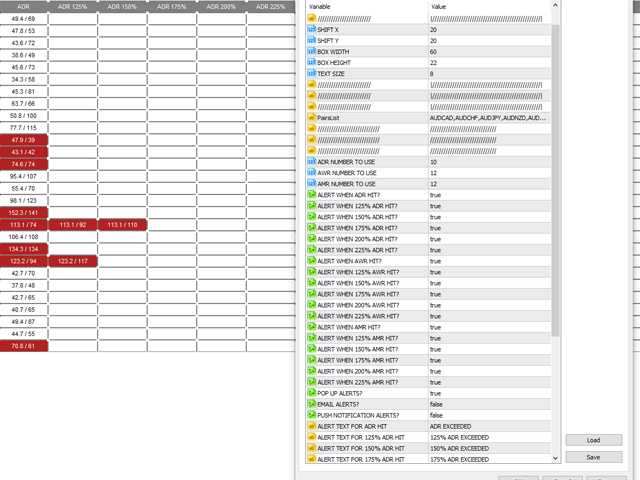
대시보드 설정:
대시보드의 위치를 조정하고 상자와 텍스트의 크기를 변경합니다.
모니터링할 쌍을 선택하고 필요한 경우 브로커 접두사 또는 접미사를 입력합니다.
레벨에 사용할 ADR 번호를 선택합니다(ADR10이 기본값이고 데이터 분석의 기반이 됨).
적중 시 알림을 받을 수준을 선택합니다.
팝업, 이메일 또는 푸시 알림에서 수신할 알림 유형을 선택합니다.
각 레벨에 대해 원하는 문자 알림을 선택하십시오.
진입 전략 아이디어:
가격이 특정 수준에 도달하고 알림을 받을 때까지 기다리세요. 레벨이 높을수록 반전 가능성이 높아지지만 수신할 알림은 줄어듭니다. 경고를 받으면 좋은 가격 행동 촛대 패턴이 형성될 때까지 기다리거나(삼켜짐, 망치질, 별똥별 등...) EMA9와 같은 타이트한 EMA를 사용하고 뛰어들 수 있습니다. M5 또는 M15는 사용하기 가장 좋은 기간.
최상의 결과를 얻으려면 시장 반전 경고 표시기를 사용하여 M5 차트에서 시장 구조의 확인된 중단을 기다립니다. (여기에서 사용 가능: https://www.mql5.com/en/market/product/46295)
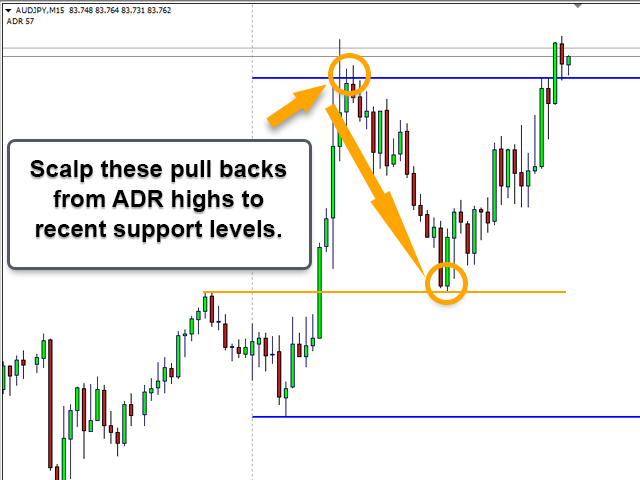
이러한 거래는 스캘핑 거래를 의미하므로 지지 또는 저항 수준으로 작용할 가능성이 있는 가장 최근의 고가 또는 저가를 이상적으로 목표로 합니다. 종종 이러한 ADR 경고는 런던 또는 뉴욕 세션에서 발생하므로 아시아 세션의 최고점과 최저점을 목표로 하는 것이 종종 좋은 생각입니다.
그리드 거래 ADR 수준:
많은 사람들이 ADR을 사용하여 그리드 거래를 합니다. 선택한 ADR 수준(100%, 150%, 200% 등)에서 작은 위치를 입력한 다음 가격이 수준 위로 이동함에 따라 새로운 거래가 발생할 때마다 평균이 더 높은 위치를 얻게 됩니다. 그러면 풀백에서 더 많은 이익을 얻을 수 있고 첫 번째 포지션보다 더 높은 평균 가격 진입이 가능합니다.
ADR에 대한 기타 참고 사항:
펀더멘털 뉴스 이벤트 이후에 발생하는 ADR 확장에 주의하십시오.
ADR 경고를 받으면 가격 수준을 확인하십시오. 방금 위반한 최근 레벨이 있는 경우 이는 종종 중지 사냥의 지표입니다. 시장은 사람들의 스톱을 없애기 위해 추진하고 있으며 후퇴 또는 반전이 훨씬 더 가능성이 높습니다.


BIG 5 STARS, after purchasing the ADR Reversal Indicator, this tool makes things much easier for me. Another great indicator from the author