• 概述
  • 评论 (4)
  • 评论 (4)

ADR Alert Dashboard MT5

5
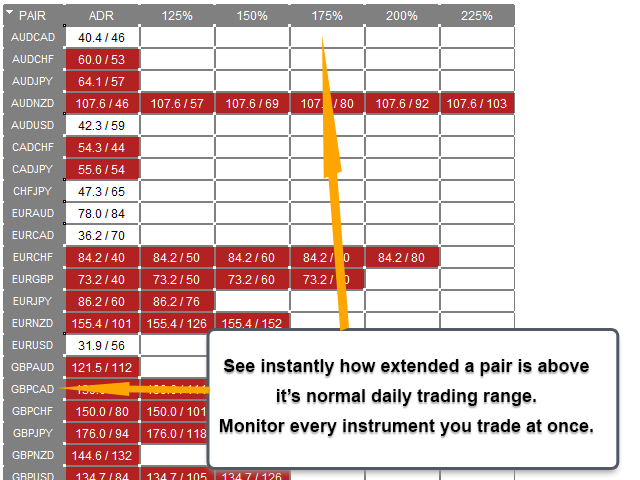
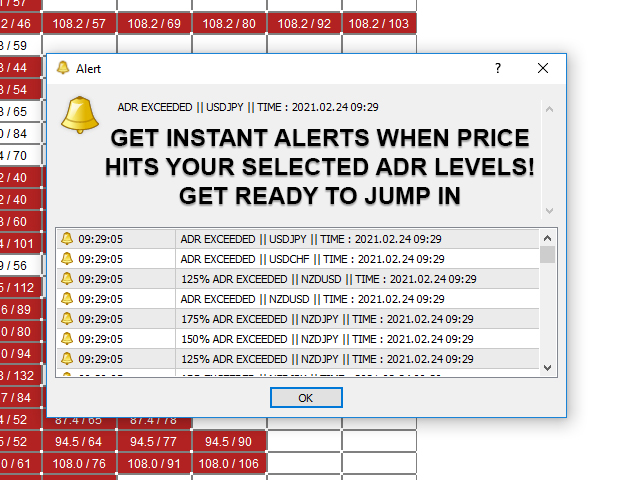
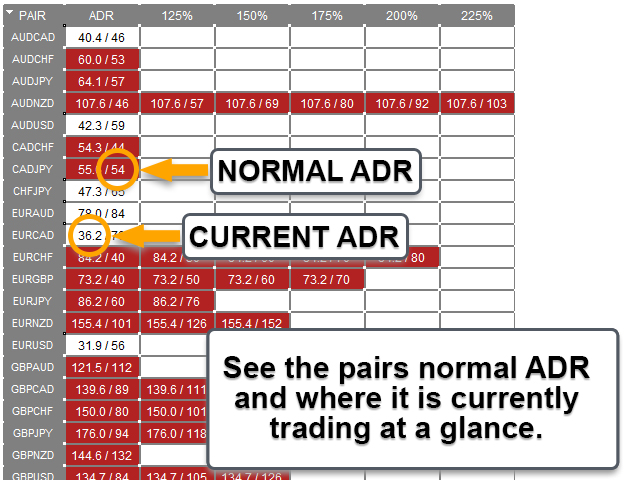
ADR 警报仪表板一目了然地向您显示当前价格相对于其正常平均每日范围的交易位置。当价格超过您选择的平均范围和高于它的水平时,您将通过弹出窗口、电子邮件或推送获得即时警报,以便您可以快速跳入回调和反转。破折号旨在放置在空白图表上,只需坐在背景中并在达到水平时提醒您,因此您无需坐下来观看甚至看!


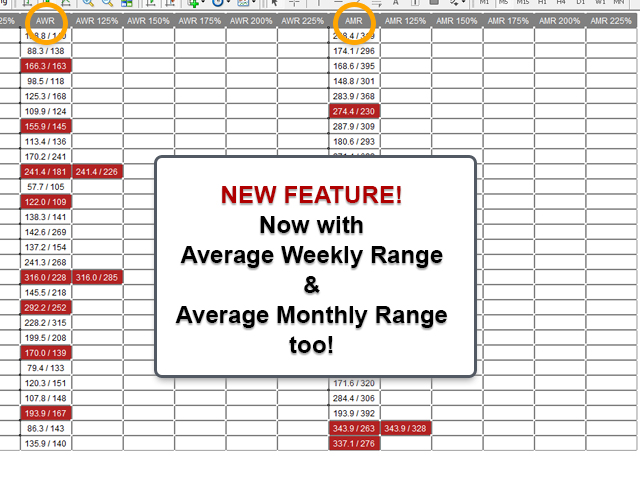
新:现在还向您显示平均每周和每月范围,并提醒他们!

获取在您的图表上绘制水平的 ADR 反转指标:https://www.mql5.com/en/market/product/64477

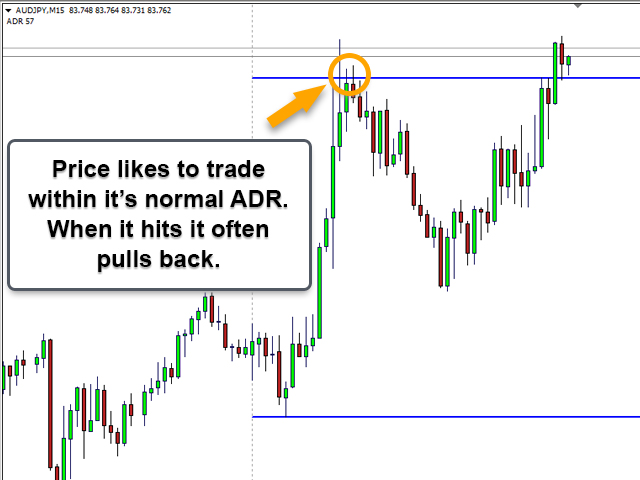
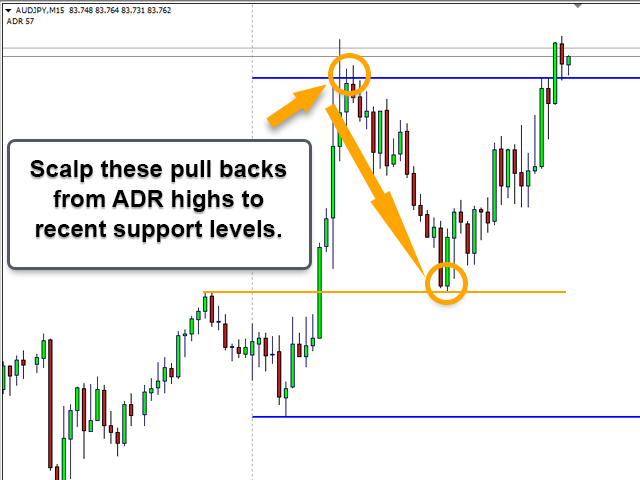
大约 60% 的时间价格在其正常的平均每日范围 (ADR) 内交易并推高这些水平通常是价格急剧波动的指标,通常会出现回调(获利了结)走势。您可以通过交易从每日范围的顶部或底部回落到最近的支撑位或阻力位来利用这些急剧波动。

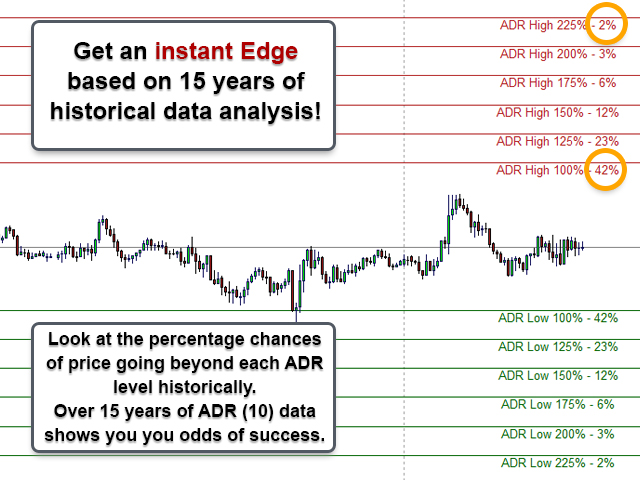
收集了超过 20 年的历史数据,以找出主要外汇对和一系列交叉盘的价格超出特定 ADR 水平的平均百分比。该数据表明价格仅在 3% 的时间内超过其 ADR 的 200%,这意味着您在该水平反转或回调的几率为 97%!!!

这些是数据显示的 ADR 扩展平均值:

大约 42% 的时间,价格超过了 ADR10 的 100%。
价格在大约 23% 的时间内超过了 ADR10 的 125%。
价格在大约 12% 的时间内超过了 ADR10 的 150%。
价格在大约 6% 的时间内超过了 ADR10 的 175%。
价格在大约 3% 的时间内超过 ADR10 的 200%。
价格在大约 2% 的时间内超过 ADR10 的 225%。

正如您从上面的水平所看到的,如果价格达到正常 ADR 的 150%,那么它进一步上涨的几率只有 12%,从而为您带来巨大的优势。等待价格走势向您显示该水平的转折迹象并在回调中跳入!
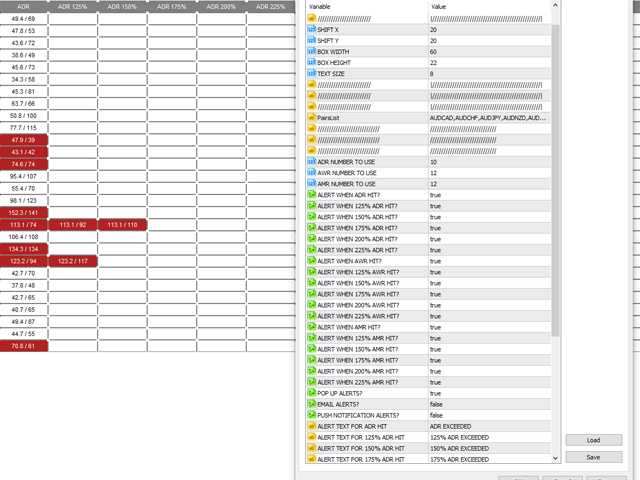
仪表板设置:

调整仪表板的位置并更改框和文本的大小。
选择您要监控的货币对,并在需要时输入您的经纪人前缀或后缀。
选择用于级别的 ADR 编号(默认为 ADR10 以及数据分析的依据)。
选择您希望在被击中时收到警报的级别。
选择您希望从弹出窗口、电子邮件或推送警报中接收的警报类型。
为每个级别选择您想要的文本警报。
进入策略理念:

等待价格达到特定水平并收到警报。级别越高,反转的机会就越大,但您收到的警报就越少。当您收到警报时,您可以等待形成良好的价格走势烛台模式(吞没、锤子、流星等),或者您可能想要使用 EMA9 等紧缩 EMA 并跳入。M5 或 M15 是使用的最佳时间框架。

为了获得最佳结果,请等待使用市场反转警报指标在 M5 图表上确认市场结构突破。 (可在此处获取:https://www.mql5.com/en/market/product/46295

这些交易旨在进行剥头皮交易,因此理想地针对可能充当支撑或阻力水平的最近高点或低点。这些 ADR 警报通常发生在伦敦或纽约时段,因此瞄准亚洲时段的高点和低点通常是一个好主意。


网格交易 ADR 水平:

许多人使用 ADR 进行网格交易。在选定的 ADR 水平(100%、150%、200% 等)输入小头寸,然后随着价格超过这些水平,您每次触发新交易时都会获得一个更高平均水平的头寸。然后,这允许在回调中获得更多利润,并允许比仅持有的第一个头寸更高的平均价格入场。

关于 ADR 的其他说明:

小心在基本新闻事件之后发生的 ADR 扩展。

当您收到 ADR 警报时,请注意价格水平。如果有一个最近的水平刚刚被突破,它通常是止损的一个指标。市场只是在推动人们止损,回调或逆转的可能性更大。
评论 4
sweethomeboy2
288
sweethomeboy2 2023.02.10 12:02 
 

BIG 5 STARS, after purchasing the ADR Reversal Indicator, this tool makes things much easier for me. Another great indicator from the author

David
141
David 2022.05.31 08:48 
 

Very useful Dashboard, highly recommended!

Kasim Ijelu
396
Kasim Ijelu 2022.01.04 17:17 
 

1stly I would like to thank you for all of you're hard work, you are truly an inspiration to all novice and advanced traders. Making it simple clear and easy for ordinary people from various back grounds who have the discipline and dedication to continuously learn to trade for a living, you have allowed me and I'm sure others to be encouraged and inspired to succeed. So what ever you aim was or dream for others I personally think you have achieved it thank you. and happy 2022

推荐产品
A useful scanner/dashboard that shows the RSI values for multiple symbols and Time-frames. It can be easily hidden/displayed with a simple click on the scanner man top left of the dashboard. You can input upper and lower RSI values and the colours can be set to show when above/below these values. The default values are 70 and 30. There are also input colours for when the RSI is above or below 50 (but not exceeding the upper/lower levels Symbols and time-frames are input separated by commas.
80 USD
Mean Reversal Heikin Ashi Indicator calculates special trade reversal points based on Heikin Ashi candlesticks patterns. This indicator can be used on all symbols, even in Forex or B3 Brazillian Markets. You can configure just the position of each arrow. Then, after include the indicator on the graphic, pay attention on each arrow that indicates a long or short trade.
40 USD
To download MT4 version please click here . - This is the exact conversion from TradingView: "Linear Regression Candles" By "ugurvu". - The overall look of the indicator is like Heiken Ashi. - It can be used as a trend confirmation indicator to detect the right trend direction. - This indicator lets you read the buffers for Candles' OHLC. - This is a non-repaint and light processing load indicator - You can message in private chat for further changes you need. Thanks
40 USD
Skiey
Vitalii Zakharuk
Skiey - Indicator of easy solutions! Using this indicator is very simple, since the simplest is to look at the chart and act according to the color arrows. Such a calculation option takes into account intraday price fluctuations and focuses on measuring the "candlestick" share in the trend. The algorithm takes into account the measurement of prices, this method also emphasizes the measurement of each of the price drops (H / C, H / O, LC, LO) - which gives more detailed information but also mo
130 USD
The indicator monitors the Dinapoli MACD trend in multiple timeframes for the all markets filtered and shows the results on Dashboard. Key Features Indicator can be used for all markets Monitors every timeframe, from 1 Min to Monthly Parameters UseMarketWatch: Set true to copy all symbols available in market watch MarketWatchCount : Set the number of symbols that you want to copy from the market watch list. CustomSymbols: Enter the custom symbols that you want to be available in dashboard.
80 USD
RSI Divergences Scanner MT5
Reza Aghajanpour
5 (6)
** All Symbols x All Timeframes scan just by pressing scanner button ** ***Contact me after purchase to send you instructions and add you in "RSI scanner group" for sharing or seeing experiences with other users. Introduction RSI divergence is a main technique used to determine trend reversing when it’s time to sell or buy because prices are likely to drop or pick in the charts. The RSI Divergence indicator can help you locate the top and bottom of the market. This indicator finds Regular diver
39 USD
Market Session Pro
Kambiz Shahriarynasab
The  Market Sessions Indicator for MT5 helps you  predict market turnarounds  by detecting major supply and demand areas. These pivot points tend to occur after a new session has started and the previous one is still open. It is also used to gauge how many points or pips the market moves on average during a session. This helps us to place better our take profits and stop losses. The indicator works on all forex pairs, gold, silver, commodities, stocks, indices and any other instrument that your
50 USD
Xtrade Trend Detector
Dago Elkana Samuel Dadie
Xtrade Trend Detector is an indicator capable of finding the best opportunities to take a position in any stock market. Indeed, it is a great tool for scalpers but also for Daytraders. You could therefore use it to identify areas to trade, it fits easily on a chart. I use it to detect trends on Big timeframes and take positions on Small timeframes. Don't hesitate to give me a feedback if you test it.
40 USD
The indicator determines the state of the market: trend or flat. The state of the market is determined by taking into account volatility. The flat (trading corridor)is displayed in yellow. The green color shows the upward trend. The red color shows the downward trend. The height of the label corresponds to the volatility in the market. The indicator does not redraw . Settings History_Size   - the amount of history for calculation. Period_Candles  - the number of candles to calculate the
73 USD
DYNAMIC SR TREND CHANNEL Dynamic SR Trend Channel is a simple indicator for trend detection as well as resistance/support levels on the current timeframe. It shows you areas where to expect possible change in trend direction and trend continuation. It works with any trading system (both price action and other trading system that use indicators) and is also very good for renko charting system as well. In an uptrend, the red line (main line) serves as the support and the blue line serves as the
50 USD
Fibrillar
Vitalii Zakharuk
It is very easy to use the Fibrillar indicator, since the simplest is to look at the chart and act according to the indications of the colored arrows. The algorithm takes into account the measurement of prices, and this method also focuses on measuring each of the price drops (H / C, H / O, LC, LO) - which gives more detailed information, but also more averaged. When calculating this indicator, logarithmic gains are first calculated at the closing price, which allows you to filter out the tre
66 USD
KTrend for GOLD
Zhenyuan Liang
What is KTrend indicator ? KTrend is a powerful indicator for trading medium-term binary options that identify the trend of price by candlesticks. Sell signal is formed when the value is below the zero line. Similarly, buy signal is formed when the value is above the zero line. It is separated from KTrend trading system and you can get the backtest result from the pictures below.
30 USD
Heiken Ashi On One Chart Mode The indicator is displayed only on one of the chart modes: Bars, Candles, Line. The default is Bars. When switching the chart mode, the indicator is displayed or disappears depending on the chart mode. Input parameters: iChartMode: on what chart mode should the indicator be displayed mBars mCandles mLine Colors: LightSeaGreen: bull candle Tomato: bear candle
30 USD
Trade Extractor MT5
Philip Pankaj
2 (1)
TRADE EXTRACTOR   is the fastest self-learning AI Algorithm, which will learn any market situation with ease.As a Manual trader, I came across the difficulty of finding the right parameter and the right condition to trade. There are infinite combinations of indicators and objects(trendlines, gann grid, fibo levels etc) which as an human, I can’t decide their winning rate or performance. Many claim to have a winning strategy but won’t have enough statistical support to prove their claims. Due to
89 USD
The volatility scanner indicator is a tool that helps traders identify and analyze  volatility in all the market timeframes for the current chart. This way you can find potentially profitable trades on every timeframe for the current symbol. What It Does? Scan all timeframes to find a volatility contraction. Color the button yellow if there is a volatility squeeze at that timeframe. Clicking on the button instantly changes timeframe. How To Use It? Just put it on the chart and click on the y
48 USD
All 11 indicators quickly turn off and turn on quickly! Set of indicators: 2 indicators "TREND"   : - fast = line 4 colors - slow = dots 4 colors The coloring of the indicators depends on the direction of the trend and the RSI indicator: 1) uptrend and RSI<50% 2) uptrend and RSI>50% 3) downtrend RSI<50% 4) downtrend RSI   >   50% Set indicator periods for each timeframe: M5 M10 M15 M30 H1 H2 H4 H6 H12 D1 W1 MN Do not enter trades if at least 1 of the indicators is horizontal. For a
65 USD
该指标具有独有的支撑阻力计算方案 ,是独一无二的交易系统  。 指标特性 想象一下,如果您能提前精确的判断出重要的交易支撑阻力区域以及点位,您的交易将如何改善   ?  基于独特的计算方式,指标通过对趋势进行分析,通过对当前的支撑阻力进行分析后,得出现在重要的支撑阻力以及做单方向,计算得到的止盈和止损建议,以及关键的进场点位建议. 在交易策略中,进场点位和趋势方向同样非常关键,前者点位不同所面临的风险是不同的,止损的点数也是成倍放大. 本指标分析了当趋势进行后,暂时进入调整时间,分析了此时的重要进场支撑阻力并计算风险控制一定的止损,和止盈,合理的盈亏比. 本指标支持周期设置,可以设置其他周期.  大周期重要支撑阻力,以及小周期辅助判断可以在同一图表中完成. 基本显示 显示历史支撑阻力的价格标签。 显示历史进场位置大概建议范围,以及止盈和止损建议,目标预测. 显示当前方向的判断,以及进场点位,以及止盈止损建议 . 基本设置 设置计算的周期。 警报设置 接近报警 碰触报警 报警弹窗 报警邮件发送 发送推送警报 颜色设定 可以设置不用的实时支撑阻力颜色 可以设置不用的历史支撑阻
136 USD
ToolBox 360 is the swiss knife of all indicators. It is full packed with useful tools to help you with your trading. It can be used to find best entry and exit points and help you to decide if you should open a trade or not. It shows market trends, candlestick formations outside / inside bars and you can sett time based allerts. Main features: Time based Fibonacci lines Choose a start and end time and the indicator shows you Fibonacci lines within the selected time range including range high
399 USD
- This is an implementation of OCC ==> open close cross - This indicator applies twelve different averaging methods to open and close prices separately to signal the trend switching. - All MA methods are set as input as well as period and different offsets applied to linear regression and ALMA averaging. - Buffers 16 and 17 can be used in EAs to detect trend direction. - You can message in private chat for further changes you need.
40 USD
The indicator helps to enter a trade following the trend, at the same time, after some correction. It finds strong trending movements of a currency pair on a given number of bars, and also finds correction levels to this trend. If the trend is strong enough, and the correction becomes equal to the one specified in the parameters, then the indicator signals this. You can set different correction values, 38, 50 and 62 (Fibonacci levels) are better. In addition, you can set the minimum trend lengt
30 USD
Regent Street
Icham Aidibe
Regent Street, rather than an expert or an indicator, is an all-in-one trading assistant easing your trading sessions by providing signals and notifications. It's an assistant rather than a robot - "an assisted steering rather than an autopilot", and now, it autoadjusts itself to any instrument, any timeframe & any circumstance. Note from the author: Regent Street's frontend is exactly the same as an other product Ermou Street , but the backend is different. Performances for each are very relati
90 USD
Deviation trend
VLADISLAV AKINDINOV
Indicator of trend deviation with a static level. The deviation coefficient is set for the trend histogram. Signals are the intersection of the level trend histogram in the direction of the trend or during a trend reversal - the option is selected in the indicator settings by the "Revers" parameter. There are all the necessary settings for the design of the indication and sending messages to mail or a mobile terminal. All input parameters have an intuitive name. Analog for MT4: https://www.mql5.
30 USD
Dark Breakout MT5
Marco Solito
5 (3)
Dark Breakout   is an Indicator for intraday trading. This Indicator is based on Trend Following  strategy, providing an entry signal on the breakout. The signal is provided by the arrow, which confirms the breaking of the level. We can enter in good price with this Indicator, in order to follow the main trend on the current instrument. It is advised to use low spread ECN brokers. This Indicator does Not repaint and N ot lag . Recommended timeframes are M5, M15 and H1. Recommended working pairs
50 USD
The indicator determines a special pattern of Joe Dinapoli. It gives very high probability buy and sell signals. Indicator does not repaint. Indicator Usage Buy Signal ''B'' Entry : Market buy order at signal bar close Stop : Low of signal bar Take Profit : First swing high Sell Signal ''S'' Entry : Market sell order at signal bar close Stop : High of signal bar Take Profit : First swing low Indicator Parameters Fast EMA : External Parameter (should be kept as default) Slow EMA: External Param
70 USD
This product generates signals at closing bars thanks to channel scaling. It visualizes these signals with an arrow. The color of the arrow indicates the direction of the trade. The default settings are valid for the H1 period. You can backtest for each period and product. The code content of the indicator has been applied in accordance with price movements as much as possible. For this reason, it detects trend beginnings and ends well. Parameter descriptions: PER: Indicates the number of b
36 USD
VVWAP Bandas
Edipaulo Zanella
Daily VWAP, continues for a period of hours (eg, 10 hours of history), with color to indicate change of direction and bands to map good entry and exit points. The indicator was created to map the center of the market, and find good buying moments, trend analysis or market correction points are easily detected, allowing you to understand moments of exhaustion and buying and selling points Copyright (c) <year> <copyright holders> Permission is hereby granted, free of charge, to any person obtain
30 USD
Buy And Sell Arrows On The Chart When The Trend Is About To Continue. Sends Alerts – On MT5 To Your Phone To Your Email. Does not repaint. Works on any pair, any timeframe.   (Just ajust the settings for your pair and timeframe.) 10 Activations allowed so you are free from limitations See an example of alerts from today (23 May 2020) using this and 2 other indicators  here . MT4 version here. The indicator provides accurate buy and sell arrows on the chart when the trend is about
297 USD
Rocket Trend
Andriy Sydoruk
The Rocket Trend indicator is trending. The indicator draws two-color points connected by lines along the chart. This is a trend indicator, it is an algorithmic indicator. It is easy to work and understand when a blue circle appears, you need to buy, when a red one appears, sell. The indicator is used for scalping and pipsing, and has proven itself well. Rocket Trend is available for analyzing the direction of the trend for a specific period of time. Ideal for novice traders learning the laws o
79 USD
MR Trend Corrections 5
Sergey Khramchenkov
We publish the indicator as a useful tool in trading and call this indicator the "Swiss Army Knife" because it provides many possibilities and combinations to help understand the material on the "Masters of Risk" trading system. The indicator itself is not part of the tools used in the "Masters of Risk" trading system. The indicator consists of 3 separate multi-timeframe indicators, which in combination with each other help to reduce the "noise" of false signals. The first of the indicators ar
150 USD
MetaCOT 2 is a set of indicators and specialized utilities for the analysis of the U.S. Commodity Futures Trading Commission reports. Thanks to the reports issued by the Commission, it is possible to analyze the size and direction of the positions of the major market participants, which brings the long-term price prediction accuracy to a new higher-quality level, inaccessible to most traders. These indicators, related to the fundamental analysis, can also be used as an effective long-term filter
30 USD
该产品的买家也购买
ICT, SMC, SMART MONEY CONCEPTS, SMART MONEY, Smart Money Concept, Support and Resistance, Trend Analysis, Price Action, Market Structure, Order Blocks, BOS/CHoCH,   Breaker Blocks ,  Momentum Shift,   Supply&Demand Zone/Order Blocks , Strong Imbalance,   HH/LL/HL/LH,    Fair Value Gap, FVG,  Premium  &   Discount   Zones, Fibonacci Retracement, OTE, Buy Side Liquidity, Sell Side Liquidity, BSL/SSL Taken, Equal Highs & Lows, MTF Dashboard, Multiple Time Frame, BigBar, HTF OB, HTF Market Structur
65 USD
Entry Points Pro for MT5
Yury Orlov
4.59 (126)
这款指标用于 MT5,可提供准确的入场交易信号,且无重绘。 它可应用在任何金融资产:外汇、加密货币、贵金属、股票、指数。 它将提供极其精准的评估,并告诉您何时开仓和平仓的最佳时机。 观看 视频 (6:22),其中包含一个仅处理单一信号的示例,该信号即可值回指标购价! 大多数交易者在 Entry Points Pro 指标的帮助下,在第一个交易周内即改善了他们的交易结果。 订阅我们的 Telegram 群 ! Entry Points Pro 指标的益处。 入场信号无重绘 如果信号出现,并得到确认,则它不会再消失;不像是重绘指标,它会导致重大的财产损失,因为它们可以在显示信号后再将其删除。 无差错开仓 指标算法可令您找到入场交易(买入或卖出资产)的理想时机,从而提高每位交易者的成功率。 Entry Points Pro 可操作任何资产 它允许您在 MT5 平台上交易任何经纪商的加密货币、股票、贵金属、指数、大宗商品和货币。 提供任何方向的信号 Entry Points Pro 指标提供针对任意价格走势的入场交易信号 - 上涨、下跌或横盘(横向)。
125 USD
Gold Stuff mt5
Vasiliy Strukov
4.97 (107)
Gold Stuff mt5 是专为黄金设计的趋势指标,也可用于任何金融工具。 该指标不会重绘,也不会滞后。 推荐时间框架 H1。 购买后立即联系我以获得设置和个人奖励!   设置 绘制箭头 - 打开关闭。 在图表上绘制箭头。 警报 - 打开关闭声音警报。 电子邮件通知 - 打开关闭。 电子邮件通知。 Puch-notification - 打开关闭。 推送通知。 接下来,调整色域。 Gold Stuff mt5 是专为黄金设计的趋势指标,也可用于任何金融工具。 该指标不会重绘,也不会滞后。 推荐时间框架 H1。 购买后立即联系我以获得设置和个人奖励!   设置 绘制箭头 - 打开关闭。 在图表上绘制箭头。 警报 - 打开关闭声音警报。 电子邮件通知 - 打开关闭。 电子邮件通知。 Puch-notification - 打开关闭。 推送通知。 接下来,调整色域。
50 USD
Trend Screener Pro MT5
STE S.S.COMPANY
4.87 (38)
趋势指标,趋势交易和过滤的突破性独特解决方案,所有重要趋势功能都内置在一个工具中! 它是 100% 非重绘多时间框架和多货币指标,可用于所有符号/工具:外汇、商品、加密货币、指数、股票。 趋势筛选器是有效的指标趋势跟踪指标,它在图表中提供带有点的箭头趋势信号。 趋势分析器指标中可用的功能: 1.趋势扫描仪。 2. 具有最大利润分析的趋势线。 3.趋势货币强度计。 4. 带有警报的趋势反转点。 5. 带有警报的强趋势点。 6. 趋势箭头 每日分析示例,每日信号表现...等与我们的趋势筛选指标,可以在这里找到: 点击这里 限时优惠:Trend Screener Indicator 仅售 50 美元且终身可用。原价 125$) 您想在没有 Metatrader Backtester 限制的情况下试用我们的指标吗, 请单击此处下载演示版本。 通过访问我们的 MQL5 博客,您可以找到我们所有的高级指标以及分析示例、每日信号表现...等。 : 点击这里 此处提供趋势筛选器 MT4 版本: https://www.mql5.com/en/market/product/46303 我们
50 USD
AW Trend Predictor MT5
Alexander Nechaev
5 (34)
一个系统中趋势和故障水平的组合。先进的指标算法过滤市场噪音,确定趋势、进入点以及可能的退出水平。指标信号记录在统计模块中,您可以选择最合适的工具,显示信号历史的有效性。该指标计算获利和止损标记。 手册和说明 ->   这里 / MT4 版本 ->   这里 如何使用指标进行交易: 使用趋势预测器进行交易只需三个简单的步骤: 第 1 步 - 开仓 收到买入信号,成功率超过 70% 第 2 步 - 确定止损 通过相反的信号选择中继线 第 3 步 - 定义止盈策略 策略一:达到 TP1 时平仓 策略 2:达到 TP1 时平仓 50%,达到 TP2 时平仓剩余 50% 策略三:在趋势反转时平仓 好处: 从不重绘结果,信号严格位于蜡烛收盘时 它可以在顾问中使用 获利和止损标记 对交易策略或独立策略的重要补充 市场噪音过滤算法 适用于任何工具 统计模块: 为了更好地选择配对,请使用内置的统计计算。 计算交易 - 给出统计数据的信号总数 成功评级 - 达到 TP1 的信号百分比,或反转那些正获利的信号时的百分比 TakeProfit1 Hit - 达到 TP1 的信号百分比 TakeProfit2
55 USD
Advanced Supply Demand MT5
Bernhard Schweigert
4.42 (12)
任何新手或专业交易者的最佳解决方案! 该指标是一款独特、高质量、且价格合理的交易工具,因为我们已经整合了许多专有功能和新公式。 依据此更新,您将能够显示双重时间帧区域。 您不仅可以显示一个较高的时间帧,还可以同时显示图表时间帧,加上更高的时间帧:显示嵌套时区。 供需双方所有交易者都会喜欢它。 :) 重要信息披露 高级供需的最大潜力,请访问 https://www.mql5.com/zh/blogs/post/720245   想象您的交易如何得以改善,是因为您能够精准定位入场或目标位吗? 构建于新的底层算法,它可以更轻松地识别出买卖双方之间的潜在失衡。 这是因为它以图形方式展示供需最强劲区域,及其过去的表现(显示旧区域)。 这些功能旨在帮助您更轻松地发现最佳入场区域和价位。 现在您可以针对您的交易品种和时间帧来优化和编辑区域强度! 高级供需指标适用于所有产品和时间帧。 它是一个新的公式,非常新的功能是两个区域强度函数可由用户输入进行调整! 这在交易中是一大优势。 当您学习如何使用专有功能,例如带有价格游离最小 X 因子的区域强度时,您能够判断该区域强劲与否。 供需区域用作警报触发器
199 USD
Matrix Arrow Indicator MT5
Juvenille Emperor Limited
5 (11)
矩阵箭头指标 MT5   是一种独特的 10 合 1 趋势,遵循   100% 非重绘多时间框架指标 ,可用于所有符号/工具: 外汇 、 商品 、 加密货币 、 指数 、 股票 。 Matrix Arrow Indicator MT5 将在其早期阶段确定当前趋势,从多达 10 个标准指标中收集信息和数据,它们是: 平均定向运动指数 (ADX) 商品渠道指数 (CCI) 经典 Heiken Ashi 蜡烛 移动平均线 移动平均收敛散度 (MACD) 相对活力指数 (RVI) 相对强弱指数 (RSI) 抛物线SAR 随机振荡器 威廉姆斯的百分比范围 当所有指标给出有效的买入或卖出信号时,相应的箭头将打印在图表上,在下一根蜡烛/柱线开盘时,指示强劲的上升趋势/下降趋势。用户可以选择使用哪些指标,并可以单独调整每个指标的参数。 Matrix Arrow Indicator MT5 仅从选定的指标中收集信息,并仅根据其数据打印箭头。   Matrix Arrow Indicator MT5   还可以为所有新信号发送终端、推送通知或电子邮件警报。无论您是黄牛、日内交易者还是波段交易者, Mat
75 USD
Blahtech Supply Demand MT5
Blahtech Limited
4.45 (11)
Supply Demand uses previous price action to identify potential imbalances between buyers and sellers. The key is to identify the better odds zones, not just the untouched ones. Blahtech Supply Demand indicator delivers functionality previously unavailable on any trading platform. This 4-in-1 indicator not only highlights the higher probability zones using a multi-criteria strength engine, but also combines it with multi-timeframe trend analysis, previously confirmed swings and engulfing detecto
99 USD
TPA True Price Action indicator reveals the true price action of the market makers through 100% non-repainting signals strictly at the close of a candle! TPA shows entries and re-entries, every time the bulls are definitely stronger than the bears and vice versa. Not to confuse with red/green candles. The shift of power gets confirmed at the earliest stage and is ONE exit strategy of several. There are available now two free parts of the TPA User Guide for our customers. The first "The Basics"
168 USD
Strong Support mt5
Vasiliy Strukov
5 (6)
支撑位和阻力位长期以来一直是市场分析的有力工具。 强支撑指标绘制基于本地价格最低值的支撑水平,以及基于本地价格最大值的阻力水平。 我的其他发展可以在这里查看 建议与趋势指标一起使用,例如黄金-这将允许您根据趋势进行交易,同时确定整合或趋势反转区域,以及在支撑位和阻力位设置止损和获利。 购买后立即与我联系,以获得设置和个人奖金! 传入参数 - 指示器不需要复杂的设置,主要参数是色标的调整。 支撑位和阻力位长期以来一直是市场分析的有力工具。 强支撑指标绘制基于本地价格最低值的支撑水平,以及基于本地价格最大值的阻力水平。 我的其他发展可以在这里查看 建议与趋势指标一起使用,例如黄金-这将允许您根据趋势进行交易,同时确定整合或趋势反转区域,以及在支撑位和阻力位设置止损和获利。 购买后立即与我联系,以获得设置和个人奖金! 传入参数 - 指示器不需要复杂的设置,主要参数是色标的调整。
50 USD
Blahtech Market Profile MT5
Blahtech Limited
5 (8)
Market Profile defines a number of day types that can help the trader to determine market behaviour. A key feature is the Value Area, representing the range of price action where 70% of trading took place. Understanding the Value Area can give traders valuable insight into market direction and establish the higher odds trade. It is an excellent addition to any system you may be using. Blahtech Limited presents their Market Profile indicator for the MetaTrader community. Inspired by Jim Dalton’s
99 USD
Owl Smart Levels MT5
Sergey Ermolov
5 (7)
指標指南   |   Owl Smart Levels策略  |  MT4版本  |  如何安裝?   |   FAQ Owl Smart Levels Indicator 是一個完整的交易系統,包含 Bill Williams 的高級分形、構建正確的市場波浪結構的 Valable ZigZag 以及標記準確入場水平的斐波那契水平等流行的市場分析工具 進入市場和地方獲利。 交易系統的詳細說明見 Owl Trend Strategy - Smart Levels 篇。 力量在於簡單! Owl Smart Levels 交易系統非常易於使用,因此適合專業人士和剛開始研究市場並為自己選擇交易策略的人。 策略和指標中沒有隱藏的秘密公式和計算方法,所有策略指標都是公開的。 Owl Smart Levels 允許您快速查看進入交易的信號,突出顯示下訂單的水平並向您發送有關已出現信號的通知。 優點很明顯: 清楚地顯示主要和更高時間框架的趨勢方向。 指示儀器信號的出現。 標記開單、止損設置和固定利潤的水平。 沒有多餘的,只有必要的結構! ZigZag 表示全球趨勢的方向,因此也表示貿易方向。 市場
97 USD
Italo Volume Indicator MT5
Italo Santana Gomes
4.69 (13)
BUY INDICATOR AND GET EA FOR FREE AS A BONUS + SOME OTHER GIFTS! ITALO VOLUME INDICATOR  is the best volume indicator ever created, and why is that? The Indicator works on all time-frames and assets, indicator built after 6 years of experience on forex and many other markets. You know many volume indicators around the internet are not complete, does not help, and it's difficult to trade, but the Italo Volume Indicator is different , the Italo Volume Indicator shows the wave volume, when market
65 USD
ACB Breakout Arrows MT5
KEENBASE SOFTWARE SOLUTIONS
5 (1)
The ACB Breakout Arrows indicator provides a crucial entry signal in the market by detecting a special breakout pattern. The indicator constantly scans the chart for a settling momentum in one direction and provide the accurate entry signal right before the major move. Get multi-symbol and multi-timeframe scanner from here - Scanner for ACB Breakout Arrows MT 5 Key features Stoploss   and Take Profit levels are provided by the indicator. Comes with a MTF Scanner dashboard which tracks the br
145 USD
Auto Order Block with break of structure Detect Break of Structure , Mark Order Block and draw Entry / Stop and Risk to Reward lines when Order block is touch by price with Alert. Trend is Manually set to filter signals in a direction by a button on the chart. Entry / Stop and Risk to Reward lines can also be switch on / off by button on chart. Futures Auto Mark Break of Structure Auto Mark Order block Auto Mark higher time frame Point Of  Interest ( POI ) Popup Alert when BoS , Order block
55 USD
Trend Line Map Pro MT5
STE S.S.COMPANY
4.8 (5)
趋势线图指标是趋势筛选器指标的插件。它用作趋势筛选器(趋势线信号)生成的所有信号的扫描仪。 它是基于趋势筛选器指标的趋势线扫描仪。如果您没有 Trend Screener Pro Indicator,Trend Line Map Pro 将无法使用。 It's a Trend Line Scanner based on Trend Screener Indicator. If you don't have Trend Screener Pro Indicator,     the Trend Line Map Pro will not work . 通过访问我们的 MQL5 博客,您可以下载趋势线图指标的免费版本。购买前试用,不受 Metatrader Tester 限制。 :  点击这里 1. 容易获得的优势 根据货币和时间范围显示买入和卖出信号。 评估自图表中出现箭头以来价格上涨或下跌的点数。 (趋势筛选指标箭头) 显示信号的时序。 获取多时间范围和多货币警报以购买和出售警报。 2. 如何使用趋势线图 如何显示买卖信号仪表板? 如果您有任何问题或需
50 USD
Legacy of Gann for MT5
Pavel Zamoshnikov
5 (2)
The indicator very accurately determines the levels of the possible end of the trend and profit fixing. The method of determining levels is based on the ideas of W.D.Gann, using an algorithm developed by his follower Kirill Borovsky. Extremely high reliability of reaching levels (according to K. Borovsky  - 80-90%) Indispensable for any trading strategy – every trader needs to determine the exit point from the market! Precisely determines targets on any timeframes and any instruments (forex, met
65 USD
Introduction to EFW Analytics EFW Analytics was designed to accomplish the statement "We trade because there are regularities in the financial market". EFW Analytics is a set of tools designed to maximize your trading performance by capturing the repeating fractal geometry, known as the fifth regularity in the financial market. The functionality of EFW Analytics consists of three parts. Firstly, Equilibrium Fractal Wave Index is an exploratory tool to support your trading logic to choose which r
200 USD
FX Power MT5
Daniel Stein
4.3 (23)
你想成为一个持续盈利的五星级外汇交易商吗? 1. 阅读我们的简单 交易系统 的基本描述 ,以及 它在2020年的主要战略更新 2. 发送您的购买截图,以获得您的个人邀请,参加我们的独家交易聊天。 FX Power 是第一个具有所有时间框架的完整历史的货币强度表。 它分析所有主要货币的势头和强度,以确定高概率交易。 主要特点 所有主要货币的完整强度历史 跨越所有时间框架的货币强度历史 在所有经纪商和图表中的计算结果完全相同 100%可靠的实时计算---无重绘 可通过下拉列表选择时间段 一个图表中可以有多个实例 可移动的FX Power显示(通过拖放)。 适用于高分辨率的QHD、UHD和4K显示器 自动的终端配置 针对平板电脑和触摸屏的使用进行了优化 通过电子邮件、信息和手机通知发出警报 可供EA请求的缓冲区 如何使用FX Power进行交易? 使用FX Power柱状图按钮来显示你需要的货币线,并比较短期和长期分析,以确定有效的组合。 A.交易货币直方图线的 "交叉 "情况 如果欧元与美元交叉,则买入 如果欧元向下穿越美元,则卖出 B.交易不同时间段的确认模式
66 USD
XQ Indicator MT5
Marzena Maria Szmit
5 (1)
The signal conditions are a combination of three indicators, and XQ Forex Indicators only display  medium and long-term trends . The indicator's efficacy has been improved with the addition of a filter that blocks out false signals. The XQ Forex Indicator can be used on  FX pairs, CFDs, and Cryptocurrencies . There are two type of signals:  Buy or Sell and Big Long or Big Short It is possible to enable sending emails when a major trend-change signal is detected, as well as to display the alerts
179 USD
支撑和阻力筛选器是 MetaTrader 的一个级别指标,它在一个指标内提供多种工具。 可用的工具有: 1. 市场结构筛选器。 2. 看涨回调区。 3. 看跌回调区。 4.每日枢轴点 5.每周枢轴点 6. 每月枢轴点 7. 基于谐波形态和成交量的强大支撑和阻力。 8. 银行级区域。 限时优惠:HV 支撑和阻力指示器仅售 50 美元且终生可用。 (原价 125$) 通过访问我们的 MQL5 博客,您可以找到我们所有带有分析示例的高级指标: 单击此处 主要特点 基于谐波和音量算法的强大支撑和阻力区域。 基于谐波和成交量算法的看涨和看跌回调区域。 市场结构筛选器 每日、每周和每月的枢轴点。 文档 所有支持和阻力筛选器文档(说明)和策略详细信息均可在我们 MQL5 博客的这篇文章中找到: 单击此处。 接触 如果您有任何问题或需要帮助,请通过私信联系我。 作者 SAYADI ACHREF,金融科技软件工程师,Finansya 创始人。
50 USD
MetaBands M5
Vahidreza Heidar Gholami
5 (2)
MetaBands使用强大且独特的算法绘制通道并检测趋势,以便为交易者提供进出交易的潜在点。它是一个通道指标和强大的趋势指标。它包括不同类型的通道,可以通过使用输入参数简单地合并以创建新通道。MetaBands使用所有类型的警报通知用户市场事件。 功能 支持大多数通道算法 强大的趋势检测算法 能够合并不同类型的通道 多时间帧和多货币(信号矩阵) 所有类型的警报功能(声音、屏幕闪烁、推送通知、电子邮件、弹出窗口、箭头) 它永远不会重绘 趋势检测 MetaBands使用在通道内振荡的蓝色线来检测趋势。当该线遇到通道的上界时,表明开始下跌趋势,当它遇到下界时,表明开始上涨趋势。如果蓝线接近中线,则市场处于整理期。 该指标使用独特的方法来检测趋势。一开始可能看起来有些复杂,但如果您观看视频教程,您就会意识到它是多么强大且易于使用。 入场和出场信号 当趋势变化或价格穿过上下通道时,MetaBands会立即通过不同的方法提醒交易者,这些方法可以在指标设置中启用。 信号矩阵 要监视来自不同时间框架的多个符号并在一个地方查看信号,请单击右上角按钮或按键盘上的M键以打开信号矩阵。该矩阵可以
129 USD
该指标可识别30多种日本烛台图案,并在图表上突出显示它们。这只是价格行为交易者不能没有的那些指标之一。 一夜之间增强您的技术分析 轻松检测日本烛台图案 交易可靠且通用的反转模式 使用延续模式安全跳入已建立的趋势 指示器不重涂并实施警报 该指标实现了一个多时间框架 仪表板 它检测到的模式太多,以至于图表看起来非常混乱,难以阅读。交易者可能需要禁用指标输入中的不良图案,以使图表更具可读性。 它检测1条,2条,3条和多条样式 它检测逆转,持续和弱点模式 模式可以启用或禁用 看涨模式用 蓝色 标记,空头模式用 红色 标记,中性模式用 灰色 标记。 检测到的烛台模式列表 从1到5小节的突破距离(又名线罢工) 法基(又名Hikkake) 反间隙 三名士兵/三只乌鸦 锤子/流星/吊人 吞没 外上/外下 Harami 由上至下 晨星/晚星 踢球者 刺穿/乌云 皮带托 从1到5小条上升三分/下降三分 田木峡 并排间隙 视窗 前进块/下降块 审议 Marubozu 挤压警报(又称主蜡烛) Dojis 设置 PaintBars 使用条形的颜色打开/关闭图案的突出显示。 DisplayLabel
99 USD
Trend Scanner mt5 GS
Vasiliy Strukov
5 (10)
趋势扫描仪从多符号和多时间框架中扫描市场趋势,并将其显示在图表上的可移动面板上,它使用黄金指标进行分析功能包括警报和电子邮件,以及推送通知。 交易者可以选择他选择的多对进行显示。 趋势扫描仪是查看趋势方向的绝佳工具,可用于手动交易或 EA 交易,仅允许根据趋势买入或卖出订单。 趋势扫描仪从多符号和多时间框架中扫描市场趋势,并将其显示在图表上的可移动面板上,它使用黄金指标进行分析功能包括警报和电子邮件,以及推送通知。 交易者可以选择他选择的多对进行显示。 趋势扫描仪是查看趋势方向的绝佳工具,可用于手动交易或 EA 交易,仅允许根据趋势买入或卖出订单。 实时结果可以在这里查看。 购买后立即联系我以获取设置和个人奖励!   购买后立即联系我以获取设置和个人奖励!
50 USD
Royal Scalping Indicator M5
Vahidreza Heidar Gholami
5 (8)
Royal Scalping Indicator is an advanced price adaptive indicator designed to generate high-quality trading signals. Built-in multi-timeframe and multi-currency capabilities make it even more powerful to have configurations based on different symbols and timeframes. This indicator is perfect for scalp trades as well as swing trades. Royal Scalping is not just an indicator, but a trading strategy itself. Features Price Adaptive Trend Detector Algorithm Multi-Timeframe and Multi-Currency Trend Low
149 USD
ICT Concepts
Minh Truong Pham
The ICT Concepts indicator regroups core concepts highlighted by trader and educator "The Inner Circle Trader" (ICT) into an all-in-one toolkit. Features include Market Structure (MSS & BOS), Order Blocks, Imbalances, Buyside/Sellside Liquidity, Displacements, ICT Killzones, and New Week/Day Opening Gaps. It’s one kind of Smart money concepts. DETAILS Market Structure Market structure labels are constructed from price breaking a prior extreme point. This allows a user to determine the current ma
55 USD
Royal Wave Pro M5
Vahidreza Heidar Gholami
3.67 (3)
Royal Wave is a Trend-Power oscillator which has been programmed to locate and signal low-risk entry and exit zones. Its core algorithm statistically analyzes the market and generates trading signals for overbought, oversold and low volatile areas. By using a well-designed alerting system, this indicator makes it easier to make proper decisions regarding where to enter and where to exit trades. Features Trend-Power Algorithm Low risk Entry Zones and Exit Zones Predictions for Overbought and Over
129 USD
PZ Trend Trading MT5
PZ TRADING SLU
3.67 (3)
许多盈利交易者不仅知道如何识别市场趋势,而且也能把握趋势建立后的交易机会。 Pz 趋势交易 指标设计用来在趋势行情中尽可能的赚取利润。 已建立的趋势提供了一揽子交易机会,但大多数趋势交易指标完全忽视了它们,让交易者在趋势行情时完全不知道该如何做!一般趋势指标只通知有关的趋势变化,但根本不足以得到卓越的回报. Pz 趋势交易 指标比一般趋势指标显示多达 20 倍的交易 , 因为它注重所谓的市场时机。它不仅显示当前的市场趋势,也有回调,内柱线的突破和调整。它令您在趋势回调之后介入,安全的柱线内突破金字塔加仓,以及发现潜在的反转,和已知的调整。 趋势改变 一个趋势改变在市场方向变化时发生。趋势变化在图表上用带数字的彩色圆圈显示。蓝色 (1) 信号为上涨开始, 而红色 (1) 信号为下跌开始。趋势变化并非评估当前价格动作的结果, 它意味着交易设置是不定时地。如果您正确使用本指标, 在趋势变化时, 您将将已经入场 (参看下面的调整)。 回调 但凡趋势在运动中,行情上下抖动,盈利者收割利润,且其它参与者入场。趋势回调代表好的买入机会,通常是由主力获利离场导致。如果行情在回调后回归上行, 指
175 USD
Stargogs Spike Catcher
Lorenzo Edward Beukes
5 (6)
Stargogs Spike Catcher V3.11 This Indicator is Developed To milk the BOOM and CRASH indices . Send me Message if you need any help with the indicator.  CHECK OUT THE STARGOGS SPIKE CATCHER EA/ROBOT V3: CLICK HERE ALSO CHECK OUT SECOND TO NONEFX SPIKE CATCHER:   CLICK HERE STARGOGS SPIKE CATCHER V3.11 WHATS NEW! Brand New Strategy. This is the Indicator you need for 2023. The Indicator Gives you an Entry at a time when conditions are met and you should use TP & SL. New Trendline that changes col
100 USD
Price Action Finder Multi MT5
Siarhei Vashchylka
5 (2)
The Price Action Finder Multi indicator is a multi-currency and multi-timeframe indicator. It searches for patterns of the Price Action system on all standard time frames at once and on a large (up to 60) number of instruments (currencies, stocks, metals, etc.). The resulting patterns are placed by the indicator in a table at the bottom of the screen. Patterns: At the moment, the indicator contains the following patterns: Outside bar , Inside bar , Pin bar , Force bar , PPR , as well as the In
149 USD
作者的更多信息
Market Reversal Alerts EA
LEE SAMSON
4.28 (18)
市場反轉警報 EA 由同名指標(可在此處獲得)提供支持,並根據市場結構變化進行交易。 默認情況下,每次指標發送市場反轉警報時,EA 都會進行交易,並將根據您在 EA 設置中設置的條件和過濾器來交易這些警報。 當價格向當前趨勢方向移動時,它會繪製支撐矩形,並在價格急劇反轉並發出市場結構轉變或重新測試反轉信號時進行交易。更多在指標頁面。 此描述中有太多設置和可能性,因此有一篇包含所有設置的博客文章和一個視頻,在此博客文章中詳細介紹了它們。  https://www.mql5.com/en/blogs/post/745502 請閱讀上面的帖子並觀看視頻,您將了解 EA 的強大功能。 這篇博文中有一些很好的設置文件可以幫助您入門和策略。 https://www.mql5.com/en/blogs/post/745984 基於市場結構逆轉微調和創建多種策略和交易風格的可能性是無窮無盡的!了解我的人都知道,我每天都通過這個 EA 賺大錢,我很高興向您展示如何做。 EA 的 MT4 版本也可在此處獲得: https://www.mql5.com/en/market/
99 USD
从股票指数开盘时发生的爆炸性走势中获利,每天给自己一个可操作的优势。 开盘区间突破 EA 可以根据您的喜好进行调整,以捕捉 DAX、DOW、NASDAQ 和 S&P500 等主要股指每天开盘后形成的趋势。 这些开盘每天都在同一时间发生,因此您知道何时会发生波动,并且通常就在开盘强劲趋势形成之后,您可以使用此 EA 捕捉并在整个交易时段内进行。 开盘区间通常是股市开盘后的前 5-15 分钟,在大型市场参与者下达初始订单后,投机交易开始。 打开后,往往会发生以下两种情况之一。 1. 你得到一个区间或轮换日,指数上涨,反转,然后再次反转。 如今,策略和 EA 经常会收支平衡或出现小额亏损。 2. 你会遇到一个趋势日,市场通常会连续几个小时朝一个方向发展。 这些是策略真正银行的日子,并且随着趋势的发展可以轻松产生 3-10% 的回报。 MT5 Versions is here:  https://www.mql5.com/en/market/product/91232 有关 EA 交易方式的策略指南可在此处找到: https://www.mql5.com/en/blogs/post/
99 USD
Market Reversal Alerts
LEE SAMSON
4.19 (118)
成為突破者,隨著價格反轉,市場結構會改變利潤。 訂單突破者指示器可以識別趨勢或價格走勢何時接近枯竭並準備好逆轉。它會提醒您市場結構的變化,通常會在發生逆轉或重大回調時發生。 該指標使用專有計算來確定突破和價格動能。每當在可能的耗盡點附近形成新的高點時,指標就會繪製最後一個生成該高點的順序塊。然後,它將隨價格移動隨價格跟隨定單。然後,當價格轉向相反方向並突破該訂單塊時,它會提醒您,從而創建新的市場結構並開始趨勢或重大回調的可能逆轉。 訂單塊是在創建高/低之前的最後一個相反的彩色蠟燭,並且當價格跌破這些關鍵區域以下時,這表明趨勢可能會發生短期或長期反轉。 特徵 提醒您關鍵耗盡點的市場結構變化 價格接近耗盡水平時自動提取訂單塊 在一個方向繼續移動時,在價格後面跟踪定單,以提醒您最佳的反轉輸入 將顏色更改為純色塊,以顯示何時發生市場結構中斷。 適用於所有交易品種和時間範圍 內置集成的彈出窗口和電子郵件警報 策略和如何與定單破壞者指標進行交易 當斷路器塊發生時,您有兩個選擇。 看左邊!我們正在尋求供應/需求或支撐/阻力位嗎?市場結構轉變(逆轉)通常發生在價格重新測試舊水平或
49 USD
ADR Reversal Indicator
LEE SAMSON
4.09 (11)
ADR 反轉指標一目了然地顯示當前價格相對於其正常平均每日範圍的交易位置。當價格超過您選擇的平均範圍和高於它的水平時,您將通過彈出窗口、電子郵件或推送獲得即時警報,以便您可以快速跳入回調和反轉。該指標在圖表上在平均每日範圍極值處繪製水平線,並在這些水平之上延伸,這些水平附加了價格超過它們的數學概率。下面的更多細節...... ADR 警報儀表板補充指標並監控所有配對也可在此處獲得: https://www.mql5.com/en/market/product/62756 MT5 版本也可在此處獲得: https://www.mql5.com/en/market/product/64477/ 大約 60% 的時間價格在其正常的平均每日範圍 (ADR) 內交易並推高這些水平通常是價格急劇波動的指標,通常會出現回調(獲利了結)走勢。您可以通過交易從每日範圍的頂部或底部回落到最近的支撐位或阻力位來利用這些急劇波動。 收集了超過 20 年的歷史數據,以找出主要外匯對和一系列交叉盤的價格超出特定 ADR 水平的平均百分比。該數據表明價格僅在 3% 的時間內超過其 ADR 的 20
49 USD
自动在你的图表上画出支撑位和阻力位以及推动性蜡烛缺口,这样你就可以看到价格接下来可能会走向哪里和/或可能会逆转。 该指标旨在作为我的网站(The Market Structure Trader)上教授的头寸交易方法的一部分,并显示目标和潜在入场的关键信息。 该指标有两个核心功能和四个附加功能: 核心功能1 - 日线、周线和月线的自动支持和阻力线 该指标为你自动绘制过去2天以及6周和数月前的最新支撑和阻力水平。你可以完全自定义这些水平的外观以适合你,并显示多少个。这些关键水平通常作为主要的支持和阻力区,价格将从这里转向并回撤或逆转。它们也是价格将走向的目标,因此你可以迅速看到在价格可能转向之前交易的潜在距离。 核心特征2--推进型蜡烛缺口目标 推进性缺口蜡烛是银行和机构通过在任何市场上执行大额头寸而创造的强劲、快速的移动。这些大阳线一旦形成,有两个关键作用。 1. 1.它们作为一个方向性信号,因为大型市场参与者已经选择了一个方向,一旦发生,价格往往会在一段时间内继续移动。 2. 2.更重要的是,它们作为目标,因为这些区域往往会让其他大玩家的头寸 "越位",价格在绝大
49 USD
此儀表板是與市場結構反轉指標一起使用的警報工具。它的主要目的是提醒您在特定時間範圍內的逆轉機會,以及像指標一樣重新測試警報(確認)。儀表板設計為單獨放置在圖表上,並在後台工作,以向您發送有關您選擇的貨幣對和時間範圍的警報。它是在許多人要求衝刺以同時監控多個貨幣對和時間框架而不是讓市場反轉指標在一個 MT4 中的多個圖表上運行之後開發的。它會在 M5、M15、M30、H1、H4 和 D1 時間範圍內發出警報。當然,與交易中的任何事情一樣,更高的時間框架效果最好。 該儀表板被設計為市場結構反轉指標的附加組件。它將獨立工作,並提醒市場反轉警報指標給出的模式和信號。 在此處獲取市場反轉警報指標: https://www.mql5.com/en/market/product/46295 此儀表板的 MT5 版本可在此處獲得: https://www.mql5.com/en/market/product/65828 此處提供 EA:汽車交易市場反轉警報! https://www.mql5.com/en/market/product/65383 我創建的用於繪製矩形並提醒特定貨幣對的市
49 USD
市場反轉警報 EA 由同名指標( https://www.mql5.com/en/market/product/57892 )提供支持,並根據市場結構變化進行交易。 默認情況下,每次指標發送市場反轉警報時,EA 都會進行交易,並將根據您在 EA 設置中設置的條件和過濾器來交易這些警報。 當價格向當前趨勢方向移動時,它會繪製支撐矩形,並在價格急劇反轉並發出市場結構轉變或重新測試反轉信號時進行交易。更多在指標頁面。 https://www.mql5.com/en/market/product/57892 此描述中有太多設置和可能性,因此有一篇包含所有設置的博客文章和一個視頻,在此博客文章中詳細介紹了它們。 https://www.mql5.com/en/blogs/post/745502 請閱讀上面的帖子並觀看視頻,您將了解 EA 的強大功能。 這篇博文中有一些很好的設置文件可以幫助您入門和策略。 https://www.mql5.com/en/blogs/post/745984 基於市場結構逆轉微調和創建多種策略和交易風格的可能性是無窮無盡的!了解我的人都知
99 USD
控制您的外匯投資組合。立即查看您的站立位置、工作原理以及導致您疼痛的原因! 此處提供 MT5 版本: https://www.mql5.com/en/market/product/58658 交易經理儀表板旨在讓您一目了然地顯示您當前在外匯市場中的每個頭寸,並使風險管理和貨幣敞口更易於理解。 對於通過多個頭寸或交易網格和籃子策略逐漸進入市場的交易者,這是需要查看的關鍵信息。監控終端中的多個位置通常很難管理。 過度槓桿化和使用低風險:回報是新交易者和一些經驗豐富的交易者面臨的主要問題,交易經理向您展示您對每種貨幣的風險敞口,確保您不會同時進行雙向交易。 特徵: 未平倉交易 - 查看您當前按貨幣對排序的所有未平倉交易。您不僅可以在該貨幣對上看到您的方向偏差,還可以在該貨幣對上運行的每筆交易或頭寸上看到您的方向偏差。 回撤和利潤信息 - 立即查看您交易活躍的貨幣對的回撤或盈利情況。輕鬆識別需要管理的交易。 手數大小 - 查看您在每個貨幣對上的手數以及您進行的交易數量。 風險敞口 - 查看您對每種貨幣的方向偏差,以確保您不會在另一個入場時以相反的方向交易。另請查看您在該貨幣中使用
49 USD
成為突破者,隨著價格反轉,市場結構會改變利潤。 訂單突破者指示器可以識別趨勢或價格走勢何時接近枯竭並準備好逆轉。它會提醒您市場結構的變化,通常會在發生逆轉或重大回調時發生。 該指標使用專有計算來確定突破和價格動能。每當在可能的耗盡點附近形成新的高點時,指標就會繪製最後一個生成該高點的順序塊。然後,它將隨價格移動隨價格跟隨定單。然後,當價格轉向相反方向並突破該訂單塊時,它會提醒您,從而創建新的市場結構並開始趨勢或重大回調的可能逆轉。 訂單塊是在創建高/低之前的最後一個相反的彩色蠟燭,並且當價格跌破這些關鍵區域以下時,這表明趨勢可能會發生短期或長期反轉。 特徵 提醒您關鍵耗盡點的市場結構變化 價格接近耗盡水平時自動提取訂單塊 在一個方向繼續移動時,在價格後面跟踪定單,以提醒您最佳的反轉輸入 將顏色更改為純色塊,以顯示何時發生市場結構中斷。 適用於所有交易品種和時間範圍 內置集成的彈出窗口和電子郵件警報 策略和如何與定單破壞者指標進行交易 當斷路器塊發生時,您有兩個選擇。 看左邊!我們正在尋求供應/需求或支撐/阻力位嗎?市場結構轉變(逆轉)通常發生在價格重新測試舊水平或
49 USD
RSI / TDI 警报仪表板允许您一次监控您交易的每个主要货币对的 RSI(由您选择)。 您可以通过两种方式使用它: 1. 选择多个时间框架,当有多个时间框架超出正常交易条件时,破折号会显示给您。一个很好的指标表明价格最近在推高,因为它在多个时间范围内达到了超买或超卖水平,因此很快就会出现回调或逆转。 2. 使用一个时间框架(您最喜欢的交易)和多个 RSI 水平向您展示该时间框架内 RSI 扩展的强度。当价格在一个方向上非常猛烈地推动太长时间并且市场应该出现获利了结时,这是一种进行均值回归交易的好策略。在示例屏幕截图中,您可以看到 H4 RSI 在 25 水平之上扩展了 2 对,这比典型的价格走势要远得多,因此是做多的好机会。 当蜡烛在所选时间范围内收盘时,仪表板将提醒您选择水平的扩展条件(超买和​​超卖)。您可以同时监控 6 个单独的 RSI。您可以独立选择每个时间范围、类型以及超买和超卖水平。 此处提供 MT5 版本: https://www.mql5.com/en/market/product/66307 您可以立即查看任何货币对的状况,并选择那些
49 USD
从股票指数开盘时发生的爆炸性走势中获利,每天给自己一个可操作的优势。 开盘区间突破 EA 可以根据您的喜好进行调整,以捕捉 DAX、DOW、NASDAQ 和 S&P500 等主要股指每天开盘后形成的趋势。 这些开盘每天都在同一时间发生,因此您知道何时会发生波动,并且通常就在开盘强劲趋势形成之后,您可以使用此 EA 捕捉并在整个交易时段内进行。 开盘区间通常是股市开盘后的前 5-15 分钟,在大型市场参与者下达初始订单后,投机交易开始。 打开后,往往会发生以下两种情况之一。 1. 你得到一个区间或轮换日,指数上涨,反转,然后再次反转。 如今,策略和 EA 经常会收支平衡或出现小额亏损。 2. 你会遇到一个趋势日,市场通常会连续几个小时朝一个方向发展。 这些是策略真正银行的日子,并且随着趋势的发展可以轻松产生 3-10% 的回报。 MT4 Version:  https://www.mql5.com/en/market/product/90502/ 有关 EA 交易方式的策略指南可在此处找到: https://www.mql5.com/en/blogs/post/751229 包
99 USD
ADR Alert Dashboard
LEE SAMSON
3.73 (11)
ADR 警報儀表板一目了然地向您顯示當前價格相對於其正常平均每日範圍的交易位置。當價格超過您選擇的平均範圍和高於它的水平時,您將通過彈出窗口、電子郵件或推送獲得即時警報,以便您可以快速跳入回調和反轉。破折號旨在放置在空白圖表上,只需坐在背景中並在達到水平時提醒您,因此您無需坐下來觀看甚至看! 此處提供 MT5 版本: https://www.mql5.com/en/market/product/66316 新:現在還向您顯示平均每周和每月範圍,並提醒他們! 獲取在您的圖表上繪製水平的 ADR 反轉指標: https://www.mql5.com/en/market/product/62757 大約 60% 的時間價格在其正常的平均每日範圍 (ADR) 內交易並推高這些水平通常是價格急劇波動的指標,通常會出現回調(獲利了結)走勢。您可以通過交易從每日範圍的頂部或底部回落到最近的支撐位或阻力位來利用這些急劇波動。 收集了超過 20 年的歷史數據,以找出主要外匯對和一系列交叉盤的價格超出特定 ADR 水平的平均百分比。該數據表明價格僅在 3% 的時間內超過其 ADR 的 2
49 USD
自动在你的图表上画出支撑位和阻力位以及推动性蜡烛缺口,这样你就可以看到价格接下来可能会走向哪里和/或可能会逆转。 该指标旨在作为我的网站(The Market Structure Trader)上教授的头寸交易方法的一部分,并显示目标和潜在入场的关键信息。 MT4 Version:  https://www.mql5.com/en/market/product/97246/ 该指标有两个核心功能和四个附加功能: 核心功能1 - 日线、周线和月线的自动支持和阻力线 该指标为你自动绘制过去2天以及6周和数月前的最新支撑和阻力水平。你可以完全自定义这些水平的外观以适合你,并显示多少个。这些关键水平通常作为主要的支持和阻力区,价格将从这里转向并回撤或逆转。它们也是价格将走向的目标,因此你可以迅速看到在价格可能转向之前交易的潜在距离。 核心特征2--推进型蜡烛缺口目标 推进性缺口蜡烛是银行和机构通过在任何市场上执行大额头寸而创造的强劲、快速的移动。这些大阳线一旦形成,有两个关键作用。 1. 1.它们作为一个方向性信号,因为大型市场参与者已经选择了一个方向,一旦发生,价格往往会在一段
49 USD
控制您的外匯投資組合。立即查看您的站立位置、工作原理以及導致您疼痛的原因! 此處提供 MT4 版本: https://www.mql5.com/en/market/product/58375 交易經理儀表板旨在讓您一目了然地顯示您當前在外匯市場中的每個頭寸,並使風險管理和貨幣敞口更易於理解。 對於通過多個頭寸或交易網格和籃子策略逐漸進入市場的交易者,這是需要查看的關鍵信息。監控終端中的多個位置通常很難管理。 過度槓桿化和使用低風險:回報是新交易者和一些經驗豐富的交易者面臨的主要問題,交易經理向您展示您對每種貨幣的風險敞口,確保您不會同時進行雙向交易。 特徵: 未平倉交易 - 查看您當前按貨幣對排序的所有未平倉交易。您不僅可以在該貨幣對上看到您的方向偏差,還可以在該貨幣對上運行的每筆交易或頭寸上看到您的方向偏差。 回撤和利潤信息 - 立即查看您交易活躍的貨幣對的回撤或盈利情況。輕鬆識別需要管理的交易。 手數大小 - 查看您在每個貨幣對上的手數以及您進行的交易數量。 風險敞口 - 查看您對每種貨幣的方向偏差,以確保您不會在另一個入場時以相反的方向交易。另請查看您在該貨幣中使用
49 USD
對稱三角形圖表模式代表價格被迫向上突破或崩盤之前的一段收縮和盤整期。向下趨勢線的突破標誌著新的看跌趨勢的開始,而從上部趨勢線的突破則表明新的看漲趨勢的開始。 獲取儀表板以立即監控您為對稱三角形模式交易的所有工具和時間範圍! https://www.mql5.com/en/market/product/69169/ 此處提供 MT5 版本: https://www.mql5.com/en/market/product/70006/ 該指標識別這些模式並在 4 個關鍵點形成且價格再次回落至三角形時提醒您,以便您為潛在的突破做好準備。對稱三角形並不總是完全對稱的,價格可以向上或向下突破,但通常最成功的突破是在形成三角形第一個點的高點或低點的方向上。因此,該指標為我們提供了對突破的看漲或看跌偏見,並採用顏色編碼並針對該特定方向發出警報。沒有必要只在一個方向進行交易,但是因為任何一個方向的突破都是可能的,但是當突破與第一個點趨勢一致時,您往往會獲得更大更快的價格變動和更好的風險回報。 輸入和配置選項: 開始搜索蠟燭 - 指標將開始尋找多少根蠟燭來尋找已完成的形態 Fib Max
49 USD
ADR 反轉指標一目了然地顯示當前價格相對於其正常平均每日範圍的交易位置。當價格超過您選擇的平均範圍和高於它的水平時,您將通過彈出窗口、電子郵件或推送獲得即時警報,以便您可以快速跳入回調和反轉。該指標在圖表上在平均每日範圍極值處繪製水平線,並在這些水平之上延伸,這些水平附加了價格超過它們的數學概率。下面的更多細節...... ADR 警報儀表板補充指標並監控所有配對也可在此處獲得: https://www.mql5.com/en/market/product/66316 MT4 版本也可在此處獲得: https://www.mql5.com/en/market/product/62757 大約 60% 的時間價格在其正常的平均每日範圍 (ADR) 內交易並推高這些水平通常是價格急劇波動的指標,通常會出現回調(獲利了結)走勢。您可以通過交易從每日範圍的頂部或底部回落到最近的支撐位或阻力位來利用這些急劇波動。 收集了超過 20 年的歷史數據,以找出主要外匯對和一系列交叉盤的價格超出特定 ADR 水平的平均百分比。該數據表明價格僅在 3% 的時間內超過其 ADR 的 200%,
49 USD
對稱三角形模式儀表板允許您同時監控多個市場和時間範圍內的對稱三角形模式,由此處提供的對稱三角形模式指標繪製: https://www.mql5.com/en/market/product/68709/ 訪問上述指標以了解有關如何形成對稱三角形模式的更多信息,以及如何簡單地遵循交易它們的策略。 儀表板是獨立產品,不需要指示器工作。它僅監視模式並在它們形成時發出警報,因此如果您想實際查看圖表上的模式,您還需要對稱三角形模式指示器。 對稱三角形圖表模式代表價格被迫向上突破或崩盤之前的一段收縮和盤整期。下趨勢線的突破標誌著新的看跌趨勢的開始,而上趨勢線的突破表明新的看漲趨勢的開始。 此儀表板可識別這些模式,並在 4 個關鍵點形成且價格再次回落至三角形時提醒您,以便您為潛在的突破做好準備。儀表板將監控您想要為您不斷交易的所有主要時間框架和工具,並在蠟燭接近時檢查每個工具和時間框架,以便在新模式形成時發出警報。 輸入和配置選項: 模板名稱 - 當您單擊警報時,破折號將為該工具和時間範圍打開一個新圖表,這是它將使用的模板的名稱。 有效信號柱 - 儀表板之前的蠟燭/柱數量將顯示警
49 USD
價格行為工具包 EA 主要為剝頭皮而設計,但可用於所有時間框架,以根據您的止損水平正確計算手數大小來快速進入市場,它允許您快速進入交易(即時或在蠟燭高點和低點掛起訂單),然後隨著市場的變化調整止損並獲利了結。 如需使用的所有功能、設置和最佳實踐策略的完整列表,請單擊此處: https://www.mql5.com/en/blogs/post/748072 基於風險的進入 快速下單按鈕可根據您賬戶的風險百分比讓您進入頭寸。它會根據您選擇的風險和止損距離自動計算您的手數。因此,您需要確保您的經紀商允許您使用 0.01 手大小,如果您被迫使用 0.10 或 1.00 手增量,它將不起作用。 快速交易執行按鈕 它在您的圖表上放置了快速交易執行按鈕,這些按鈕會立即自動打開、關閉或調整交易。除了正常的進場按鈕外,您還有一個快速關閉按鈕來退出所有頭寸,將您的止損移動到盈虧平衡(或您的平均盈虧平衡,如果您有多個交易未平倉),將買入和賣出止損設置在當前或最後一根蠟燭高點之上並且能夠僅平倉您最有利可圖的頭寸,這樣您就可以在多筆交易開始為您工作時從您擴大的頭寸中獲得部分利潤。 止損模式按鈕可讓
49 USD
此儀表板是與市場結構反轉指標一起使用的警報工具。它的主要目的是提醒您在特定時間範圍內的逆轉機會,以及像指標一樣重新測試警報(確認)。儀表板設計為單獨放置在圖表上,並在後台工作,以向您發送有關您選擇的貨幣對和時間範圍的警報。它是在許多人要求衝刺以同時監控多個貨幣對和時間框架而不是讓市場反轉指標在一個 MT4 中的多個圖表上運行之後開發的。它會在 M5、M15、M30、H1、H4 和 D1 時間範圍內發出警報。當然,與交易中的任何事情一樣,更高的時間框架效果最好。 我創建的用於繪製矩形並提醒特定貨幣對的市場結構變化的指標運行儀表板。 儀表板僅允許您監控多個貨幣對和時間範圍,並在打開一個圖表時收到警報。 該儀表板被設計為市場結構反轉指標的附加組件。它將獨立工作,並提醒市場反轉警報指標給出的模式和信號。 在此處獲取市場反轉警報指標的 MT5 版本: https://www.mql5.com/en/market/product/46295 此儀表板的 MT4 版本在這裡: https://www.mql5.com/en/market/product/62751/ 指標輸入/設置:
49 USD
RSI / TDI 警報儀表板允許您一次監控您交易的每個主要貨幣對的 RSI(由您選擇)。 您可以通過兩種方式使用它: 1. 選擇多個時間框架,當有多個時間框架超出正常交易條件時,破折號會顯示給您。一個很好的指標,表明價格最近在推高,因為它在多個時間框架內達到了超買或超賣水平,因此很快就會出現回調或逆轉。 2. 使用一個時間框架(您最喜歡的交易)和多個 RSI 水平向您展示該時間框架內 RSI 擴展的強度。當價格在一個方向上非常強烈地推動太長時間並且市場應該出現獲利了結時,這是一種進行均值回歸交易的好策略。在示例屏幕截圖中,您可以看到 H4 RSI 在 25 水平之上擴展了 2 對,這比典型的價格行為要遠得多,因此是做多的好機會。 當蠟燭在所選時間範圍內收盤時,儀表板將提醒您選擇水平的擴展條件(超買和超賣)。您可以同時監控 6 個單獨的 RSI。您可以獨立選擇每個時間範圍、類型以及超買和超賣水平。 此處提供 MT4 版本: https://www.mql5.com/en/market/product/62698 您可以立即查看任何貨幣對的狀況,並選擇那些準
49 USD
最后! MT4的随机指标,可在一张图表上显示多个时间范围!立即在4个不同的时间范围内查看主线和信号线的实际位置,以帮助您做出有根据的交易决策。 一个真正的MTF随机指标,适合需要在多个时间范围内直观地看到指标告诉他们的交易者,没有向上或向下的箭头或显示的数字。 在时间范围之间不再轻拂即可查看其他随机指标的位置!留在您最喜欢的时间范围内,并获得所有内容的概述! 不用再怀疑其他随机指标上的向上或向下箭头是主线还是信号线,或者它真正指向的角度是! 不再有看起来不正确的MTF随机指标,因为它们被拉长或不准确,占用了宝贵的图表空间! 从您的交易图表中查看是否在所有时间范围内都发生了交叉! 特征 从M1到每月选择您喜欢的时间范围(总共最多4个) 并排显示的每个随机变量的最新部分 根据MT4随附的库存指示器完全可自定义的颜色,级别和参数 设置警报会告诉您所选的所有时间范围都超买或超卖的时间 集成的弹出,推送和电子邮件警报 与图表成比例,因此每个随机占据屏幕上可用空间的1/4 选择显示2个,3个或4个随机数,然后手动设置每个占用的宽度。 放大和缩小主图表,以与您偏好的市场观点
49 USD
價格行為工具包 EA 主要為剝頭皮而設計,但可用於所有時間框架,以根據您的止損水平正確計算手數大小來快速進入市場,它允許您快速進入交易(即時或在蠟燭高點和低點掛起訂單),然後隨著市場的變化調整止損並獲利了結。 如需使用的所有功能、設置和最佳實踐策略的完整列表,請單擊此處: https://www.mql5.com/en/blogs/post/748072 基於風險的進入 快速下單按鈕可根據您賬戶的風險百分比讓您進入頭寸。它會根據您選擇的風險和止損距離自動計算您的手數。因此,您需要確保您的經紀商允許您使用 0.01 手大小,如果您被迫使用 0.10 或 1.00 手增量,它將不起作用。 快速交易執行按鈕 它在您的圖表上放置了快速交易執行按鈕,這些按鈕會立即自動打開、關閉或調整交易。除了正常的進場按鈕外,您還有一個快速關閉按鈕來退出所有頭寸,將您的止損移動到盈虧平衡(或您的平均盈虧平衡,如果您有多個交易未平倉),將買入和賣出止損設置在當前或最後一根蠟燭高點之上並且能夠僅平倉您最有利可圖的頭寸,這樣您就可以在多筆交易開始為您工作時從您擴大的頭寸中獲得部分利潤。 止損模式按鈕可讓
49 USD
對稱三角形圖表模式代表價格被迫向上突破或崩盤之前的一段收縮和盤整期。向下趨勢線的突破標誌著新的看跌趨勢的開始,而從上部趨勢線的突破則表明新的看漲趨勢的開始。 此處提供 MT4 版本: https://www.mql5.com/en/market/product/68709/ 該指標識別這些模式並在 4 個關鍵點形成且價格再次回落至三角形時提醒您,以便您為潛在的突破做好準備。對稱三角形並不總是完全對稱的,價格可以向上或向下突破,但通常最成功的突破是在形成三角形第一個點的高點或低點的方向上。因此,該指標為我們提供了對突破的看漲或看跌偏見,並採用顏色編碼並針對該特定方向發出警報。沒有必要只在一個方向進行交易,但是因為任何一個方向的突破都是可能的,但是當突破與第一個點趨勢一致時,您往往會獲得更大更快的價格變動和更好的風險回報。 輸入和配置選項: 開始搜索蠟燭 - 指標將開始尋找多少根蠟燭來尋找已完成的形態 Fib Max Retracement - 最大回撤價格可以形成點 3,4 和 5 Fib 最小回撤 - 可以形成點 3,4 和 5 的最低迴撤價格 僅顯示最後信號 - 僅
49 USD
筛选:
sweethomeboy2
288
sweethomeboy2 2023.02.10 12:02 
 

BIG 5 STARS, after purchasing the ADR Reversal Indicator, this tool makes things much easier for me. Another great indicator from the author

David
141
David 2022.05.31 08:48 
 

Very useful Dashboard, highly recommended!

metaangel
237
metaangel 2022.02.18 17:14 
 

用户没有留下任何评级信息

Kasim Ijelu
396
Kasim Ijelu 2022.01.04 17:17 
 

1stly I would like to thank you for all of you're hard work, you are truly an inspiration to all novice and advanced traders. Making it simple clear and easy for ordinary people from various back grounds who have the discipline and dedication to continuously learn to trade for a living, you have allowed me and I'm sure others to be encouraged and inspired to succeed. So what ever you aim was or dream for others I personally think you have achieved it thank you. and happy 2022

LEE SAMSON
49847
来自开发人员的回复 LEE SAMSON 2022.01.04 17:42
Glad you find what I do useful Kasim. It take a lot of time and commitment to become consistently profitable and hours in front of the charts. The tools I use and have created are the one I've found work for me and if they work for others my job is done. :)
Hope you have a profitable 2022.
回复评论