Labor
- Göstergeler
- Sürüm: 1.2
- Güncellendi: 24 Mart 2022
- Etkinleştirmeler: 5

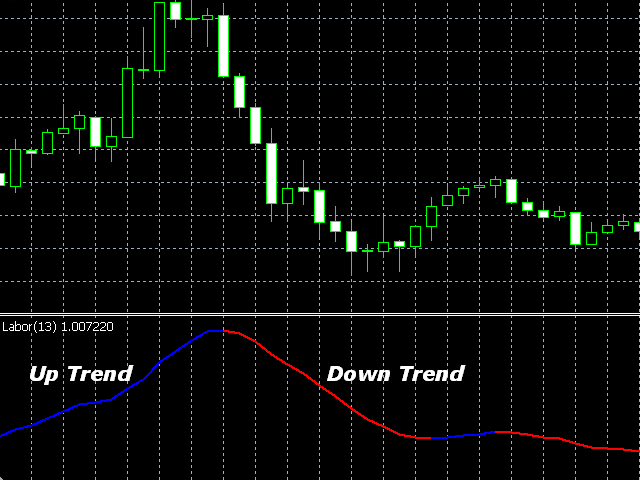
Labor is a technical analysis indicator defining trend direction and power, as well as signaling a trend change.
The indicator is based on a modified EMA (Exponential Moving Average) with an additional smoothing filter.
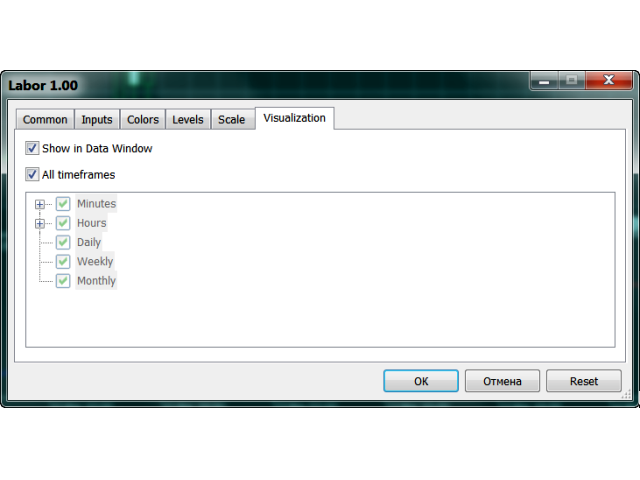
The indicator works on any timeframe.
The uptrend is shown as a blue line, while a downtrend - as a red one.
Close a short position and open a long one if the line color changes from red to blue.
Close a long position and open a short one if the line color changes from blue to red.
Use a small stop loss to protect against false signals.
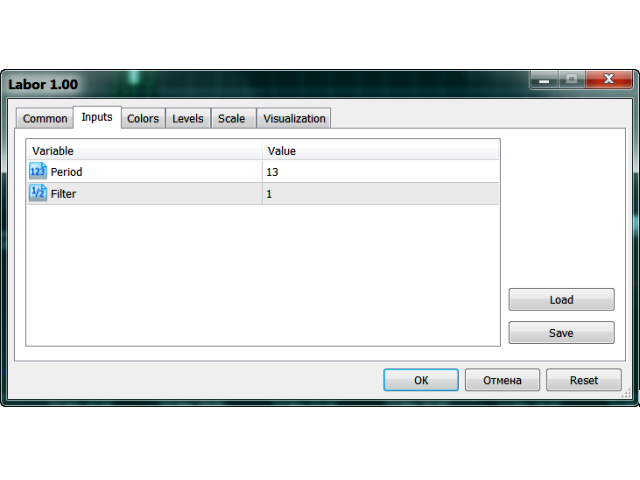
The indicator's Inputs tab allows you to select:
- the indicator period;
- the smoothing filter degree.
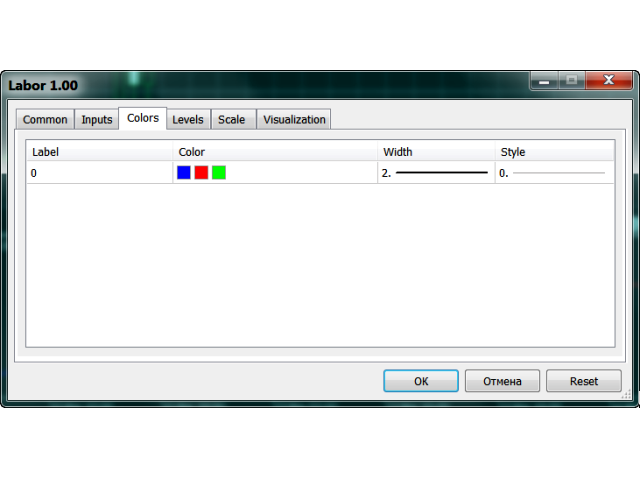
The Colors tab allows you to select the line color, width and style.
Parameters
- period - number of bars used for the indicator calculation;
- filter - smoothing filter degree.


Kullanıcı değerlendirmeye herhangi bir yorum bırakmadı