OrderFlow Candle Classifier
- Göstergeler
- Sürüm: 3.0
- Etkinleştirmeler: 5

Tool Description
The Order Flow Candle Classifier (OFCC) & FVG Monitor is an institutional auction analysis indicator for MetaTrader 5. It decomposes volume into buyer- and seller-initiated flow to classify market participation, locate trapped traders, and detect high-imbalance Fair Value Gaps (FVGs).
Key Components:
-
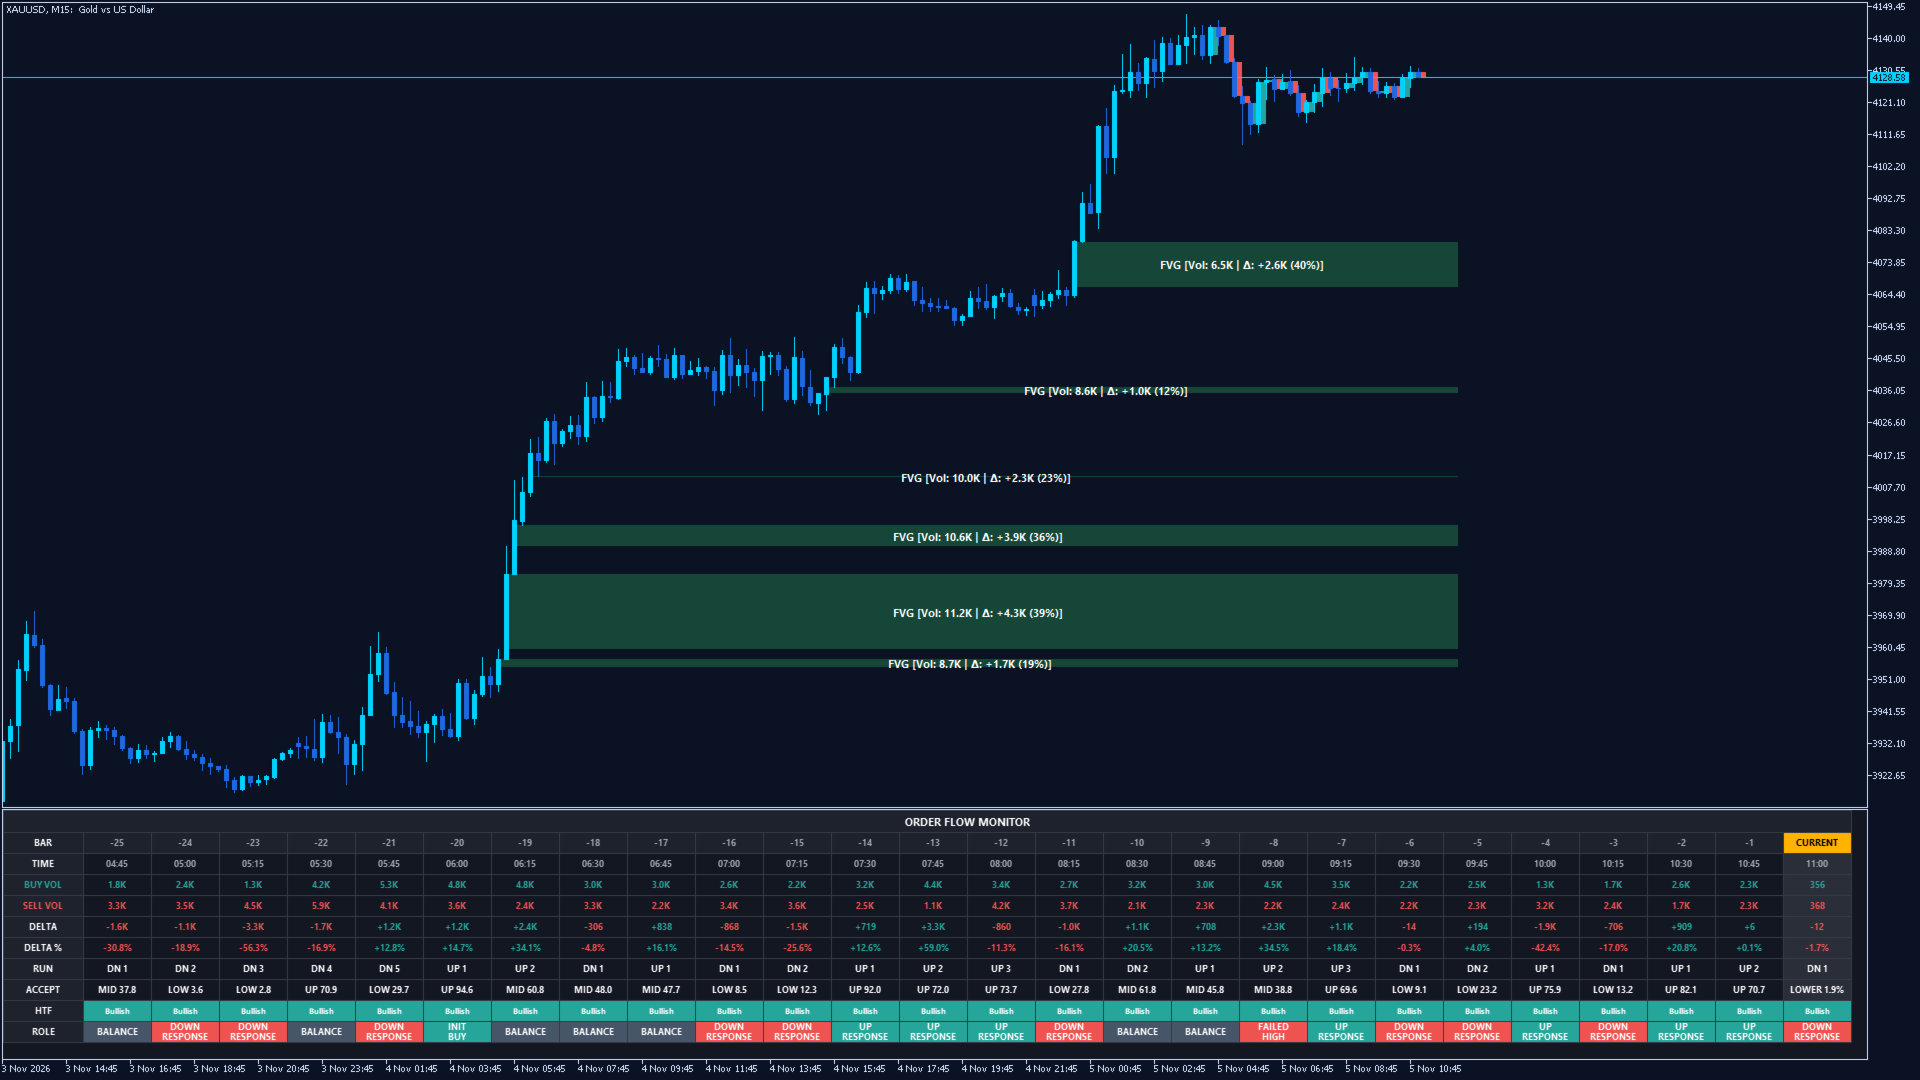
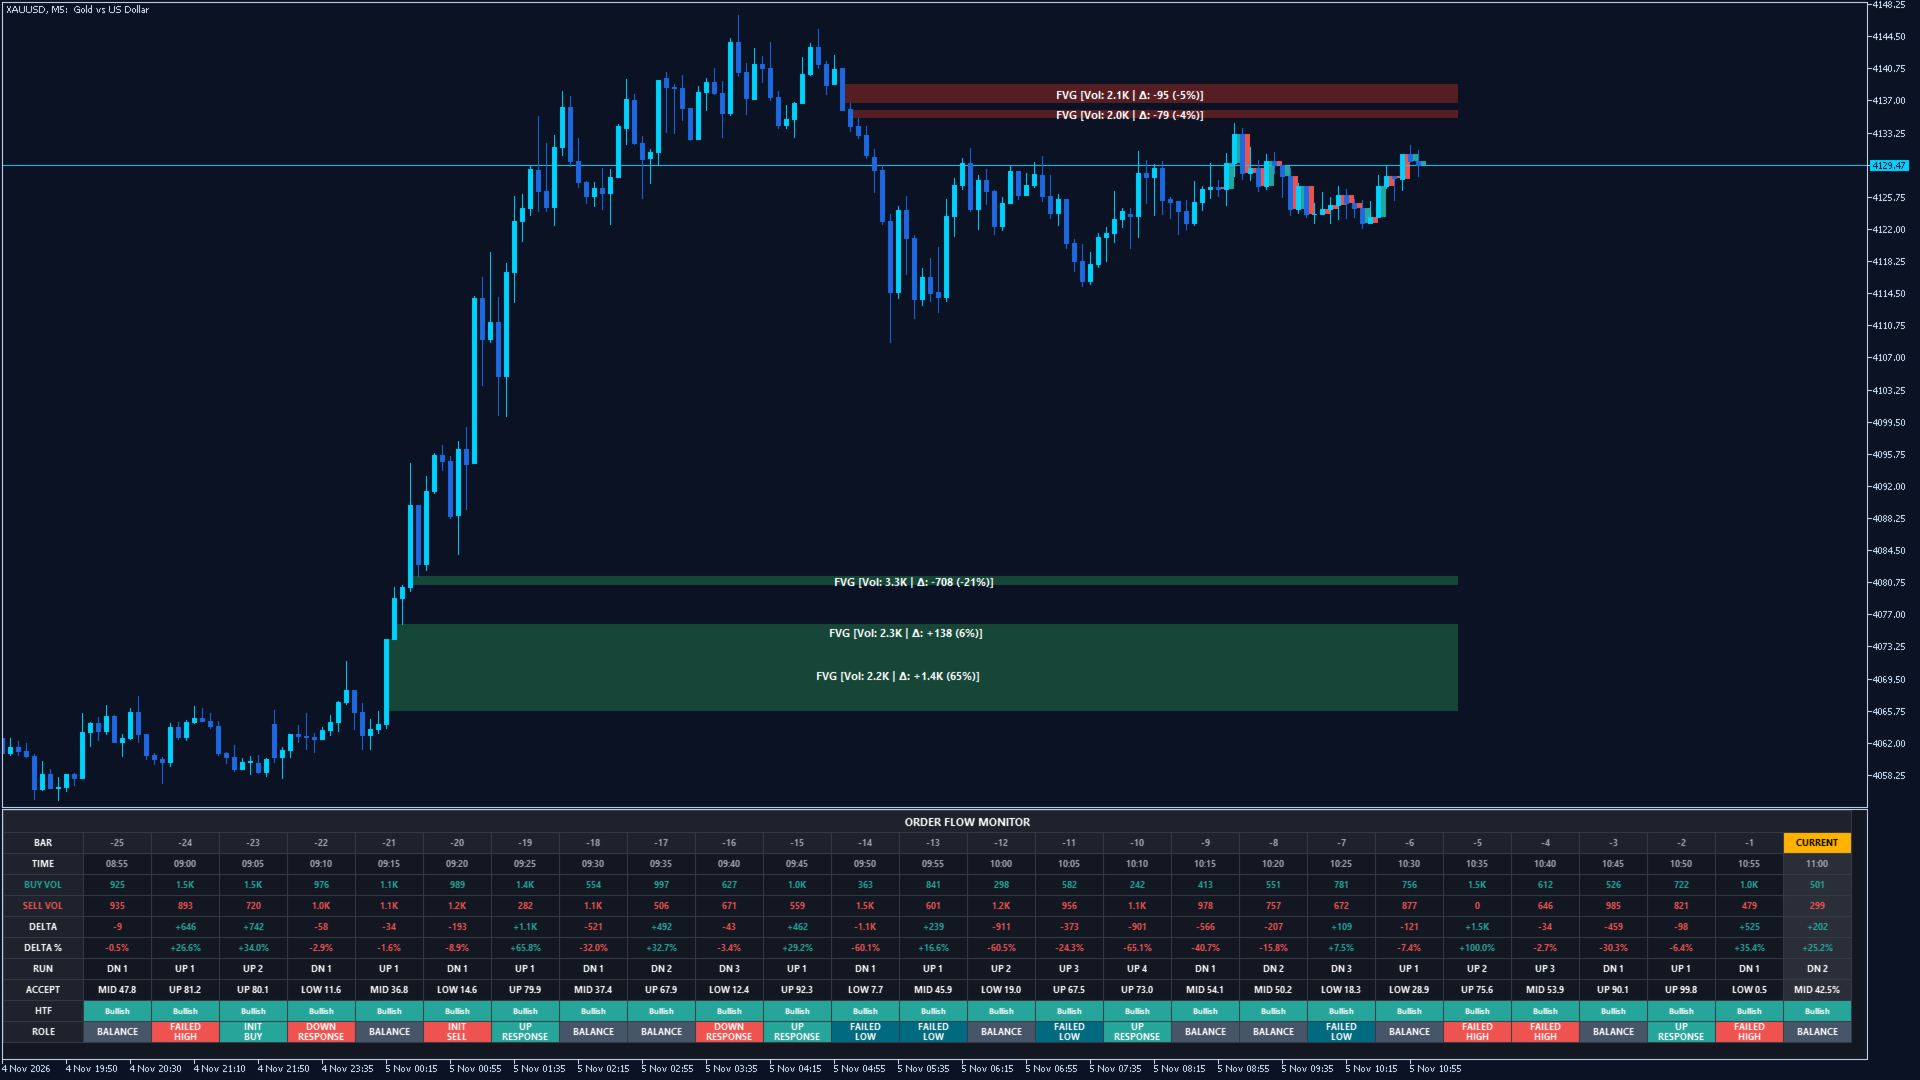
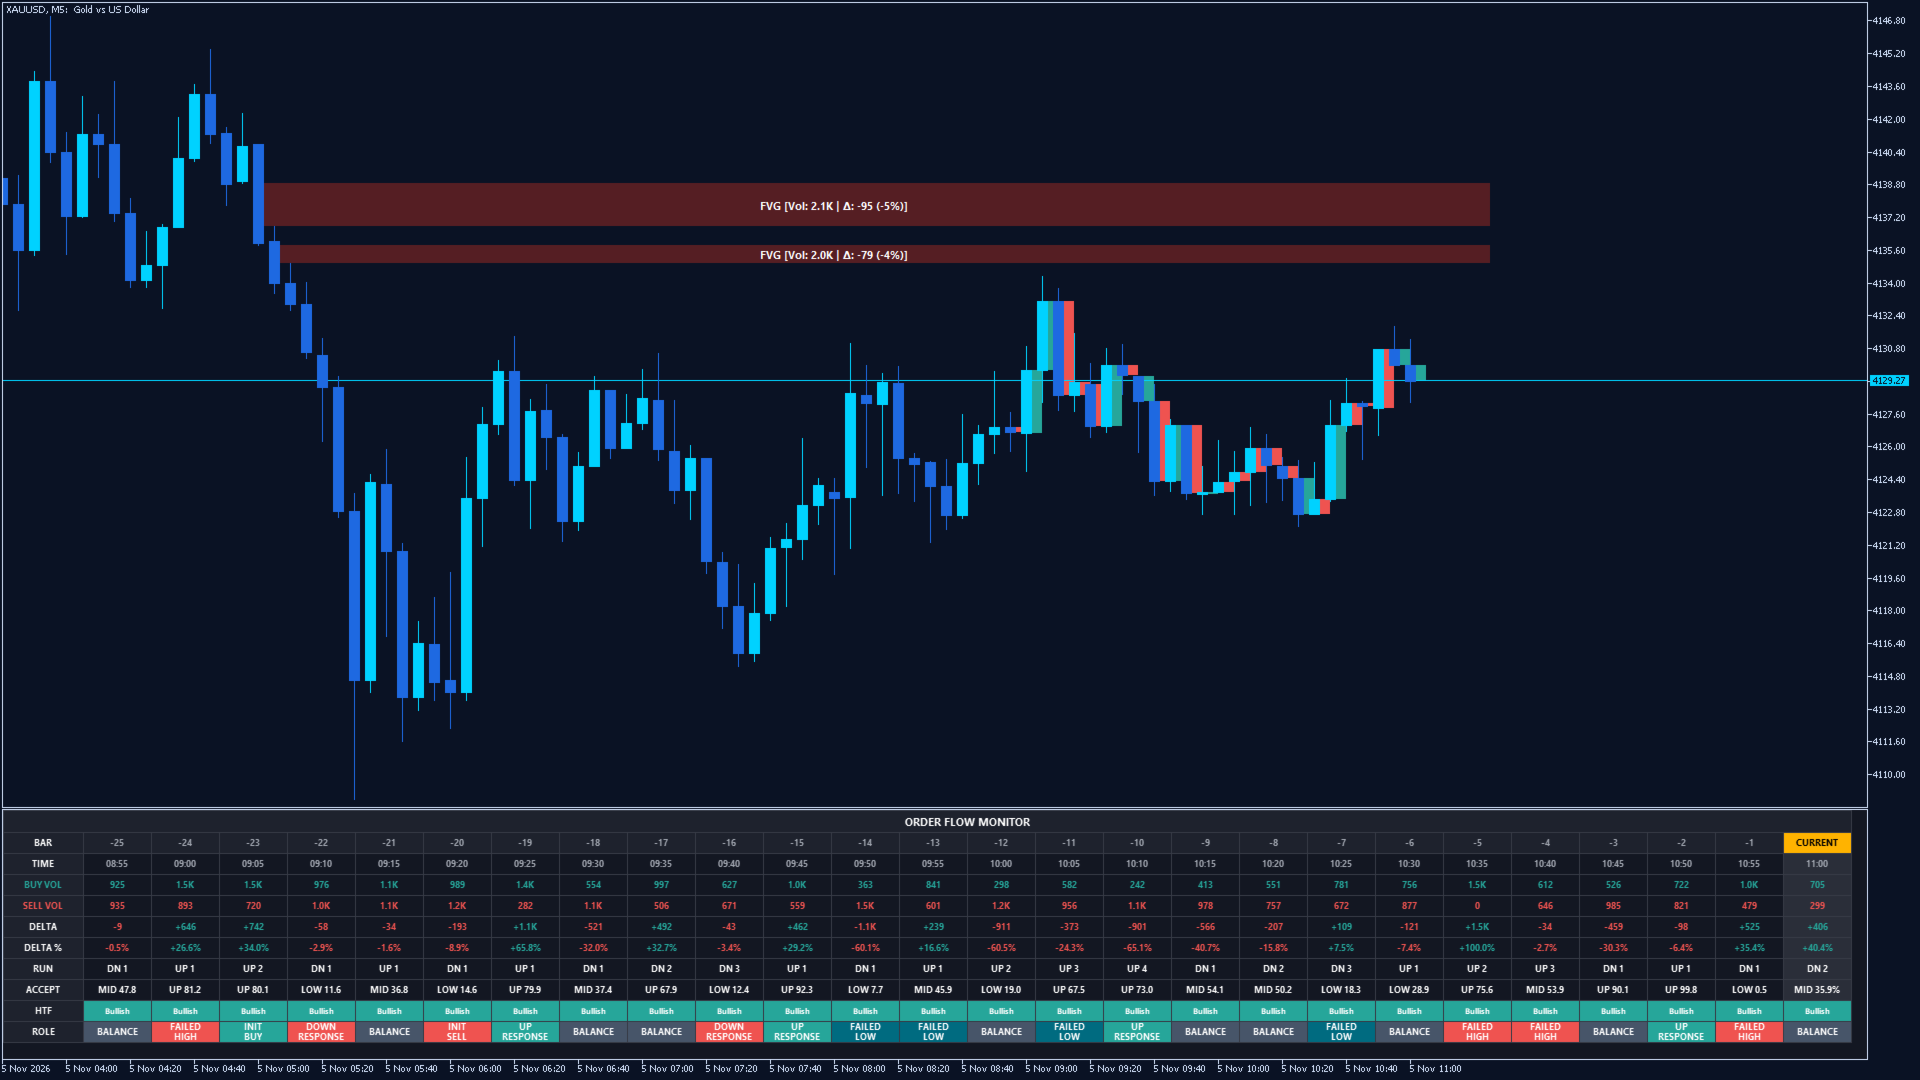
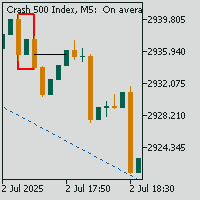
Delta-Colored Candles (Main Chart): Candlestick bodies and wicks are dynamically painted based on real/estimated Delta ( Teal for net buying pressure, Coral Red for net selling pressure).
-
Order Flow Fair Value Gaps (FVGs): Plots unmitigated imbalance zones on the main chart, prints the exact displacement volume and Delta inside the zone, and automatically removes the zone once price mitigates it.
-
Order Flow Monitor (Subwindow Pane): A high-performance canvas dashboard tracking candle-by-candle metrics across 10 layers (Buy/Sell Volume, Delta, Delta %, Directional Run, Range Acceptance, HTF Trend, and Role Badges).
How to Read the Monitor
| Row | Meaning |
| BUY / SELL VOL | Estimated or lower-timeframe volume allocated to buyers vs. sellers. |
| DELTA & DELTA % | Net volume difference (Buy - Sell) and its percentage of total candle volume. |
| RUN | Consecutive candle momentum persistence (UP x / DN x). |
| ACCEPT | Where the candle closed within its range: UP (>67%), MID (33–67%), or LOW (<33%). |
| HTF | Higher Timeframe trend context derived from EMA 20 & 50. |
| ROLE (Badge) | The primary auction behavior: INIT (Initiative flow), FAILED (Trapped breakout), RESPONSE (Absorption), EXHAUST (Exhaustion), or AUCTION/PULL (Trend continuation/pullback). |
Quick Usage / Trading Rules
-
Check Trend Alignment (HTF Row):
-
Only look for buys when the HTF badge is Bullish (Green) and sells when Bearish (Red).
-
-
Identify Imbalance & Liquidity Traps (ROLE Row):
-
Continuation: Look for INIT BUY or UP AUCTION accompanied by elevated Delta % (> +4.0%) and UPPER range acceptance.
-
Reversal / Traps: Look for FAILED HIGH / FAILED LOW when price sweeps a swing level but closes back inside with opposing absorption.
-
-
Execute at FVG Zones (Main Chart):
-
Wait for price to pull back into an unmitigated FVG zone.
-
Verify the FVG's embedded text details (high volume and delta).
-
Enter in the direction of the gap once the candle flips delta color (Teal for Long, Coral for Short).
-