Dynamic Heatmap Bookmap Style
- Göstergeler
-
Antonello Belgrano
 MQL5 Programmer specialized in creating professional Expert Advisors and Indicators.
I develop high-quality strategies as well as custom solutions, optimizations, and personalized Expert Advisors tailored to your specific needs.
Feel free to contact me for any requests or custom projects. - Sürüm: 1.0
- Etkinleştirmeler: 5
Dynamic Heatmap Bookmap Style
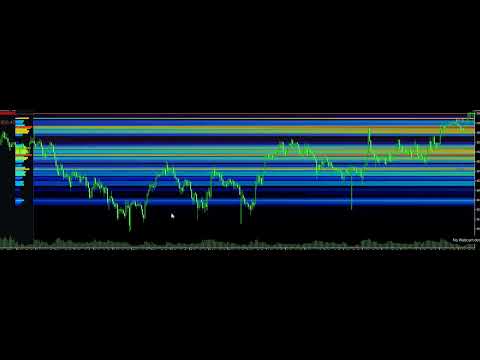
An indicator for MetaTrader 5 that brings Bookmap-style heatmap visualization directly onto your chart, showing where the market has actually concentrated volume and price activity — not just where price has passed through.
What it does
The indicator overlays a real-time heatmap on the chart, highlighting the price zones with the highest activity for the current week using a dynamic color gradient — from cold blue for low-activity zones to hot red for the most active ones — updating continuously as the market evolves.
Alongside the heatmap, a volume panel on the left side of the chart (Order Book style) displays the distribution of activity across price levels, with the current price always visible and the hottest level marked with its exact price.
Clean, professional visuals
The rendering is smooth and polished, with fluid color gradients, crisp lines, and refined transparency effects rather than blocky or approximate shading. Every visual element — heatmap bands, panel, labels, price markers — is drawn with attention to detail, giving the chart a modern, high-end look rather than a "basic indicator" feel.
Value Area and key reference levels
The indicator automatically calculates the Value Area (the price range containing a configurable percentage of total volume, typically 70%) and marks its boundaries with clearly visible lines:
- VAH (Value Area High) and VAL (Value Area Low), the upper and lower edges of the balance zone
- POC (Point of Control), the single price level with the highest volume
These three reference points are widely used in Market Profile–based trading to identify dynamic support/resistance zones and areas of fair value.
Historical depth
Beyond the current week, previous weeks' heatmaps can also be displayed, with intensity fading progressively based on age — making it easy to compare at a glance how the market's zones of interest have shifted over time.
Full customization
Every element is configurable: number of price levels, volume panel width, heatmap transparency, Value Area/VAH/VAL colors, line thickness, number of historical weeks shown, and the heat decay rate over time. This allows the indicator to be adapted to any chart-reading style, from scalping to position analysis.
Who it's for
Designed for traders who follow a volume- and Market Profile–based approach and want a visual, immediate, and continuously updated way to see where the market is really moving — presented with a level of visual polish that matches professional-grade platforms.