ATR Dashboard
- Göstergeler
- Sürüm: 1.0

ATR_Dashboard indicator: description and principle of operation
ATR_Dashboard is an auxiliary tool for MetaTrader 5 that visualizes the current state of volatility for a trading instrument based on the Average True Range (ATR) indicator. It does not generate direct signals to enter a position, but helps the trader assess how much the price has already gone over the current day relative to the average move (ATR), and see benchmarks where this average move may end.
How the indicator works: step-by-step logic
1. Calculation of the ATR on the daily timeframe (D1).
The indicator creates an ATR handle with the period specified in the settings (default is 14 days). This is how the "average true range" is determined — the typical value of the daily price movement in points.
2. Determine the daily range of the current day.
On the D1 timeframe, the indicator analyzes the current daily bar and calculates the actual move made by the price — that is, the real range of movement during the day.
3. Calculation of the percentage and balance.
The indicator calculates two key values:
o Percentage of completed turn: (completed turn/ATR)×100;
o the remainder to the average ATR: ATR is the completed stroke (if the value becomes negative, the indicator sets it to 0).
The values obtained are converted into points, taking into account the _Point variable (standard points for a specific instrument), so that the data is familiar and convenient for the trader to perceive.
4. Information panel display.
A four—line text panel is displayed in the upper-right corner of the graph:
o average stroke (ATR) for a given period - in points;
o the number of points already passed by the price today;
o how many points are left before reaching the average move (ATR);
o percentage of the ATR that has already been passed by the price.
5. Building reference levels when the threshold is reached.
The InpThresholdPct parameter (80% by default) sets the percentage of ATR: As soon as the price passes this threshold, the indicator draws two horizontal lines.:
o top line: dayLow+targetDistance, where targetDistance=ATR×(InpThresholdPct/100);
o bottom line: dayHigh−targetDistance.
These levels show where the price could reach a given percentage of the average move. The lines are displayed only after crossing the threshold and are hidden if the price has not reached it yet.
6. Sending notifications.
If the specified percentage threshold is exceeded for the first time in a day, the indicator may:
o display a pop-up window and sound an alarm through the Alert function;
o send a push notification to your phone via sendNotification — if this option is enabled in the settings.
Key parameters and their significance
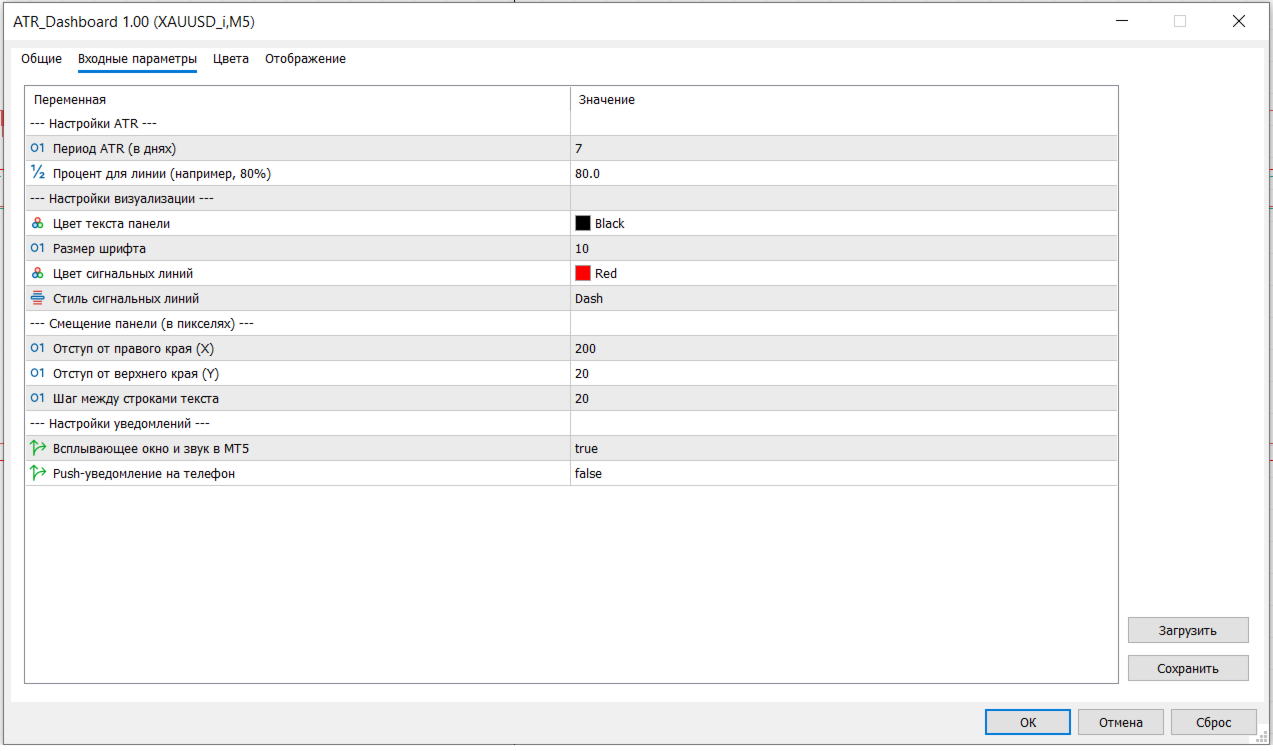
• InpAtrPeriod — the ATR calculation period. The higher the value, the smoother the average value is obtained and the more it lags behind sharp spikes in volatility.
• InpThresholdPct is the percentage threshold at which levels appear and an alert is triggered. For example, a value of 80% means that the indicator reacts when the price has already overcome most of the typical daily movement.
• InpXDistance, InpYDistance — horizontal and vertical displacement of the panel. These parameters allow you to place the information panel so that it does not overlap important sections of the graph.
• InpUseAlert, InpUseNotification — notification switches. They allow the trader not to constantly monitor the chart and receive a signal when the volatility of the day becomes significant relative to the ATR.
Type of indicator
ATR_Dashboard refers to auxiliary (informational) indicators based on a trend-volatile instrument (ATR). However, he is not:
• a trend indicator in its purest form — it does not show the trend direction;
• channel indicator — does not build a channel around the price;
• volume indicator — does not use volume data;
• Level indicator — does not define support and resistance levels as independent trading signals.
Its main task is to assess the current daily volatility relative to the historical norm and give the trader clear guidelines on how "saturated" the trading day turned out to be in terms of price movement.
Practical application
The indicator is convenient to use in combination with other technical analysis tools.:
• Filtering of inputs. If the price has already passed 80-100% of the ATR during the day, it may be risky to expect another strong movement: the main volatility has already been realized. It is worth checking whether the 80% mark coincides with a strong historical level of resistance (in an uptrend) or support (in a downtrend). Matching this level dramatically increases the probability of a rebound. You can also apply Fibonacci levels: corrections often stop at key points. — 38,2 %, 50 %, 61,8 %.
• Setting goals and stop orders. ATR is a common metric for calculating stop loss and take profit. For example, a typical approach is to use 1-2 ATRs to determine these levels.
• Assessment of the nature of the trading day. If the actual daily movement is significantly lower than the ATR, the day is likely to be calm. If it significantly exceeds the ATR, impulsive movements or a trend reversal are possible.