SuerteFx Scanner Pro
- Göstergeler
- Sürüm: 1.20
- Güncellendi: 25 Haziran 2026
- Etkinleştirmeler: 5

What Is SuerteFx Scanner Pro?
SuerteFx Scanner Pro is a technical analysis indicator for MetaTrader 5. It applies Smart Money Concept (SMC) principles to identify market structure, support and resistance zones, liquidity levels, and potential entry areas on the chart.
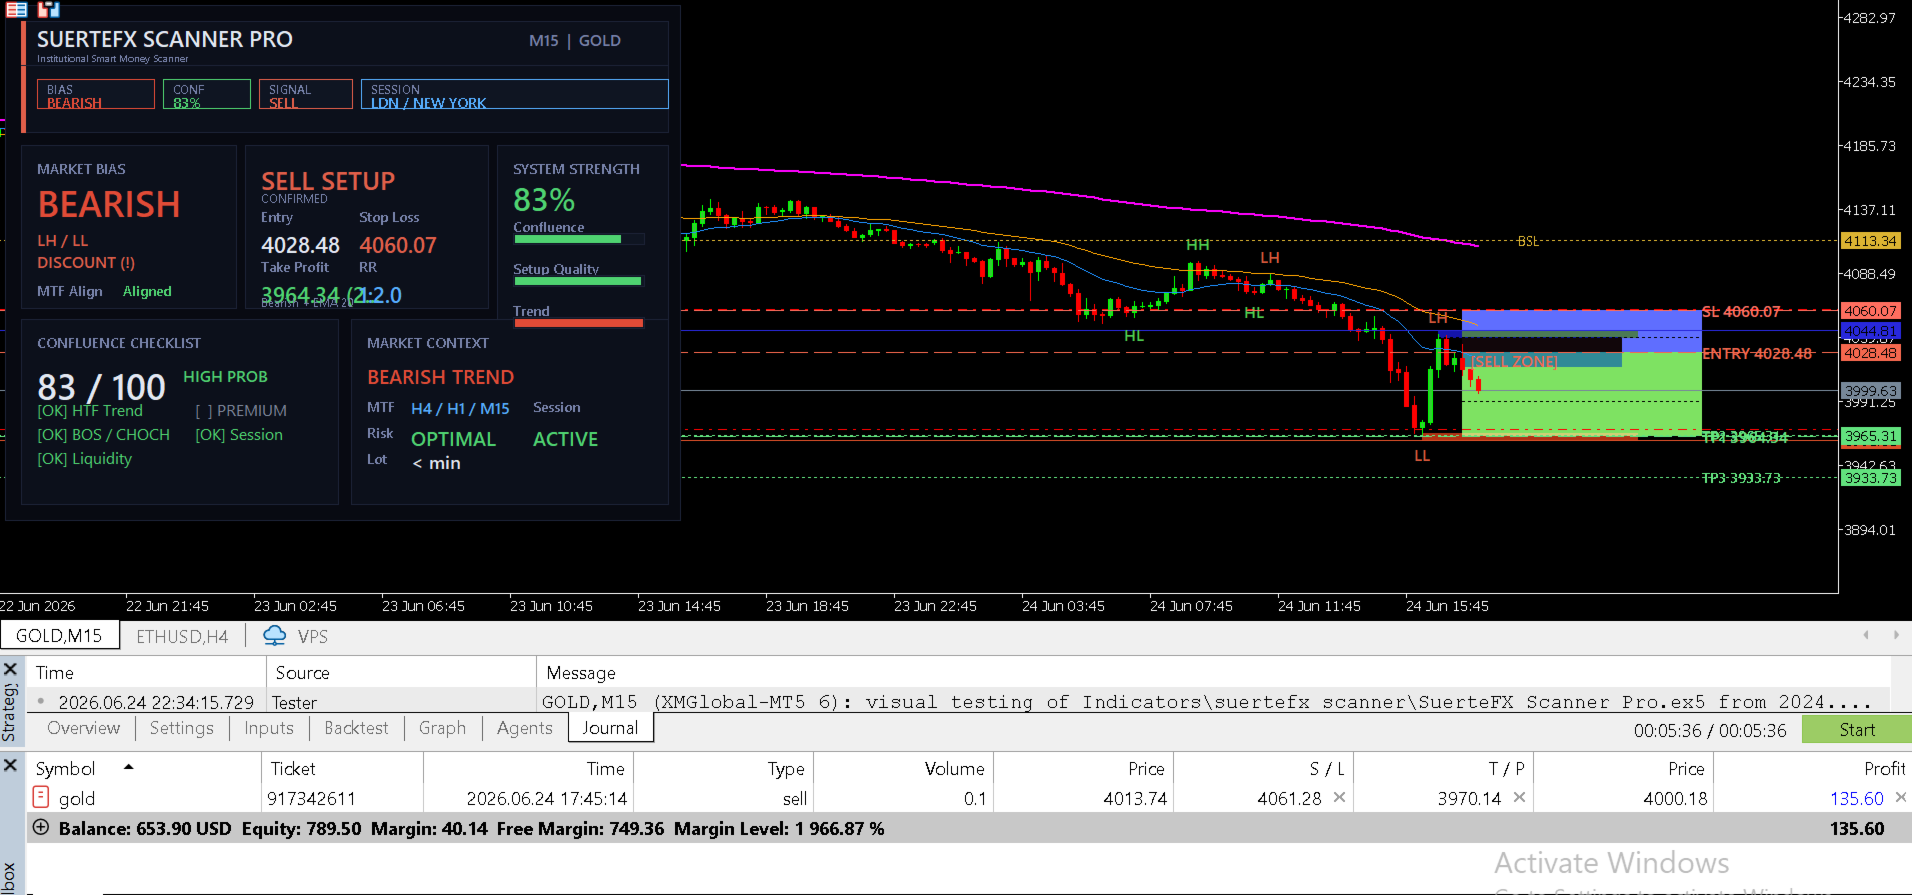
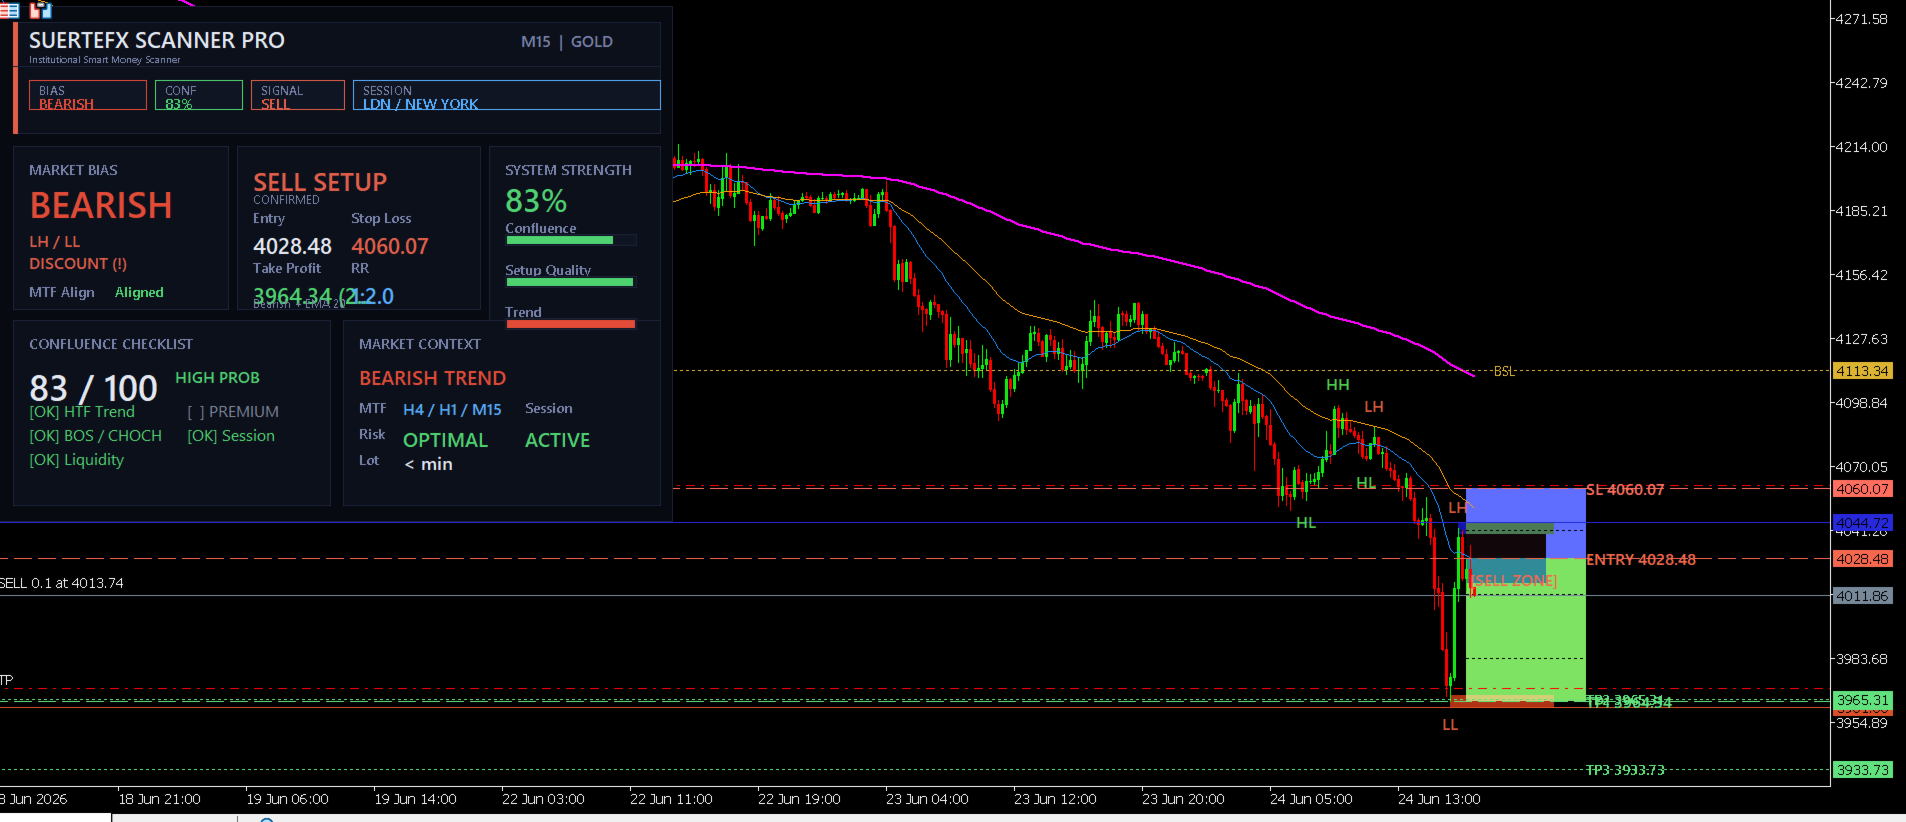
The indicator combines signals from three timeframes and checks six conditions before marking a potential setup. When all six conditions are met and the minimum reward-to-risk ratio is satisfied, the indicator draws an entry zone with stop loss and up to three take profit levels directly on the chart.
How It Works
The indicator monitors price action across three timeframes. The two higher timeframes are selected automatically based on the current chart period. It evaluates the following conditions before drawing a setup:
- Trend direction on the higher timeframe (using Exponential Moving Averages)
- Break of Structure or Change of Character on the current timeframe
- Liquidity level swept (buy-side or sell-side)
- Price position relative to the 50-period Exponential Moving Average
- Active trading session (London, New York)
- Volatility level within a normal range (based on Average True Range)
A setup is only drawn when all six conditions are confirmed and the reward-to-risk ratio meets the minimum threshold set in the inputs. All calculations are based on confirmed closed bars.
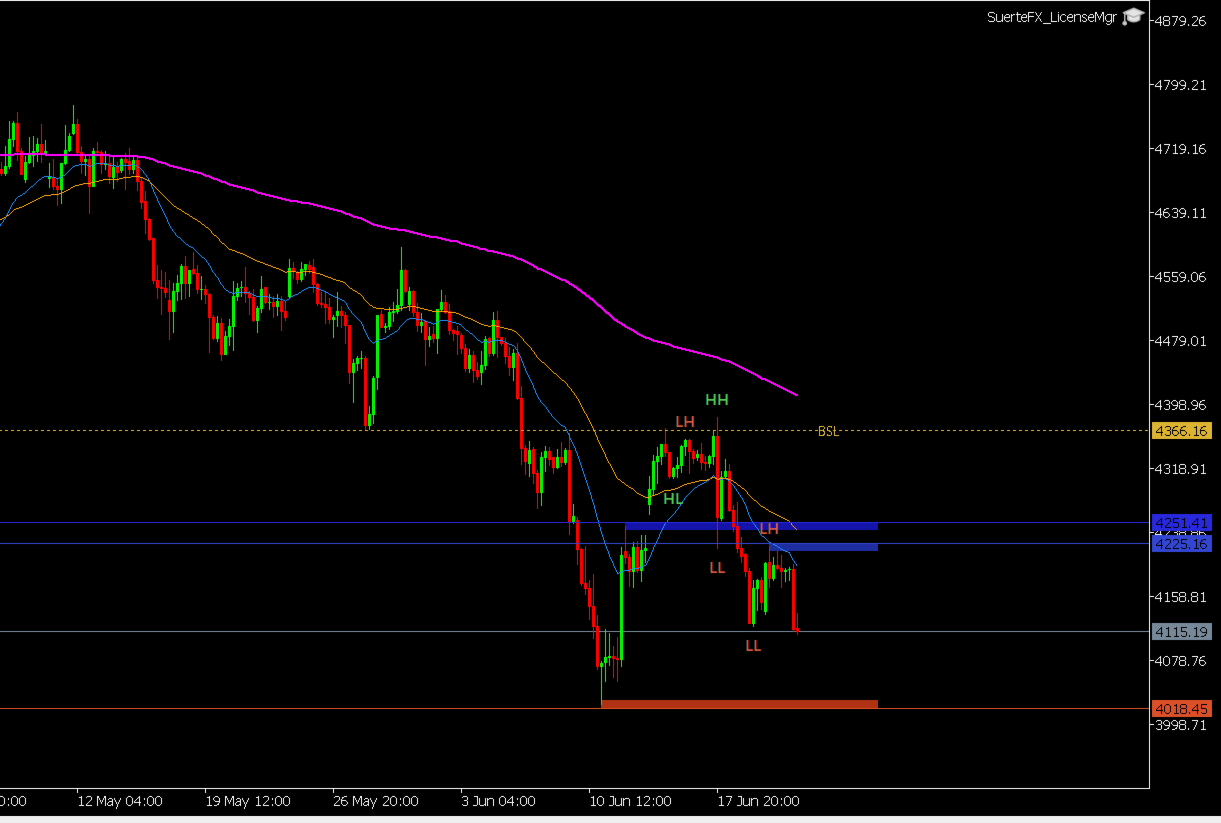
Market Structure
The indicator identifies swing highs and lows and labels them as higher highs, higher lows, lower highs, and lower lows. It detects Break of Structure (a continuation signal) and Change of Character (a potential reversal signal) and labels both directly on the chart.
Support and Resistance Zones
Price levels where multiple swing highs or lows cluster together are drawn as shaded zones. Each zone is classified based on how price has reacted to it:
- Untested — price has not returned to this zone since it formed
- Verified — price returned and held
- Turncoat — price broke through, the zone has switched role
Liquidity Levels
Areas where equal highs or equal lows are visible are marked as liquidity levels. These are drawn as dashed lines and labeled as buy-side liquidity (above price) or sell-side liquidity (below price).
Moving Averages
The 20, 50, and 200-period Exponential Moving Averages are plotted on the chart and used to determine the current trend bias. The bias label in the dashboard updates based on the position of price relative to these averages.
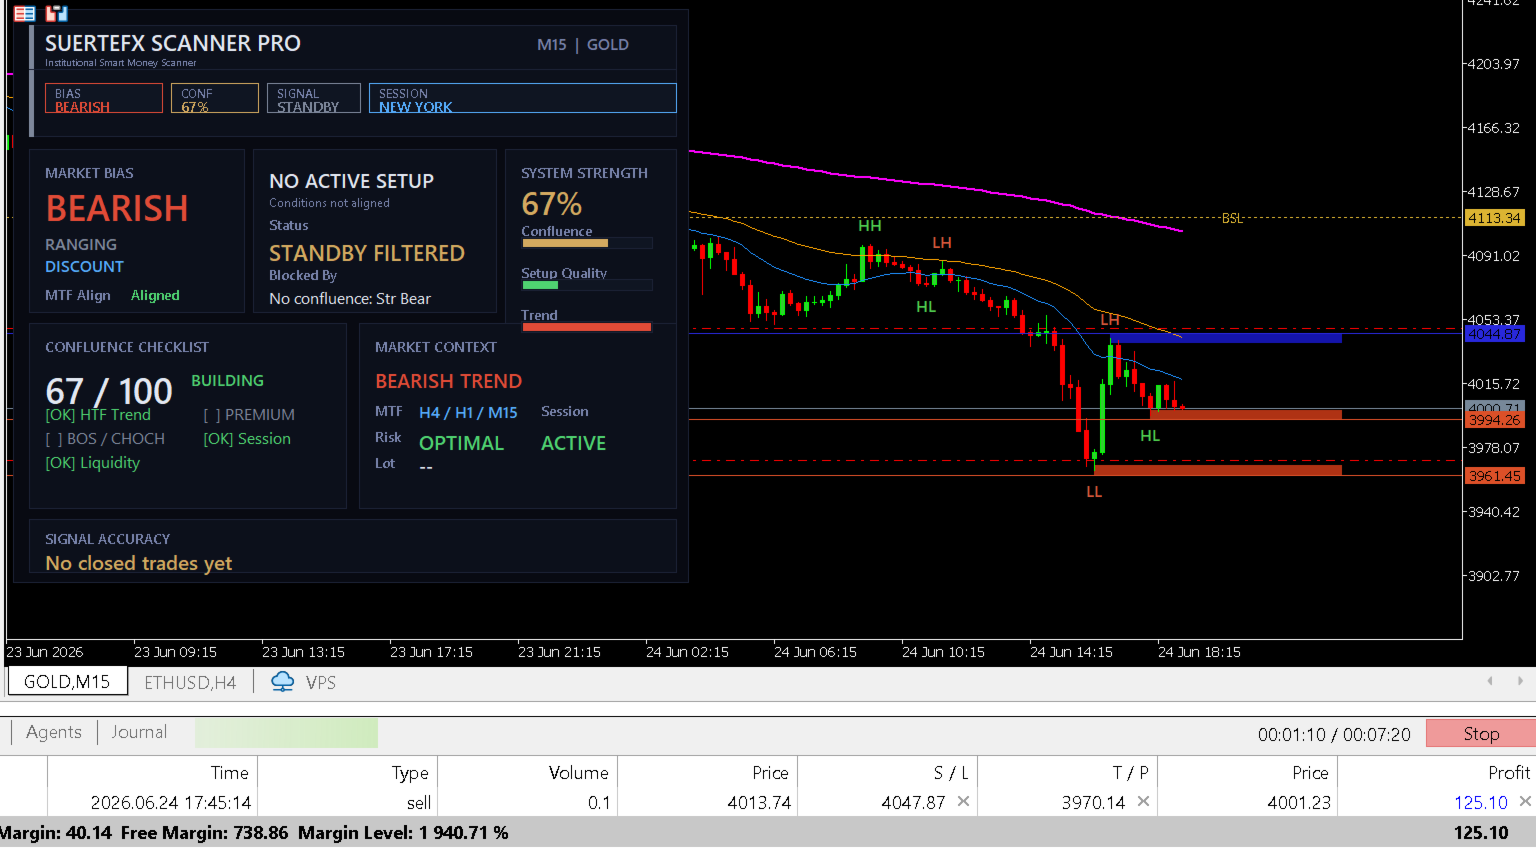
Dashboard Panel
A panel is displayed in a corner of the chart (configurable). It shows:
- Current market bias
- Structure direction on each of the three timeframes
- Status of each of the six confluence conditions
- Current setup status
- Active trading session
- Estimated lot size based on account risk percentage
- Reward-to-risk ratio of the current setup
Alerts
The indicator sends a pop-up alert when a new setup appears. The alert message includes the entry price, stop loss, take profit levels, and the reward-to-risk ratio.
Timeframe Reference
| Chart Period | Higher Timeframe 1 | Higher Timeframe 2 |
|---|---|---|
| 1 Minute | 15 Minutes | 1 Hour |
| 5 Minutes | 1 Hour | 4 Hours |
| 15 Minutes | 1 Hour | 4 Hours |
| 30 Minutes | 4 Hours | Daily |
| 1 Hour | 4 Hours | Daily |
| 4 Hours | Daily | Weekly |
Input Parameters
| Parameter | Default | Description |
|---|---|---|
| Pivot Span | 3 | Number of bars on each side to confirm a swing point |
| Lookback Bars | 120 | Number of bars to scan for structure |
| Max Zone Levels | 4 | Maximum number of zones drawn per side |
| Average True Range Period | 14 | Period used for volatility and zone sizing |
| Minimum Reward-to-Risk | 2.0 | Minimum ratio required to draw a setup |
| Stop Loss Buffer | 1.5 | Stop loss distance beyond the zone in Average True Range units |
| Show Moving Averages | true | Show or hide the three moving average lines |
| Show Zones | true | Show or hide support and resistance zones |
| Show Liquidity Levels | true | Show or hide liquidity level lines |
| Show Structure Labels | true | Show or hide swing point labels |
| Enable Alerts | true | Enable or disable pop-up alerts |
| Account Risk Percent | 1.0 | Used to calculate the estimated lot size in the dashboard |
| Panel Position | Top Left | Corner where the dashboard panel is displayed |
Compatibility
- Platform: MetaTrader 5
- Minimum build: 2755
- Works on all symbols and timeframes
- Tested on Gold (XAUUSD) on the 15-minute and 1-hour charts
Notes
- The indicator does not place trades automatically.
- Past performance shown in screenshots does not guarantee future results.
- Results will vary depending on market conditions, symbol, and timeframe.