Mtf Rsi Fusion Basic
- Indicatori
-
Hadi Pourkerman
 Market Atlas Labs
@MarketAtlasLabs
Welcome to Market Atlas Labs. We develop High-performance MT5 tools for Gold & All Indices.
High-performance MT5 Trading Frameworks. Specializing in Multi-Timeframe (MTF) Context & Adaptive Momentum for Gold (XAUUSD) and US100. 🏛️ - Versione: 1.0
MTF RSI Fusion Basic
MTF RSI Fusion è un oscillatore RSI multi-timeframe progettato per combinare informazioni di momentum provenienti da più calcoli RSI all’interno di un unico indicatore strutturato.
Invece di affidarsi a una sola sorgente RSI, l’indicatore fonde fino a tre flussi RSI provenienti da timeframe differenti in un’unica linea “Fusion RSI”. Strumenti aggiuntivi come zone adattive di ipercomprato/ipervenduto, visualizzazione del bias di trend, rilevamento delle divergenze, generazione di segnali e filtro VWAP opzionale possono essere attivati all’interno dello stesso framework.
L’indicatore è progettato per organizzare strumenti di momentum, trend e conferma in un unico workflow mantenendo una struttura del grafico pulita.
Main Features
- Motore RSI Fusion multi-timeframe
- Fino a tre sorgenti RSI indipendenti
- Configurazione individuale di timeframe, periodo e peso per ogni RSI
- Multipli modi Fusion e Combine
- Zone adattive di ipercomprato e ipervenduto
- Adattamento dinamico della volatilità basato su ATR
- Colorazione del bias di trend
- Analisi delle candele di timeframe superiore
- Analisi dell’inclinazione delle medie mobili
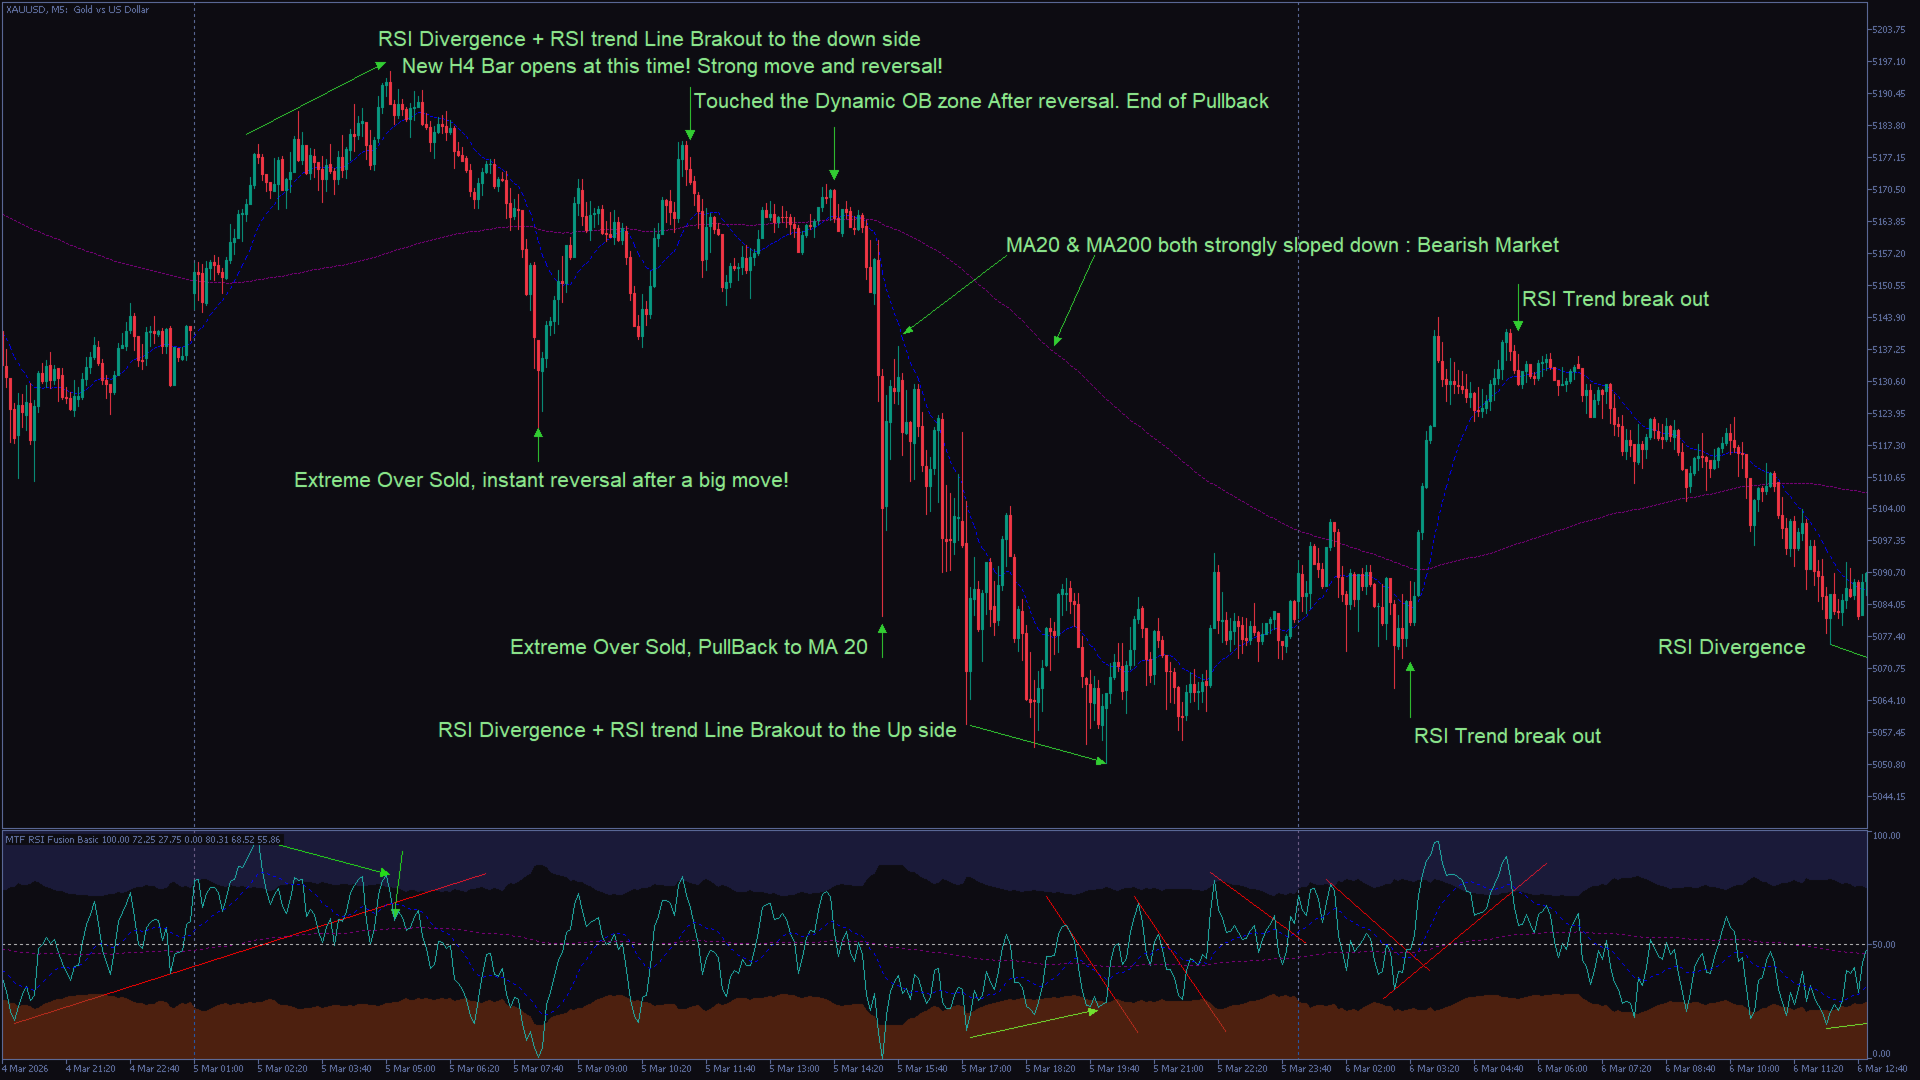
- Rilevamento di divergenze bullish e bearish
- Motore di segnali Buy/Sell
- Oscillatore VWAP opzionale
- Filtro segnali VWAP opzionale
- Visualizzazione delle divergenze sul grafico principale
- Visualizzazione dei segnali sul grafico principale
- Funzioni di gestione prestazioni e oggetti
Multi-Timeframe RSI Fusion Engine
L’indicatore combina fino a tre calcoli RSI in un’unica struttura di momentum.
Ogni sorgente RSI può utilizzare:
- un timeframe indipendente,
- un periodo RSI indipendente,
- e una sorgente prezzo indipendente.
Questo consente di combinare momentum di breve termine, struttura di mercato intermedia e direzione del timeframe superiore all’interno di un unico oscillatore.
Il sistema di weighting consente a ogni sorgente RSI di avere maggiore o minore influenza sul calcolo finale del Fusion RSI.
Fusion and Combine Modes
MTF RSI Fusion include diversi modi Combine per modificare il comportamento finale dell’oscillatore.
I modi disponibili includono:
- AVG
- ADDSUB
- SUBADD
La modalità AVG crea una struttura più fluida.
Le modalità ADDSUB e SUBADD forniscono comportamenti alternativi intorno alla regione centrale e possono produrre transizioni di momentum più aggressive o invertite a seconda della configurazione.
Il clamping opzionale permette di mantenere il risultato finale all’interno del range RSI 0–100.
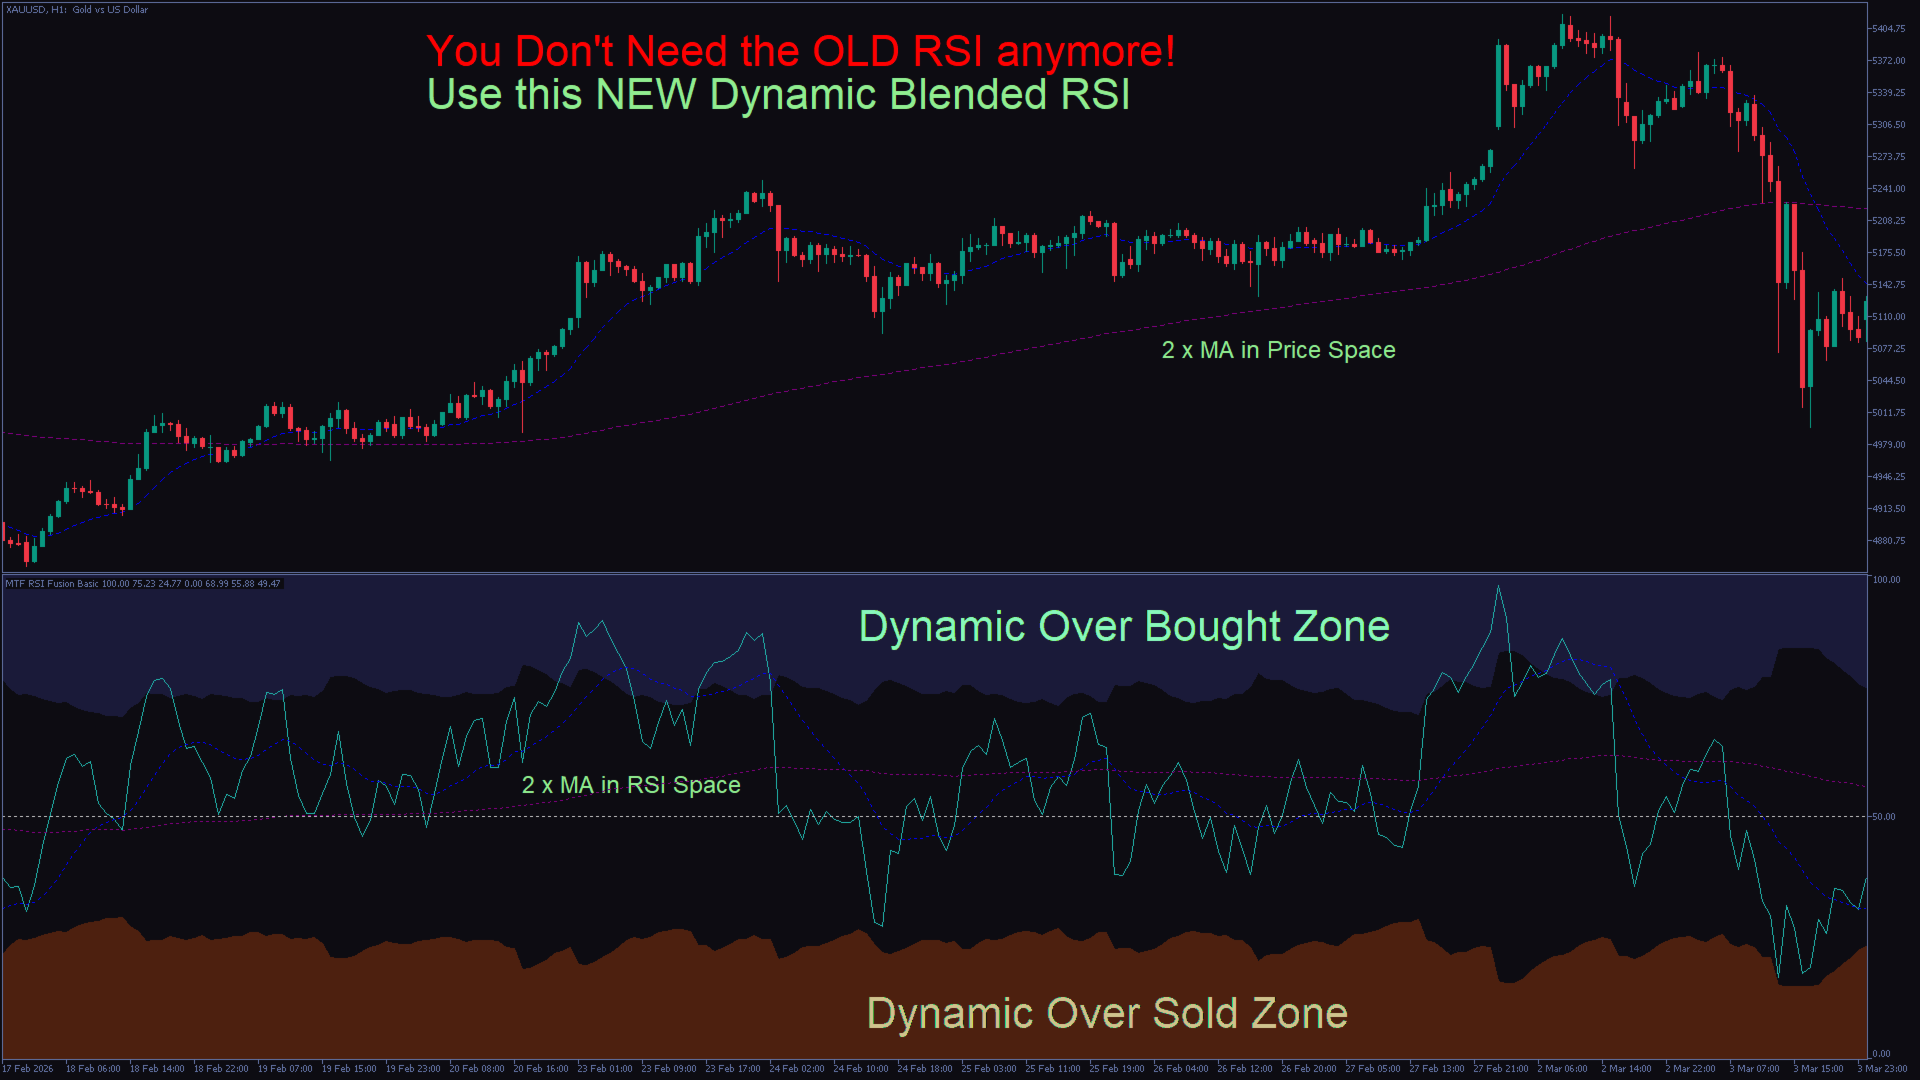
Adaptive Overbought and Oversold Zones
L’indicatore utilizza zone adattive di ipercomprato e ipervenduto invece di affidarsi esclusivamente ai livelli fissi 70/30.
L’ampiezza delle zone viene regolata automaticamente utilizzando calcoli di volatilità basati su ATR.
Durante condizioni di alta volatilità, le zone possono ampliarsi per ridurre segnali eccessivi.
Durante condizioni di bassa volatilità, le zone possono restringersi per aumentare la reattività.
Queste zone dinamiche possono essere utilizzate per analisi di pullback, osservazione dell’esaurimento del momentum, monitoraggio di inversioni e studi di mean reversion.
Le larghezze minima e massima delle zone possono essere configurate manualmente.
Trend Bias and Coloring
MTF RSI Fusion può applicare una colorazione basata sul trend alla linea Fusion RSI.
La direzione del trend può essere derivata tramite:
- analisi delle candele di timeframe superiore,
- analisi dell’inclinazione delle medie mobili,
- oppure una combinazione di entrambi i metodi.
Stati disponibili:
- Bullish
- Bearish
- Neutral
Il framework di trend può essere utilizzato per identificare condizioni di continuazione del trend, filtrare setup contro trend e individuare pullback all’interno di movimenti direzionali.
Le soglie della slope analysis sono configurabili.