KT Fair Value Gap MT5

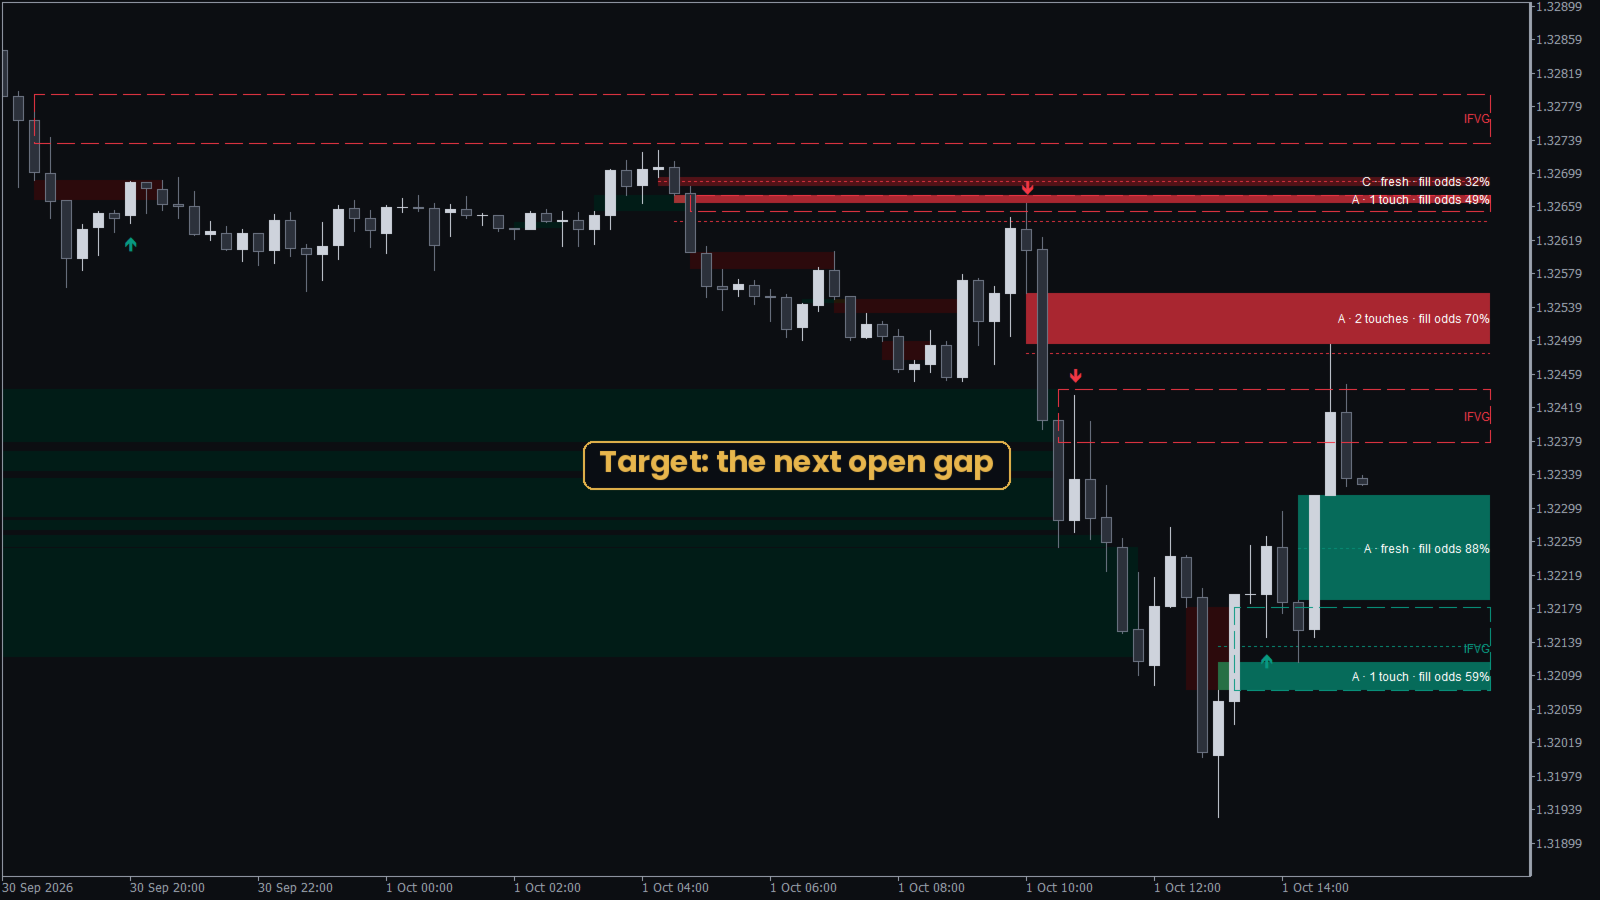
Fair value gap (FVG / ICT) indicator that grades every gap and shows how likely price is to fill it, counted on the symbol and timeframe you trade.

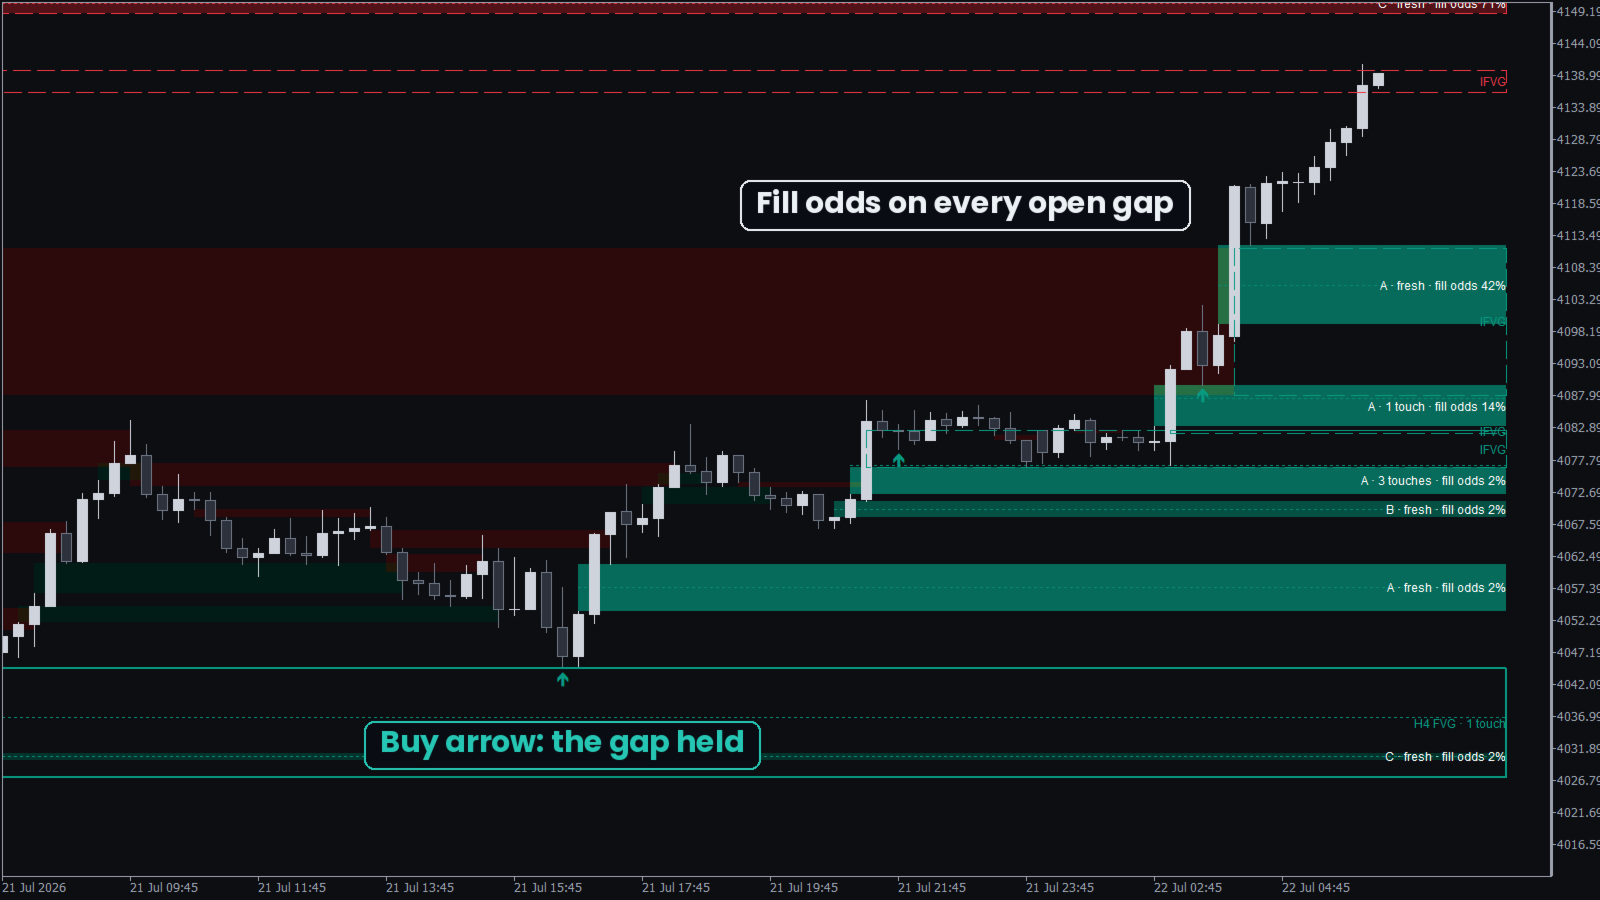
Most FVG indicators fill the chart with boxes and leave you guessing which one matters. Here each open gap carries its grade and its fill odds, and a panel records how often each grade of gap held on your own chart.

Key features

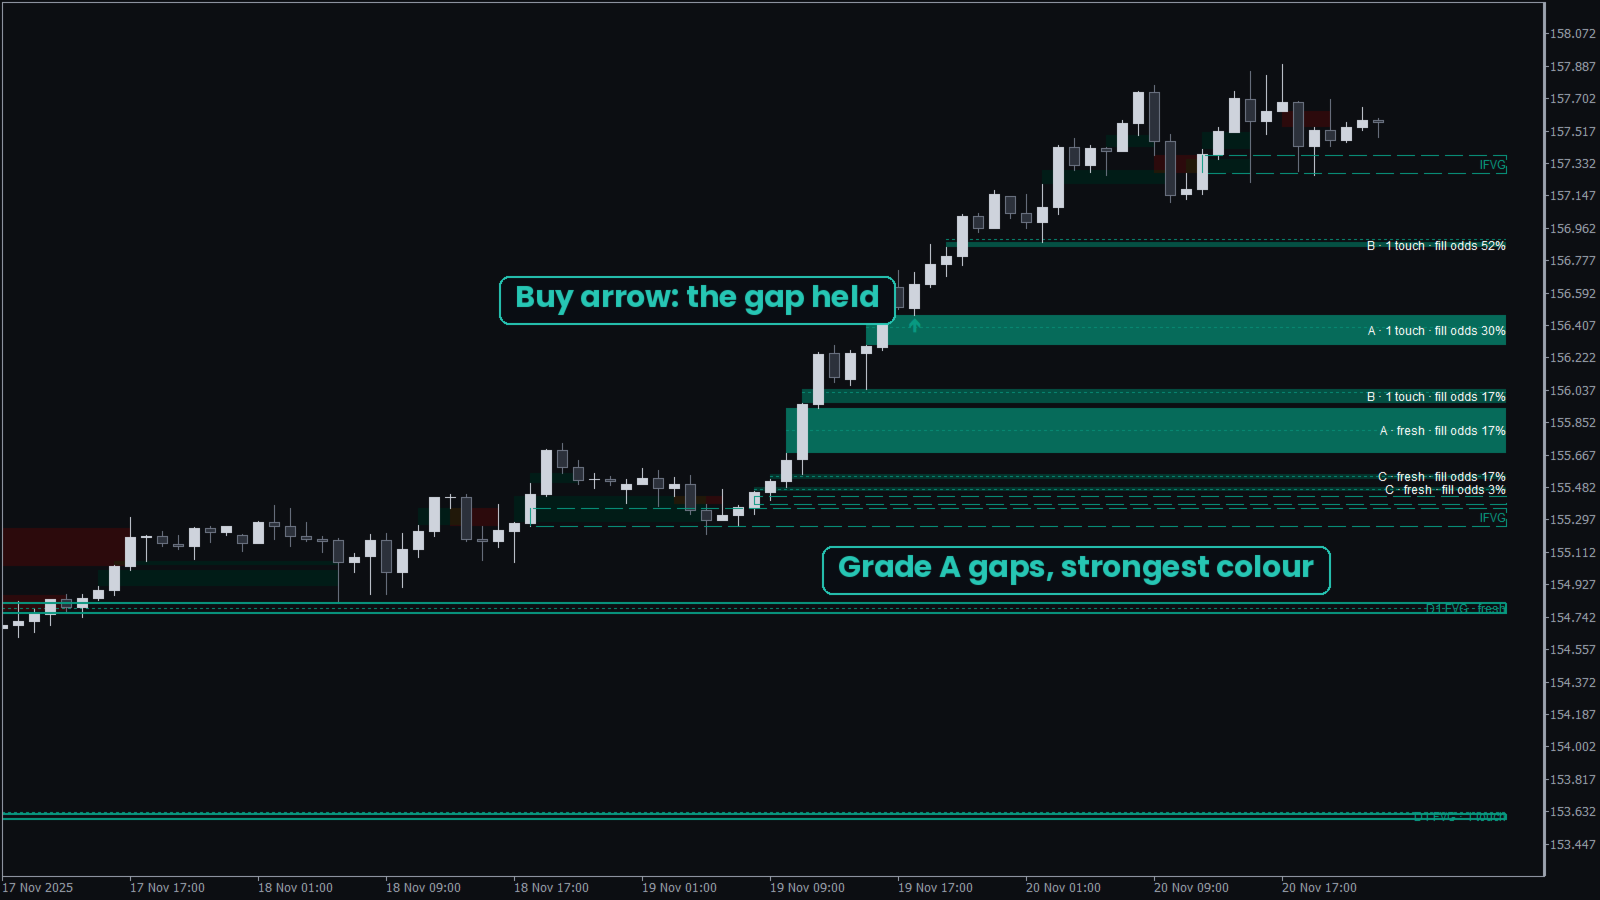
  • Grades A, B and C: each fair value gap is graded by its size against the average candle range, with grade A drawn in the boldest shade.
  • Fill odds on each open gap: how often a gap at that distance from price was filled within the next 50 candles on your symbol.
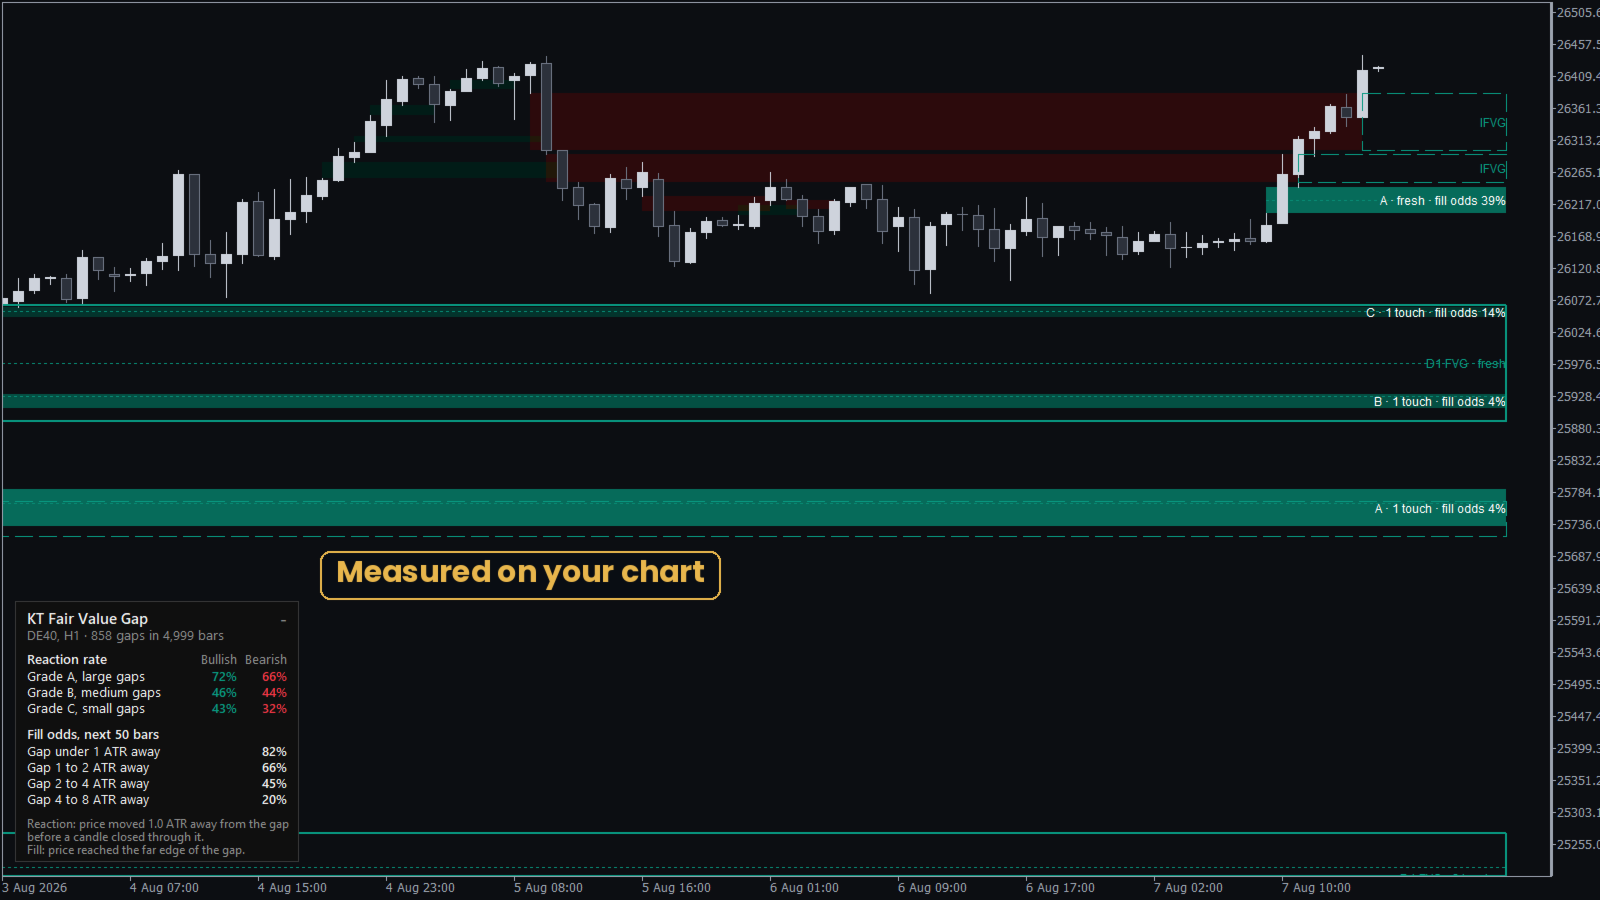
  • FVG statistics panel: reaction rate for bullish and bearish gaps of each grade, and fill odds by distance, measured on the bars you analyse.
  • Mitigation you can see: an open zone gets smaller while price trades into it; once filled, it fades to the background.
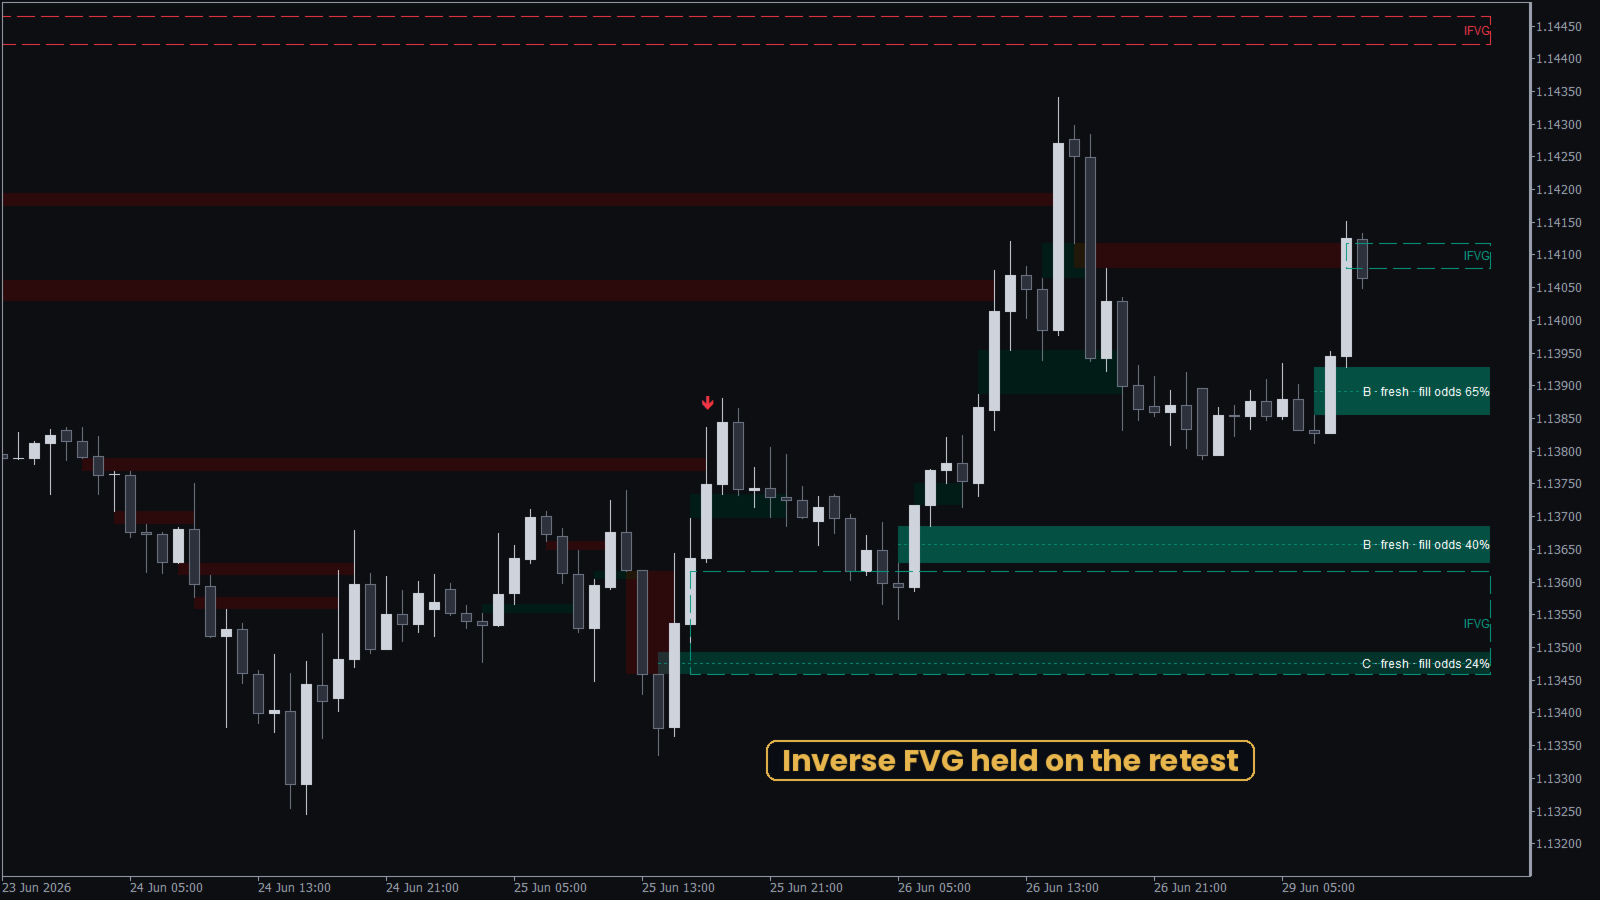
  • Inverse FVG (IFVG): a gap broken by a candle close flips into a dashed zone of the other colour, so you can trade the retest.
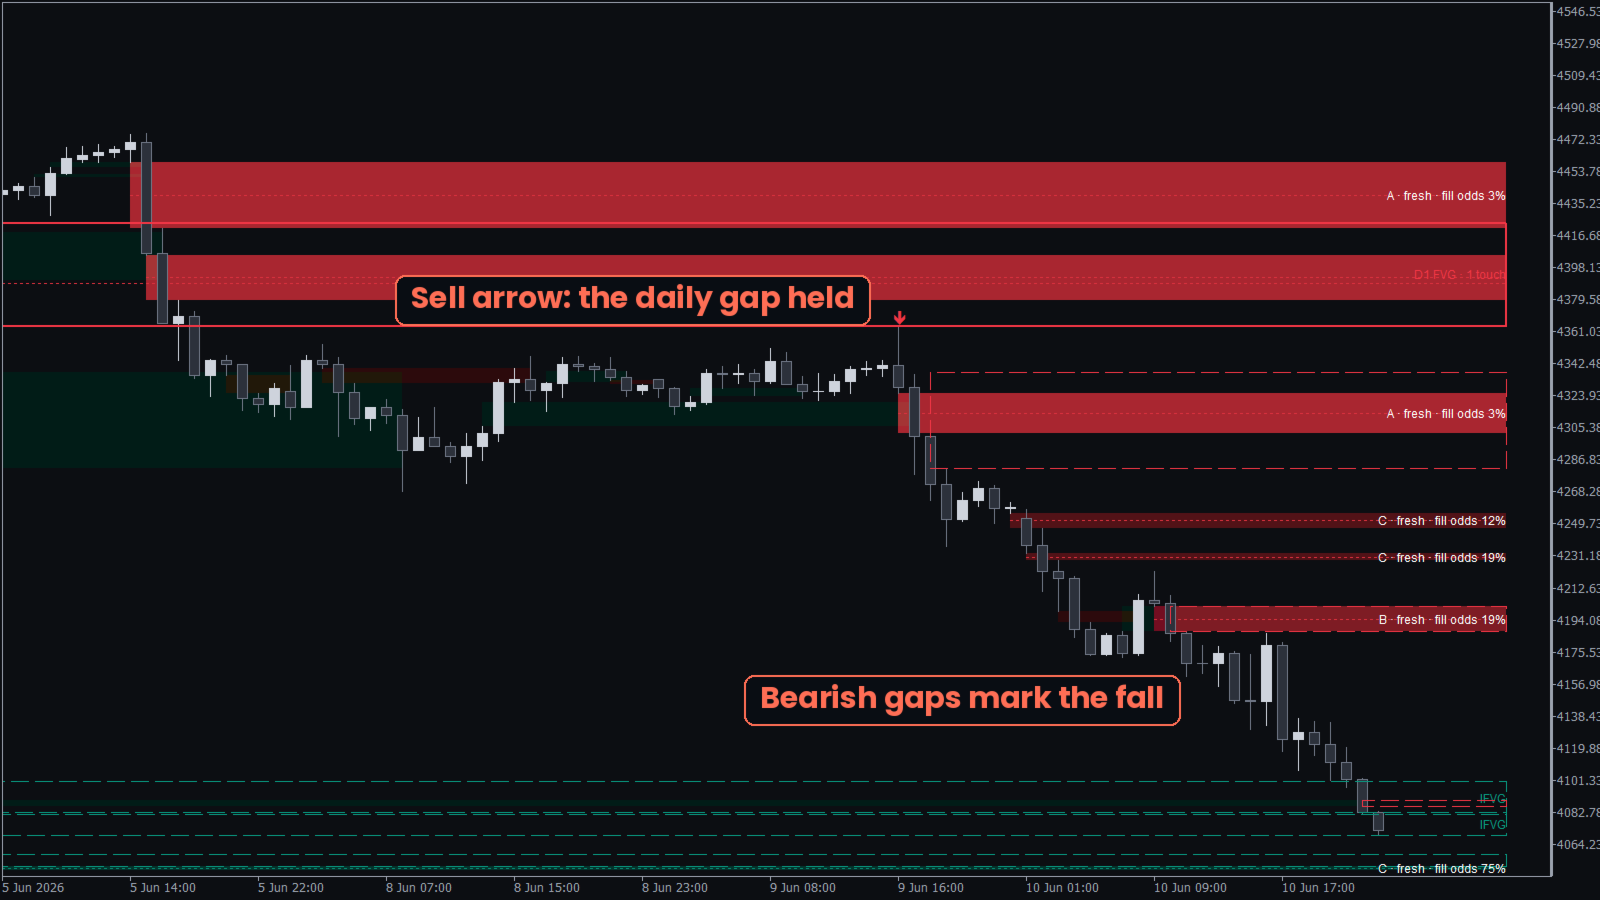
  • Higher timeframe gaps: the next timeframe up is picked for you, and its gaps count as broken only when that bigger candle closes.
  • Rejection arrows: on the first touch of a grade A or higher timeframe gap, when the candle closes back out of it. Gaps, grades and arrows are set on closed candles and do not repaint.
  • Alerts: popup, sound, push or email when a new gap forms, when price first reaches a gap, on a rejection arrow, or when a gap is broken.


How to use it

Start with the panel. It shows which grades react most on your symbol, so you can set the indicator to draw only those. Then wait for price to come back to a fresh gap of a strong grade; the arrow marks the candle that closed back out of it.

For the take profit, check the gaps still open beyond your entry. The higher the fill odds shown on one, the more often price has travelled that far. The 50% line marks the middle of every gap.

Recommendations

Forex pairs, gold, indices and crypto, on any timeframe from M1 to D1. On M15 and M30 the indicator adds H4 gaps; on H1 and H4 it adds daily gaps. Keep enough history on the chart so the panel has results to count.

Input parameters

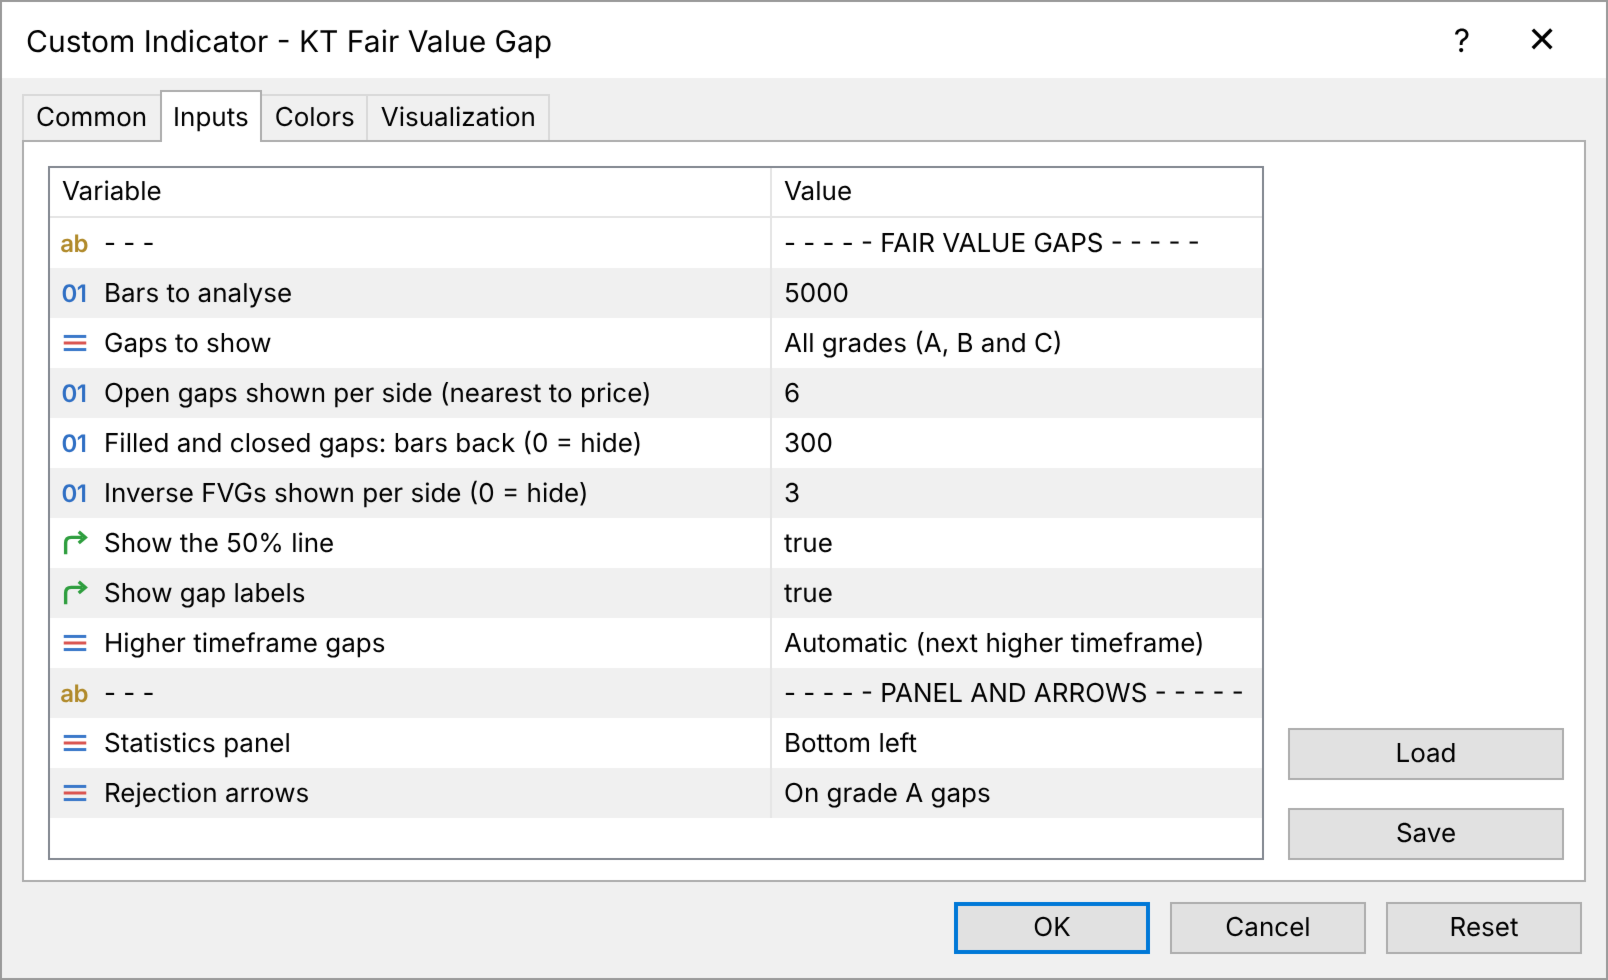
  • Bars to analyse: how many candles the gaps and the panel statistics are counted on.
  • Gaps to show: all grades, grades A and B, or grade A only.
  • Open gaps shown per side: how many open gaps are drawn above and below price, nearest first.
  • Filled and closed gaps bars back: how far back the faded gaps stay on the chart (0 hides them).
  • Inverse FVGs shown per side: how many inverse FVGs are drawn (0 hides them).
  • Show the 50% line, Show gap labels: the middle line and the label with grade, touches and fill odds.
  • Higher timeframe gaps: automatic, a timeframe you choose, or off.
  • Statistics panel: any corner of the chart, or hidden. Click its title to fold it.
  • Rejection arrows: off, on grade A gaps, on grade A and B gaps, or on all gaps.
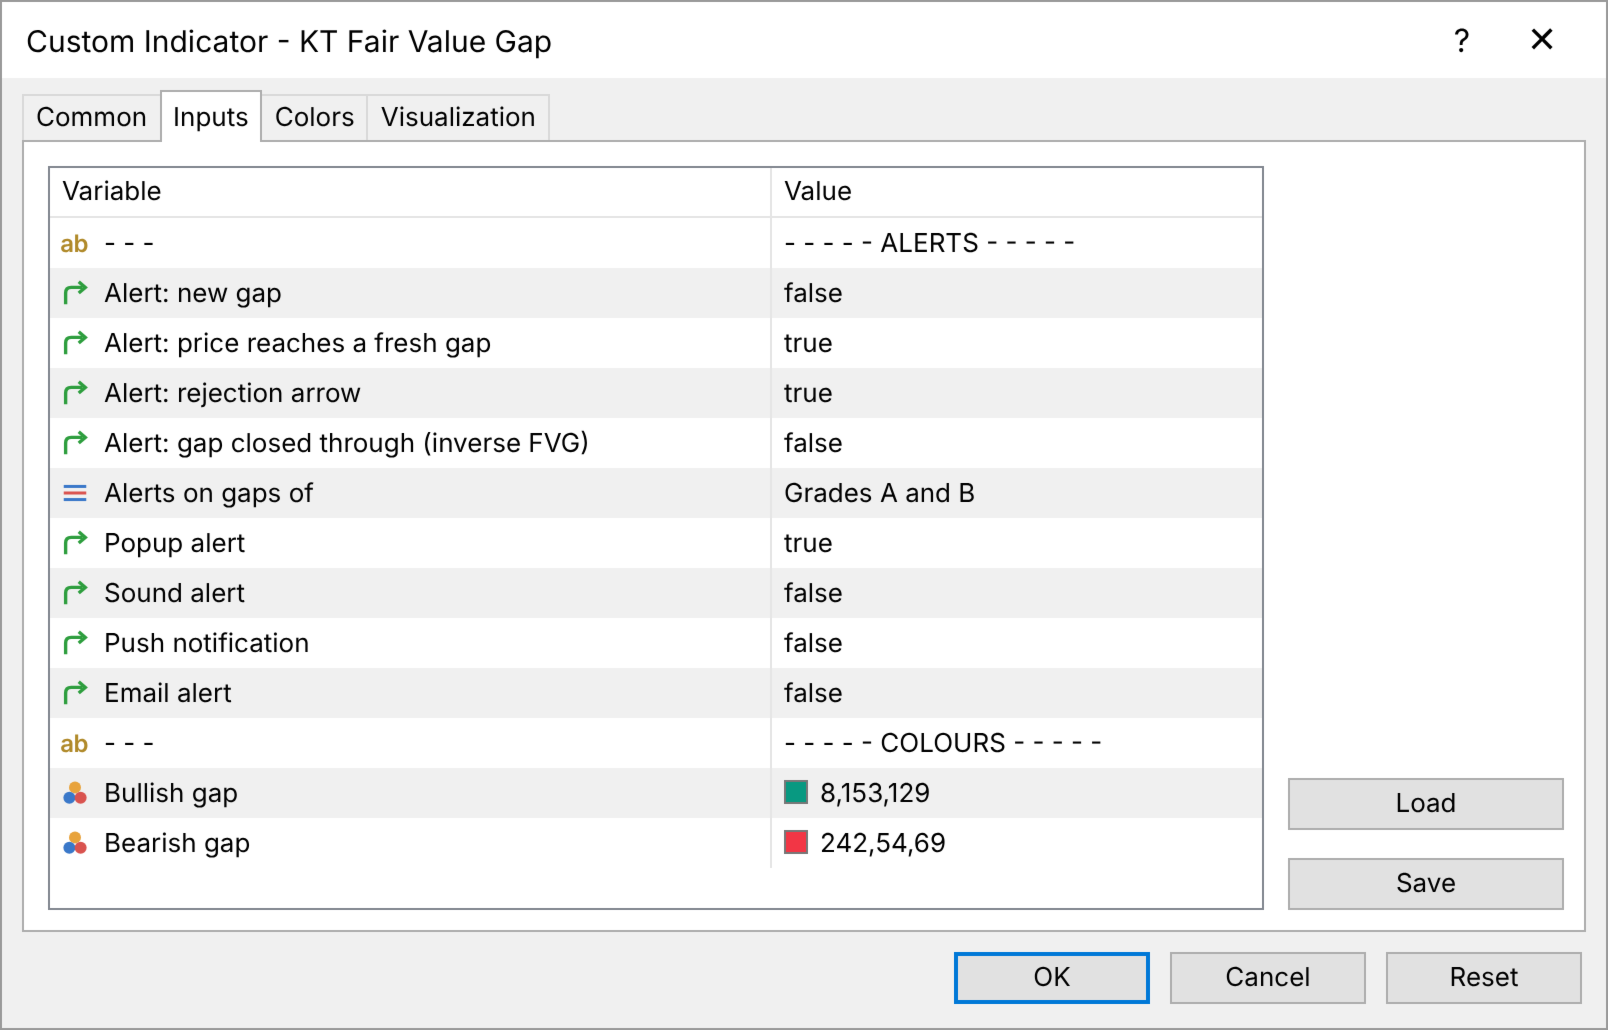
  • Alerts: new gap, fresh gap reached, rejection arrow and gap closed through, for the grades you choose, by popup, sound, push or email.
  • Colours: bullish and bearish gap colours.


Trade the gaps that matter

Grades, fill odds and a record measured on your own market tell you which fair value gaps deserve your attention. Available for MetaTrader 4 and MetaTrader 5.
Önerilen ürünler
LT Support Resistance - Destek ve Direnç Seviyelerini %100 Otomatik Olarak Belirleyin Destek ve direnç çizgilerini manuel olarak çizerek zaman kaybetmekten bıktınız mı? Ya da o önemli seviyeyi her seferinde gözden kaçırdığınız için hayal kırıklığı mı yaşıyorsunuz? LT Support Resistance, bu zahmetli işi ortadan kaldırmak için geliştirilmiştir; birden fazla zaman diliminde (timeframe) eş zamanlı olarak varlığınızın en ilgili bölgelerini otomatik olarak tanımlar ve işaretler. == KRİTİK SEVİYELERİN
Caicai L&S Yield Histogram Important Notice: This indicator is an integral tool of the automated EA Caicai Long and Short Pair Trading . This indicator visually displays the percentage deviation (Yield %) of a pair's current spread relative to its own historical mean. It is an excellent tool for quickly visualizing the gross financial potential of a market distortion in Long & Short operations. Main Features: Percentage Visualization: Understand the size of the distortion in palpable percentage
ZigZag++ is a MetaTrader 5 indicator for market structure analysis using ZigZag logic with pivot detection and swing labeling. The indicator identifies swing highs and lows and marks basic market structure on the chart. FEATURES ZigZag calculation with adjustable parameters (Depth, Deviation, Backstep) Pivot detection for swing highs and lows Market structure labels: HH (Higher High) HL (Higher Low) LH (Lower High) LL (Lower Low) Optional current candle pivot detection Configurable displa
An all‑in‑one trading assistant that blends AI candle synthesis with a 15‑pattern Heat Map, ATR‑scaled S/R & pivots, and a Vigilant risk monitor (LOC/TF/SR/PAT gates, Ready%, EM points, SR‑distance bar). The Opportunity Advisor adds ETAs, checklists and gate status; Multi‑TF Confluence confirms alignment from M1–D1. The Professional Trade Suggestion panel shows regime, session filter, R:R presets, Partials and Quality Pause. Clean, readable UI with one‑click S/R toggles, scanners and a built‑in,
JSL Orderflow Footprint turns every candle into a price ladder that shows how much volume traded on the bid and on the ask at each price level. It highlights diagonal imbalances, stacked imbalance zones, absorption at candle extremes, cumulative delta (CVD), delta divergence and the daily session volume profile, then combines five of these order-flow conditions into a 0–100 confluence score. A signal is only issued on bar close when the score is high, clearly one-sided and confirmed by the candl
Seasonal Pattern Trader
Dominik Patrick Doser
Disclaimer : Keep in mind that seasonal patterns are not always reliable. Therefore, thoughtful risk management is crucial to minimize losses.  Seasonal patterns in the financial world are like a well-guarded secret that successful investors use to their advantage. These patterns are recurring price movements that occur during specific periods or around special events. Additionally, there are also intraday patterns that repeat. For example, Uncle Ted from Forex Family suggests examining previou
Supertrend Volume Confirm
Isaac Alexander Pinero Garcias
DESCRIPTION Supertrend Volume Confirm — Trend Signals Confirmed by Volume and RSI Supertrend Volume Confirm is a buy/sell signal indicator based on the classic Supertrend, with two additional confirmation filters: volume and RSI. Unlike more complex multi-timeframe systems, this indicator works on a single timeframe, designed for traders who want something direct and easy to read. It works on any market symbol (forex, gold, indices, stocks, crypto) thanks to its default use of tick volume, unive
RastroBot usa o indicador Donchian Channel para identificar sinais de entrada, inspirados nas famosas estratégias Turtle. Simples e eficaz, é amplamente utilizado por traders profissionais e está integrado ao MT5. Ideal para quem quer usar esses sinais em operações de scalping. Não usa IA, Martingale ou Grid. Não é um "santo graal" do trading, mas uma estratégia honesta para lucrar com rápidas acelerações de tendência. O EA pode ser usado além do scalping, ajustando ou desativando o trailing
This indicator automatically detects harmonic price patterns on your chart, both bullish and bearish, and shows them as soon as they form, including potential patterns that are still developing. For every pattern it draws the Potential Reversal Zone (PRZ), and for completed patterns it also draws two take-profit and two stop-loss levels. Supported Patterns: Gartley, Bat, Butterfly, Crab, Deep Crab, Shark and Cypher. Each pattern can be switched on or off individually. Key Features: Completed
FREE
SPECIAL LAUNCH OFFER: $30 (1-Month Rent) Limited time offer to build our community and gather feedback! AmbM GOLD Institutional Scalper A high-precision M5 algorithm for XAUUSD (Gold) , engineered to trade exclusively at Institutional Liquidity Levels ($5/$10 psychological marks). PERFORMANCE DATA (BUY ONLY) • Win Rate: 87.09%. • Safe Growth: +$4,113 profit on $10k (13.75% Max Drawdown). • Extreme Stress Test: Successfully generated +$22,997 in a 5-year stress test (2020-2026), proving
Info:   marcobarbosabots Pivot lines are an easy way to see market trend. The indicator provides the pivot line and three first support and Resistance lines. Calculations used was: Resistance 3 = High + 2*(Pivot - Low) Resistance 2 = Pivot + (R1 - S1) Resistance 1 = 2 * Pivot - Low Pivot point = ( High + Close + Low )/3 Suport 1 = 2 * Pivot - High Suport 2 = Pivot - (R1 - S1) Suport 3 = Low - 2*(High - Pivot) You can use the calculated values ​​on an EA too, just make sure the indicator is a
Cybertrade Keltner Channels - MT5 Created by Chester Keltner, this is a volatility indicator used by technical analysis. It is possible to follow the trend of financial asset prices and generate support and resistance patterns. In addition, envelopes are a way of tracking volatility in order to identify opportunities to buy and sell these assets. It works on periods longer than the period visible on the chart. All values ​​are available in the form of buffers to simplify possible automations.
FREE
Automatic Support & Resistance zones for MetaTrader 5 — confirmed by real price action, not just the nearest line. Tenet Support & Resistance Pro scans D1, H4, H1, M15, M5 and M1 price history and plots the key support and resistance levels for you. Instead of simply highlighting whichever line sits closest to price, it checks how many times price has actually tested a level in recent candles before confirming it as the current trading zone — so you're not reacting to a level the market never re
CandlePro X
Murtadha Majid Jeyad Al-Khuzaie
CandlePro X — Free Professional Candle Visualizer for MetaTrader 5 CandlePro X is a free chart visualization indicator for MetaTrader 5, designed to make candlestick charts cleaner, sharper, and easier to read. If you find it difficult to quickly distinguish bullish and bearish candles, especially on busy charts, CandlePro X helps solve this problem by giving your candles stronger colors, clearer contrast, and a more professional appearance. CandlePro X does not generate trading signals, pred
FREE
AlgoChamp v3 PLUS AlgoChamp v3 PLUS is an simple indicator designed to provide traders with clear market view at a very low cost . More AlgoChamp products and updates are currently in development. An automated trading solution is also planned for a future release. Features trend clouds Candle coloring EMA 21, 50, 100 and 200 overlays Take Profit markers max momentum tracking Customizable chart components Compatible with all supported trading instruments and timeframes How to Use Attach AlgoChamp
CandleBot
Mithlesh Kumar Mandal
Introducing CandleBot - Candlestick Formasyonlarını Tanımlama ve İşlem Yapma İçin Mükemmel ve Ücretsiz Aracınız! CandleBot ile piyasalarda avantajı ele geçirin; boğa ve ayı tüneli, sabah ve akşam yıldızı, çekiç gibi formasyonları kolayca tanıyarak işlem yapın. Belirli bir süre içinde açılış, yüksek, düşük ve kapanış fiyatlarından türetilen mum formasyonları, fiyat hareketlerinin görsel temsilcileri olarak işlev görür ve traderlara piyasa duyarlılığını analiz etme ve potansiyel tersine dönüşleri
KT MSnR Indicator MT5
KEENBASE SOFTWARE SOLUTIONS
A Malaysian SnR (MSNR) indicator that draws A, V, gap and OCL levels from three timeframes, keeps track of which levels are still fresh, and reads the MSNR storyline for you. The MSNR radar watches your Market Watch and shows which symbol sits at a fresh D1 or H4 level right now. Every level and every storyline turn is confirmed on a closed candle, so the levels you see on past candles are the same levels the chart showed live. What you get All MSNR level types: A levels (resistance), V levels (
Apex Point
Marco Engstermann
Apex Point is a trend-following indicator for MetaTrader 5, transforming complex market data into signals for traders. It displays blue dots for uptrends, red dots for downtrends, and yellow crosses at potential reversals, helping users identify momentum shifts quickly. Key features include a confirmation system requiring multiple bars (default: 3) to validate changes, reducing false signals; dynamic ATR-based offsets for adaptive trailing, with instant ratcheting in the trend direction and smo
FREE
Pivotrons B3 Trader é o robô de negociação automatizada a bolsa iBovespa B3 (miniindice WIN e minidólar WDO) que usa os cálculos de Pivot Points de acordo com o horário estabelecido, bem como analisando minutos anteriores para determinação do pivô, dos suportes e das resistências, adicionando as ordens de acordo com tais configurações. Pode ser configurado um filtro de duas médias móveis, que levam em conta a inclinação das mesmas no momento da emissão de ordens. Atenção: Alterar o parâmetro BR1
" Blow It Up!" - The Trading Indicator That Questions Your Life Choices Tired of boring indicators? Meet your new market companion that delivers: "YOLO BUY!" arrows when you should probably panic Explosive rectangle confetti (because why not?) 200+ soul-crushing quotes like "Your stop loss is imaginary" and "This is n't trading, it's donating to whales" Random alerts that roast your strategy This Indicator is lik e Therapy - Because daytrading shouldn't fe el like watching paint dry! Highlights
Auto Fractal Support And Resistance is a powerful multi-timeframe indicator designed for traders who want to trade lower timeframes with higher timeframe accuracy. When your mouse cursor is on a line you can easily see fractal describtion and index of fractal candle  and timeframe of that fractal candle.  This indicator automatically detects H1 and D1 fractal levels and draws clean horizontal support and resistance lines on any lower timeframe chart (M1, M5, M15, M30). Now you can see where the
My Pivot
Ashok Kumar Singha
My Pivot is an Indicator based on Pivot Lines and Support-Resistance zones. This Indicator will Plot 11 SR zones including Pivot Line which will definitely help you to understand the exact SR zones of the Market. Steps to Setup the Indicator: Install the Custom Indicator; Set all the Lines Color, Width and Styles; Set visualization to All Timeframe; and DONE It can be used for: All Pairs: Forex, Cryptocurrencies, Metals, Stocks, Indices.  All Timeframe All Brokers All type of Trading S
Nexum Veritas: market structure, zones, liquidity and a price projection tool on your MT5 chart. Nexum Veritas draws the Smart Money Concepts structure of the market from one consistent pivot chain that never repaints , shows the zones, levels and liquidity that SMC traders read, and lets you sketch the path you expect on the chart. Optionally it marks four classic SMC setups as a learning aid. It is a tool to read the market and plan your own trades, not a signal service. MARKET STRUCTURE Pivot
Harmonic Pattern Hunter
Shingidzano Lesetedi
5 (1)
Harmonic Pattern Hunter Harmonic Pattern Hunter is a technical indicator for MetaTrader 5 that automatically identifies and draws high-probability harmonic patterns directly on the chart. It is designed to assist traders who use harmonic analysis as part of their trading methodology. How It Works The indicator scans historical and live price data for completed XABCD harmonic structures using Fibonacci ratio validation. When a valid pattern is detected, it draws the full pattern geometry, marks t
Bohemia Gold MT5
Vladislav Taska
4.83 (6)
Bohemia Gold MT5 is  Trend & Volatility EA trading system designed specifically for Gold (XAUUSD) . It combines higher-timeframe trend filtering , trend detection , volatility-based SL management , and advanced trade management to adapt market conditions. It uses style logic focused on trend strength, volatility, and capital protection. NOTE:   Based on backtests, I found better trading results with the following setup: D1/H4/H2 (Trend/ADX/ATR & trade). The SET file can be downloaded here … bohe
FREE
Here I present you this awesome indicator I made. This is a nique combination witch puts you in the same level as MM's. So you can surf a lot of waves and identify the rally time, breakouts, and the perfect time to get in the market. ---- The SSL Channel is a great all-rounder based on 2 Simple Moving Averages, one of recent Highs, one of recent Lows. The calculation prints a   channel   on the chart consisting of 2 lines. This strategy gives a Long signal when price closes above the top of thes
TrendDecoder Scanner MT5
Christophe Trouillas
5 (1)
Birden fazla varlık ve birden fazla zaman birimi için TrendDECODER sinyalleri alın | Girmek için en iyi zaman birimini belirleyin | Kârınızı ve kazanan işlemlerinizi en üst düzeye çıkarın Yeniden boyanmayan, gecikmeyen gösterge ve tarayıcı - manuel ve otomatik ticaret için ideal - tüm varlıklar ve tüm zaman birimleri için İlk 50 kopya için 49$   - sonra 99$ Satın aldıktan sonra lütfen yorum yapın veya inceleme bırakın ve size 99$ değerinde EK bir gösterge göndereceğiz。 Bu ne hakkında? Bu tar
This z-score indicator shows the correct z-score of an asset, as it uses the normalized price data for calculation, which is the only correct way. Z-score is only applicable for normal distributed data, therefore not the actual price is considered, but the normalised returns, which were assumed to follow a normal distribution. Returns are mean reverting and assumed to follow a normal distribution, therefore z-score calculation of returns is more reliable than z-score on price, as price is NOT m
Volt Euro Flux
Ionut Voicilas
Volt Euro Flux Volt Euro Flux is an Expert Advisor for MetaTrader 5 developed for automated EURUSD trading. It combines proprietary trade selection with automatic BUY and SELL execution, equity-based position sizing and active position management. The EA monitors the market, executes trades when its conditions are met and manages each position through its exit rules. Volt Euro Flux has six essential inputs. Its exact entry algorithms, filters and decision rules are proprietary and are intentiona
Bu ürünün alıcıları ayrıca şunları da satın alıyor
Trend Sniper X
Sarvarbek Abduvoxobov
4.86 (44)
Trend Sniper X , tüccarların trend yönünü ve olası dönüş noktalarını netlik ve hassasiyetle belirlemelerine yardımcı olan MetaTrader 5 için çoklu zaman dilimli bir trend takip göstergesidir. MT4 için: https://www.mql5.com/en/market/product/193245 Fiyat Bilgisi: Mevcut fiyat tanıtım amaçlıdır ve gelecek güncellemeler ile yeni özellikler yayınlandıkça değişebilir. Bonus Fırsatı: Bu indikatör için ÜCRETSİZ Oto-Trade Assistant EA'yı almak için lütfen satın aldıktan sonra yazara mesaj gönderin. Code
Şehre yeni bir Kral geldi - Gösterge + Emir Yönetimi göstergeleri (TP1 + TP2 + TP3) + Opsiyonel Telegram Sinyal Gönderici DAHİL (ÜCRETSİZ) (TAM TRADING ve SİNYAL SİSTEMİ) Altın için en iyi EA’mız: Gold Slayer Bu gösterge; gelişmiş bir strateji, özelleştirilebilir emir yönetimine sahip bir trading sistemi ve envelope uzantılarını birleştiren bir mean reversion sistemi içerir. Ayrıca RSI gibi birçok akıllı onay filtresiyle desteklenerek yüksek olasılıklı dönüş girişlerini AL ve SAT sinyalleriyle y
Smart Trend Trading System — MetaTrader 5 Satın aldıktan sonra Smart Universal Expert Advisor'ı ÜCRETSİZ edinmek ve beraberinde çevrimiçi kurs, PDF kılavuzu ve özel gruba erişim almak için MQL5 üzerinden bana mesaj gönderin. STTS; trend yönünü, giriş ve çıkış sinyallerini, dönüş bölgelerini ve önemli fiyat seviyelerini doğrudan grafiğinizde bir araya getirir. Sistemi manuel işlemler için kullanabilir veya ayrı bir uyumlu EA’yı bağlayarak seçtiğiniz ayarlarla otomatik işlem gerçekleştirebilirsini
Zoryk Gold
Reda El Koutbane
4.78 (18)
ZORYK — MetaTrader 5 İçin Gelişmiş XAUUSD Sinyal Sistemi Bu hissi biliyorsunuz. Altını analiz etmek için uzun zaman harcarsınız. Doğru giriş noktasını beklersiniz. Sonunda işlemi açarsınız ve fiyat hemen aleyhinize hareket etmeye başlar. İşlemi çok erken kapatırsınız, Stop Loss seviyesini değiştirirsiniz veya birkaç saniye tereddüt edersiniz. Daha sonra piyasa, başlangıçta beklediğiniz hedefe tam olarak ulaşır; ancak siz artık işlemin içinde değilsinizdir. Sorun her zaman yön değildi. Asıl sorun
Entry Points Pro, emri vermeden önce nereden gireceğinizi, stopu nereye koyacağınızı ve hangi lotla işlem yapacağınızı gösterir. FİYAT Şu anda 149 USD ve bu fiyattan satılan son kopya. Sonrasında fiyat 199 USD'ye çıkacak, nihai fiyat ise 349 USD. Paramı piyasalarda işlem yaparak kazanıyorum ve bunu gösteriyorum, bu yüzden bu indikatörü herkese satmak zorunda değilim. Bu, kendi kafasıyla düşünen traderlar için bir araç, sihirli bir düğme değil. Ok mum kapanışında belirir ve repaint olmaz. İki ay
İşlem avantajınızı görüş alanınıza alın! M5 Sniper , MeanFX tarafından geliştirilen yeni bir indikatördür. Hassas işlem sinyallerini adaptif TP/SL seviyeleriyle birleştirir — bunun sonucunda mümkün olan en iyi istatistiksel işlemleri oluşturur! Fiyat her 5 satın alımda bir artar, bir sonraki fiyat 69$ olacaktır. Satın aldıktan sonra ipuçları/rehber ve bonus EA almak için bana mesaj gönderin. Onu öne çıkaran nedir? Kanıtlanmış istatistiksel performans Gold XAUUSD üzerinde ( neredeyse her varlıkta
Ultra Indicator
Ihor Otkydach
5 (1)
ULTRA, “hepsi bir arada” prensibiyle çalışan bir teknik göstergedir; piyasayı bağımsız olarak analiz eder, işlem sinyalleri üretir, stop-loss emirlerinin verileceği seviyeleri gösterir ve kârı garantilemek ya da zararı en aza indirmek için işlemlerin ne zaman kapatılması gerektiğini önerir. Başka bir deyişle, piyasayı nasıl analiz edeceğinizi bilmeseniz, seviyeleri (stop-loss'unuzu nereye koyacağınızı) belirleyemeseniz ya da para yönetimi konusunda zorluk yaşasanız da fark etmez. ULTRA tüm bunla
SuperScalp Pro
Van Minh Nguyen
4.54 (37)
SuperScalp Pro - Professional Multi-Layer Confluence Scalping System SuperScalp Pro, klasik Supertrend sistemini birden fazla akıllı doğrulama filtresiyle geliştiren ileri düzey bir scalping göstergesidir. Yanlış sinyalleri önemli ölçüde azaltırken başarı olasılığı daha yüksek Buy/Sell işlem fırsatlarını belirlemenize yardımcı olur. Buy ve Sell okları doğrudan grafik üzerinde net bir şekilde görüntülenir. ATR tabanlı Stop Loss ve Take Profit seviyeleri de gerçek zamanlı olarak otomatik hesaplanı
Gold Trend Coach MT5
Cristhian Alexander Gaibor Cuasquer
4.27 (11)
Gold Trend Coach, MetaTrader 5 için altın (XAUUSD) trend göstergesidir: mum kapanışında onaylanan (repaint yok) alış ve satış sinyalleri, stop loss ve üç take profit, sizi girişten TP3'e kadar yönlendiren bir koç, çoklu zaman dilimi paneli ve telefonunuza ve Telegram'a uyarılar. Londra ve New York seanslarında M1 ve M5 scalping ve M15 gün içi işlem için yapıldı. BONUS: Gold Trend Coach için ÜCRETSİZ otomatik işlem EA. Satın aldıktan sonra bana yazın, göstergenin sinyallerini kendisi işleyen EA'y
Gann Made Easy , bay teorisini kullanarak ticaretin en iyi ilkelerine dayanan, profesyonel ve kullanımı kolay bir Forex ticaret sistemidir. WD Gann. Gösterge, Zararı Durdur ve Kâr Al Seviyeleri dahil olmak üzere doğru SATIN AL ve SAT sinyalleri sağlar. PUSH bildirimlerini kullanarak hareket halindeyken bile işlem yapabilirsiniz. Satın alma işleminden sonra, alım satım talimatlarını ve harika ek göstergeleri ücretsiz olarak almak için lütfen benimle iletişime geçin! Muhtemelen Gann ticaret yöntem
GoldenX Entry MT5
VividMind Digital Solutions
5 (17)
GoldenX Entry, adaptif Smart Entry Trend algoritmasına, sinyal skorlaması sistemine, piyasa rejimi algılayıcısına ve volatilite filtresine sahip bir MT5 indikatörüdür. Her sinyal; hesaplanmış bir giriş seviyesi, üç adet Take-Profit seviyesi (TP1, TP2, TP3) ve bir Stop-Loss seviyesi içerir. Farklı piyasa koşullarına uyum sağlamak için tasarlanmış çok katmanlı analitik yapı üzerine kuruludur ve yerleşik optimizasyon aracı ile istatistik takip sistemini birleştirir. Risk-ödül (RR) metrikleri ve geç
SMC Intraday Formula
VividMind Digital Solutions
5 (26)
Önce dürüst olalım. Hiçbir gösterge tek başına sizi kârlı yapmaz. Eğer biri size aksini söylüyorsa, size bir hayal satıyordur. Mükemmel al/sat okları gösteren her gösterge, kusursuzmuş gibi görünecek şekilde yapılabilir — sadece geçmişin doğru bir bölümünü yakınlaştırıp kazanan işlemleri ekran görüntüsü almanız yeterlidir. Biz bunu yapmıyoruz.  SMC Intraday Formula bir araçtır. Piyasa yapısını sizin için okur, en yüksek olasılıklı fiyat bölgelerini belirler ve şu anda akıllı paranın izinin nası
Boba Analysis Suite
Trade Ready Solutions LLC
5 (2)
Boba Analysis Suite Boba Analysis Suite, MetaTrader 5 için geliştirilmiş bir analiz göstergesidir. Piyasa yapısını, önemli fiyat bölgelerini ve genel piyasa bağlamını tek bir grafik görünümünde bir araya getirir. Trader ve trading eğitmeni olarak edinilen uygulamalı deneyimden yola çıkarak geliştirilmiştir. Piyasanın yönünü değerlendirme, önemli seviyeleri belirleme ve birden fazla zaman dilimini birlikte inceleme gibi adımlardan oluşan sistematik bir analiz sürecini destekler. Piyasa Bağlamını
FiboSniper Pro
Van Minh Nguyen
5 (4)
FiboSniper Pro – Multi-Filter Fibonacci System with Auto SL/TP and Control Panel FiboSniper Pro, seçilmiş Buy ve Sell sinyalleri üretmek için dinamik Fibonacci Envelopes ile birden fazla doğrulama filtresini birleştiren teknik bir göstergedir. Fibonacci seviyeleri Moving Average ve ATR temel alınarak hesaplanır ve ardından ADX, EMA, RSI, ATR, Volume, Time ve Candle yapısı ile filtrelenir. Gösterge, ATR tabanlı otomatik Stop Loss ve Take Profit seviyelerini doğrudan grafik üzerinde görüntüler ve
Sonraki Güncelleme — Sürüm 2.52 Çok Yakında! [YENİ] Piyasa Analizinizi ve İşlem Sürecinizi Geliştirmek İçin Tasarlanmış 4 Büyük Yeni Özelliğe Hazır Olun İşlem ihtiyaçlarınızı karşılamak üzere tasarlanmış 4 yeni özellikle piyasa analizini bir üst seviyeye taşıyoruz. İşte yeni özellikler: 1. TRADE OVERVIEW DASHBOARD 2. CONFLUENCE AT ZONE 3. STRONG & WEAK HIGH/LOW 4. OTE 1. TRADE OVERVIEW DASHBOARD Piyasanın genel görünümünü daha kolay anlamanıza yardımcı olan, işlem kararlarınızı desteklemek için
M1 Sniper MT5
Oleg Rodin
5 (7)
M1 SNIPER   kullanımı kolay bir işlem göstergesi sistemidir. M1 zaman dilimi için tasarlanmış bir ok göstergesidir. Gösterge, M1 zaman diliminde scalping için bağımsız bir sistem olarak kullanılabilir ve mevcut işlem sisteminizin bir parçası olarak kullanılabilir. Bu işlem sistemi özellikle M1'de işlem yapmak için tasarlanmış olsa da, diğer zaman dilimleriyle de kullanılabilir. Başlangıçta bu yöntemi XAUUSD ve BTCUSD ticareti için tasarladım. Ancak bu yöntemi diğer piyasalarda işlem yaparken de
Auto Optimized SpeedAngle , sürekli İleriye Dönük Optimizasyon (Walk-Forward Optimization, WFO) yoluyla eğri uydurmayı (curve-fitting) ortadan kaldıran kurumsal düzeyde bir momentum vektörleme sistemidir. Piyasa rejimleri değiştiğinde etkinliğini yitiren statik girdilere güvenmek yerine, gösterge, örneklem dışı (Out-of-Sample, OOS) doğrulama kullanarak parametrelerini dinamik olarak yeniden kalibre eder ve böylece gösterilen sinyallerin geçmişteki rastgele anomalileri değil, gerçek bir istatisti
Sqn Max Indicator Sqn Max is an exclusive indicator to trade the market with high effectiveness. The indicator is based on price action, volatility and trend. This indicator is as simple as possible but not too simple. The indicator can generate alerts to ease the trading process. You don't have to stay all day in front of your screen. The indicator can be used with any class of assets and with any time frame. It is possible to achieve better results trading our list of selected assets. We achi
Crystal Heikin Ashi Signals
Muhammad Jawad Shabir
5 (5)
Crystal Heikin Ashi Signals—Professional Trend & Signal Detection Indicator Advanced Heikin Ashi Visualization with Intelligent Signal System for Manual & Automated Trading Final Price: $149 ---------> Price goes up $10 after every 10 sales . Limited slots available — act fast . Overview User Guide PDF Crystal Heikin Ashi Signals is a professional-grade MetaTrader 5 indicator that combines pure Heikin Ashi candle visualization with an advanced momentum-shift detection system. Designed for both m
Smc Pro ToolKit
Talal N Z Aljarusha
5 (14)
SMC PRO TOOLKIT — SMART MONEY ANALYSIS & STRUCTURED TRADE PLANNING SMC Pro ToolKit is a professional Smart Money Concepts analysis workspace for MetaTrader 5. It combines market structure, multi-timeframe analysis, institutional price zones, setup evaluation, confirmation tools, volume context, alerts, and risk planning inside one organized chart environment. One workspace. Multiple layers of confirmation. One structured trading plan. OPEN COMPLETE USER GUIDE MULTI-CONDITION SETUP ENGINE At
Atomic Analyst MT5
Issam Kassas
4.5 (64)
Atomic Analyst — MetaTrader 5 Satın aldıktan sonra Smart Universal Expert Advisor'ı ÜCRETSİZ edinmek ve beraberinde çevrimiçi kurs, PDF kılavuzu ve özel gruba erişim almak için MQL5 üzerinden bana mesaj gönderin. Atomic Analyst; fiyat hareketini, trend yönünü, giriş ve çıkış sinyallerini, Stop Loss ve birden fazla Take Profit seviyesini doğrudan grafiğinizde bir araya getirir. SİNYALİ GÖRÜN. İŞLEM KOŞULLARINI ANLAYIN. Atomic Analyst, analizini anlaşılır görsel bilgiler halinde sunar: • Olası gir
FX Power MT5 NG
Daniel Stein
5 (33)
FX Power: Daha Akıllı Ticaret Kararları için Para Birimlerinin Gücünü Analiz Edin Genel Bakış FX Power , her piyasa koşulunda başlıca para birimlerinin ve altının gerçek gücünü anlamak için vazgeçilmez bir araçtır. Güçlü para birimlerini alıp zayıf olanları satarak, FX Power ticaret kararlarınızı basitleştirir ve yüksek olasılıklı fırsatları ortaya çıkarır. İster trendlere sadık kalın ister Delta'nın aşırı değerlerini kullanarak tersine dönüşleri öngörün, bu araç ticaret tarzınıza mükemmel bir
Trend Catcher ind mt5
Ramil Minniakhmetov
5 (18)
TREND YAKALAYICI GÖSTERGE Trend Yakalayıcı Gösterge, yazarın tescilli ve özelleştirilmiş uyarlanabilir trend analiz göstergelerinin bir kombinasyonunu kullanarak piyasa fiyat hareketlerini analiz eder. Kısa vadeli gürültüyü filtreleyerek ve temel momentum gücüne, volatilite genişlemesine ve fiyat yapısı davranışına odaklanarak gerçek piyasa yönünü belirler. Ayrıca, hareketli ortalamalar, RSI ve volatilite filtreleri gibi yumuşatma ve trend filtreleme özelleştirilmiş göstergelerinin bir kombina
Scalper Vault, gün içi işlemlerde istikrar yakalamak isteyen yatırımcılar için tasarlanmış, güçlü ve tam donanımlı bir alım satım sistemidir. Bu yüksek hassasiyetli gösterge; hem Forex hem de İkili Opsiyon yatırımcıları için kurumsal düzeyde analizler sunan, bağımsız ve eksiksiz bir alım satım sistemi işlevi görür. SATIN ALIM İŞLEMİNDEN SONRA BENİMLE İLETİŞİME GEÇİN; ALIM SATIM İPUÇLARIMI VE HARİKA BİR BONUSU ALIN! Tahmin yürütme zorunluluğunu ve karmaşık manuel analiz süreçlerini ortadan kaldı
Unix Scalper
Issam Kassas
4 (4)
Unix Scalper — MetaTrader 5 Satın aldıktan sonra Smart Universal Expert Advisor'ı ÜCRETSİZ edinmek ve beraberinde çevrimiçi kurs, PDF kılavuzu ve özel gruba erişim almak için MQL5 üzerinden bana mesaj gönderin. İşlem fırsatını belirleyin. Planı görün. Nasıl işlem yapacağınıza karar verin. UNIX Scalper; piyasa analizini, BUY/SELL/WAIT kararlarını ve Entry, Stop Loss, TP1 ve TP2 seviyelerini düzenli bir panelde bir araya getirir. SİNYALİ VE PLANI GÖRÜN • Net kararlar: BUY, SELL veya WAIT. • Belir
SIO Oscillator: Kendi Kendini Optimize Eden Yarı Varyans Dengesizlik Osilatörü İndikatörü satın alın, ona dayalı Uzman Danışmanı (EA) ÜCRETSİZ edinin. Çoğu osilatör, tüm fiyat hareketlerini aynı şekilde değerlendirir. SIO ise yükseliş ve düşüş baskısını birbirinden ayırır ve aralarındaki dengesizliği ölçerek piyasayı gerçekte kimin kontrol ettiğini gösterir: alıcılar mı, satıcılar mı. Dengesizlik bir uç noktaya ulaştığında SIO, giriş, Stop Loss ve Take Profit seviyeleriyle birlikte net bir sinya
Çoklu Para Birimi Güç ve Momentum Göstergesi MT5 Dynamic Forex28 Navigator, uzun süredir popüler olan göstergelerimizin evrimidir ve beşinin gücünü bir arada sunar: Advanced Currency Strength28 Indicator (700 inceleme) Advanced Currency IMPULSE with ALERT (530 inceleme) Currency Strength EXOTICS GOLD Impulse with Alert CS28 Combo Signals (son Bonus) Dört gösterge satın alıp grafiklerinizde üst üste yığmanıza gerek yok. Hepsi tek bir güçlü göstergede birleşiyor: 28 Forex paritesinin gücü, onları
Adaptive Price Action Engine Göstergeyi al, EA'sı (Uzman Danışman) bedava gelsin Kendi Kendini Optimize Eden Multi-Timeframe Trend ve Mum Formasyonu Analizi Piyasalar sürekli değişir ve her Price Action formasyonu her piyasa koşulunda aynı değere sahip değildir. Adaptive Price Action Engine , değişen piyasa koşullarına uyum sağlamak amacıyla trend yapısını, Multi-Timeframe analizini, mum formasyonlarını ve istatistiksel optimizasyonu tek bir analiz sistemi içerisinde birleştirir. İki Adaptif Mod
Azimuth Pro
Ottaviano De Cicco
5 (7)
Azimuth Pro V2: Synthetic Fractal Structure and Confirmed Entries for MT5 Overview Azimuth Pro is a multi-level swing structure indicator by Merkava Labs . Four nested swing layers, swing-anchored VWAP, ABC pattern detection, three-timeframe structural filtering, and closed-bar confirmed entries — one chart, one workflow from micro-swings to macro-cycles. This is not a blind signal product. It is a structure-first workflow for traders who care about location, context, and timing. Halloween P
Neuro Poseidon MT5
Daria Rezueva
4.68 (53)
Neuro Poseidon is a new indicator by Daria Rezueva. It combines precise trading signals with adaptive TP/SL levels - creating best possible trades as a result! Message me and get  Neuro Poseidon Assistant  as a gift to automize your trading process! What makes it stand out? 1. Proven profitability on all assets and timeframes 2. Only confirmed BUY and SELL signals present on the chart 3. Adaptive TP & SL levels generated by the software for each trade 4. Easy to understand - suitable for al
Yazarın diğer ürünleri
KT Support and Resistance Levels MT5
KEENBASE SOFTWARE SOLUTIONS
5 (1)
KT Auto Support Resistance Levels: MetaTrader 4/5 için Çoklu Zaman Dilimi S&R, Smart Zones ve Seviye Paneli Swing tepeleri. Pivotlar. Order block’lar. Önceki tepe ve dipler. Her trader piyasayı biraz farklı şekilde işaretler ve bunun bedelini genellikle grafik öder. Tek ekrana yeterince fazla yöntem yığarsanız, grafik artık bir harita olmaktan çıkar. Gürültüye dönüşür. KT Auto Support Resistance Levels bunu çözer. Aylık, haftalık, günlük ve mevcut zaman diliminizi aynı anda tarar, ardından gerçe
KT Stoch Divergence MT4
KEENBASE SOFTWARE SOLUTIONS
Fiyat yeni bir zirve yaparken Stokastik bu hareketi onaylamıyorsa, traderların neden uyumsuzlukları takip ettiğini zaten biliyorsunuz. KT Stoch Divergence, fiyat ile gösterge arasındaki bu farkları doğrudan grafikte işaretler. Böylece her çizgiyi elle çizmeden olası dönüşleri ve trend devamı fırsatlarını daha kolay görebilirsiniz. Gösterge, fiyat ile Stokastik osilatör arasındaki normal ve gizli uyumsuzlukları bulur. Size otomatik bir işlem emri değil, karar verirken kullanabileceğiniz ek bilgi
ACB Breakout Arrows
KEENBASE SOFTWARE SOLUTIONS
4.15 (34)
İşlem bağlamıyla birlikte kırılma sinyalleri ACB Breakout Arrows, fiyatın sakinleştiği bir aşamadan sonra oluşan yönlü kırılmayı algılar ve kurulumu alış veya satış oku ile işaretler. Ok, algılanan bir kırılma formasyonunu gösterir. Her sinyalin büyük bir harekete dönüşeceğini garanti etmez. Alış oku yükseliş yönlü bir kırılma kurulumunu, satış oku ise düşüş yönlü bir kurulumu gösterir. Fiyat kırılma alanını yeniden test edebileceği veya önceki aralığa dönebileceği için girişten önce piyasa yapı
ACB Trade Filter MT4
KEENBASE SOFTWARE SOLUTIONS
5 (1)
Bir işlem açmadan önce ACB Trade Filter pratik bir soruyu yanıtlamanıza yardımcı olur: Piyasa bu işlemi destekliyor mu, yoksa karışık koşullarda bir sinyali zorla kabul etmeye mi çalışıyorsunuz? Gösterge piyasa duyarlılığını ve trendi analiz eder, ardından sonucu renkli histogram ve trend yönü ile sunar. Normal giriş sinyalinizden sonra doğrulama amacıyla kullanın, giriş sisteminizin yerine koymayın. Üç piyasa durumunu hızlıca görün Yeşil histogram ve yükseliş trendi: koşullar stratejinize uygun
KT Momentum Arrows
KEENBASE SOFTWARE SOLUTIONS
KT Momentum Arrows, bir mum uyarlanabilir fiyat bantlarının dışında kapandığında yükseliş ve düşüş yönlü momentum kırılımlarını oklarla işaretler. Bantlar fiyat sapmasına ve değişen volatiliteye tepki verir. Mavi yukarı ok üst bandın üzerinde kapanışı, kırmızı aşağı ok ise alt bandın altında kapanışı onaylar. Sinyal mum kapandıktan sonra sabitlenir, böylece grafiği daha sonra incelediğinizde ok başka bir bara taşınmaz. Okun gösterdiği hareket Ok, momentumun fiyatı bandın dışına taşıdığı mumu gös
KT COG Advanced MT4
KEENBASE SOFTWARE SOLUTIONS
1 (1)
KT COG is an advanced implementation of the center of gravity indicator presented by John F. Ehlers in the May 2002 edition of Technical Analysis of Stocks & Commodities magazine. It's a leading indicator which can be used to identify the potential reversal points with the minimum lag. The COG oscillator catches the price swings quite effectively. MT5 version of the same indicator is available here KT COG Advanced MT5 Calculation of COG The COG indicator is consist of the two lines. The main l
KT Pin Bar
KEENBASE SOFTWARE SOLUTIONS
KT Pin Bar identifies the pin bar formation which is a type of price action pattern which depicts a sign of reversal or rejection of the trend. When combined with support and resistance, BRN and other significant levels, Pin Bar pattern proved to be a very strong sign of reversal. Basically, a pin bar is characterized by a small body relative to the bar length which is closed either in upper or lower 50% part of its length. They have very large wicks and small candle body. A pin bar candlestic
KT Trend Magic
KEENBASE SOFTWARE SOLUTIONS
Trend yönünü doğrudan grafikte okuyun KT Trend Magic, momentum ile volatiliteyi fiyatı izleyen renkli bir çizgide birleştirir. Çizgi aktif trend durumunu sürekli gösterir ve hesaplanan yön değiştiğinde renk değiştirir. Yeşil çizgi: yükseliş trendi durumunu gösterir. Kırmızı çizgi: düşüş trendi durumunu gösterir. Renk değişimi: grafikte yeni bir yön geçişini işaretler. Süregelen bir hareket sırasında çizgi, geri çekilmeler ve devam hareketleri için dinamik bir grafik referansı olarak da kullanıla
KT Auto Fibo
KEENBASE SOFTWARE SOLUTIONS
Auto Fibonacci indicator that draws the Fibonacci retracement on the swing you are looking at, and redraws it the moment you zoom or scroll the chart. Zoom in on a pullback and the levels measure that pullback. Zoom out and they measure the whole trend. There are no anchor points to drag and no levels to redraw after every new high. Key features Measures the highest high and the lowest low on your screen, the current candle included. Follows zoom, scroll and window size at once, even when the ma
KT Psar Arrows
KEENBASE SOFTWARE SOLUTIONS
KT Psar Arrows, standart Parabolic SAR göstergesini kullanarak grafikte oklar çizer. Mumun en yüksek noktası SAR'a temas ettiğinde yükseliş oku çizilir. Mumun en düşük noktası SAR'a temas ettiğinde düşüş oku çizilir. Sinyaller, mum kapanışını beklemeden gerçek zamanlı olarak üretilir.  Özellikler Parabolic SAR göstergesini kullanan ticaret stratejilerini denemek isteyen yatırımcılar için faydalı bir araçtır.  Piyasadaki dönüş noktalarını bulmak için kullanılabilir. Özel PSAR girişlerini destekl
KT Ichimoku Trader
KEENBASE SOFTWARE SOLUTIONS
1 (1)
Otomatik işlem yapılan beş Ichimoku stratejisi KT Ichimoku Trader, beş klasik Ichimoku Kinko Hyo stratejisiyle işlemleri otomatik olarak açıp kapatan bir Expert Advisor'dır. İstediğiniz stratejileri açarsınız ve her biri kendi başına işlem yapar: kendi giriş kuralları, kendi çıkış kuralları ve aynı anda strateji başına en fazla bir açık işlem ile. Her giriş kapanmış bir mum üzerinde kontrol edilir. Yeni bir mum açıldığında EA az önce kapanan mumu okur ve yalnızca stratejinin tüm giriş kuralları
KT Volatility Oscillator
KEENBASE SOFTWARE SOLUTIONS
KT Volatilite Osilatörü, geçmiş ve mevcut piyasa verilerini matematiksel bir formül kullanarak analiz eder ve sonucu bir osilatör formunda gösterir. Yükselen ve azalan dalgalar, varlığın yüksek ve düşük volatilitesine karşılık gelir.  Kısaca, volatilite bir varlığın belirli bir zaman diliminde fiyat dalgalanmalarının ölçüsüdür. Volatilite olmasaydı, piyasada çok az hareket olurdu ve traderlar fiyat değişimlerinden kazanç sağlayamazdı. Forex Piyasasında Volatilite Kullanımı Forex piyasasında vol
KT COG Robot
KEENBASE SOFTWARE SOLUTIONS
KT COG Robot is a fully automated Expert Advisor based on the KT COG Indicator . The COG indicator was originally presented by John F. Ehlers in the May 2002 edition of Technical Analysis of Stocks & Commodities magazine. The EA fires a long trade when COG line cross above the signal line and a short trade is fired when the COG line cross below the signal line.  Adaptive Filtration Our adaptive filtration algorithm combines the original COG formula with the major trend direction and market acce
ACB Breakout Arrows EA
KEENBASE SOFTWARE SOLUTIONS
ACB kırılma işlem akışını otomatikleştirin ACB Breakout Arrows EA, aktif grafikteki kırılma sinyallerini değerlendirir ve yerleşik ACB Breakout Arrows ile ACB Trade Filter mantığını kullanarak işlemleri yönetir. EA'yı izlemek istediğiniz sembol ve zaman dilimi grafiğine ekleyin, otomatik işlemi etkinleştirin ve ardından test planınıza uygun pozisyon, seans, filtre ve çıkış kurallarını seçin. Gerekli göstergeler ve bileşenler EA içine gömülüdür, bu nedenle ayrı bir indirme gerekmez. Bu göstergele
KT Asian Breakout
KEENBASE SOFTWARE SOLUTIONS
4 (1)
KT Asian Breakout carefully analyzes the range-bound market during the Asian session and then fires a long or short trade after doing some preassessment based on its inbuilt technical analysis module. The executed orders are closed within a day before the completion of the next day session. The inbuilt technical analysis module checks for the session range and compares it with the last 20 days price movement. If it finds any erratic price movement within the session, the orders are not executed
KT London Breakout
KEENBASE SOFTWARE SOLUTIONS
First thirty minutes are essential for a trading session. The early reaction of traders and market players sets a path for the rest of the day. KT London Breakout EA takes advantage of this phenomenon, and after analyzing the first thirty minutes of London session, it places two bidirectional pending orders. One of pending order is eventually canceled after realizing the market direction with certainty. It has been strictly tested and developed for EUR/JPY using 30-Min Time Frame. You can expe
KT Auto Support Resistance Levels: MetaTrader 4/5 için Çoklu Zaman Dilimi S&R, Smart Zones ve Seviye Paneli Swing tepeleri. Pivotlar. Order block’lar. Önceki tepe ve dipler. Her trader piyasayı biraz farklı şekilde işaretler ve bunun bedelini genellikle grafik öder. Tek ekrana yeterince fazla yöntem yığarsanız, grafik artık bir harita olmaktan çıkar. Gürültüye dönüşür. KT Auto Support Resistance Levels bunu çözer. Aylık, haftalık, günlük ve mevcut zaman diliminizi aynı anda tarar, ardından gerçe
Currency strength and pair correlation in one indicator KT Currency Strength and Correlation ranks the eight major currencies from strongest to weakest and shows, in a colored matrix, how closely ten currency pairs of your choice move together. Before you open a trade from your own strategy, you can check whether the two currencies of the pair are really moving apart, and whether the new trade adds risk to a trade you already hold. What you see on the chart Strength lines: a separate window belo
MACD Divergence Seeker
KEENBASE SOFTWARE SOLUTIONS
KT MACD Divergence Seeker trades the regular and hidden divergence signals generated by our free indicator named KT MACD Divergence indicator. Trading the standalone divergences can be a risky affair that's why the KT MACD Divergence Seeker combines the standard divergence signals with an advanced analysis module to exploit the price inefficiencies on some FX pairs. What is the Divergence exactly? As a general conception if the price is making higher highs, then macd should also be making hig
KT Asian Breakout Indicator
KEENBASE SOFTWARE SOLUTIONS
Asya seansı aralığını işaretleyin KT Asian Breakout Indicator, Asya seansındaki dört saatlik bir pencerenin en yüksek ve en düşük seviyelerini işaretler ve aralık tamamlandıktan sonra fiyatı izler. GMT Offset ayarı seansı broker sunucu saatinizle hizalarken Draw Session Box görünür aralığı kontrol eder. Kırılımı ve işlem seviyelerini birlikte görün Fiyat seansın en yüksek seviyesinin üzerinde kapandığında yükseliş oku görünür. Fiyat seansın en düşük seviyesinin altında kapandığında düşüş oku gör
MACD Divergence MT4
KEENBASE SOFTWARE SOLUTIONS
KT MACD Divergence, fiyat ile osilatör arasında oluşan düzenli ve gizli uyumsuzlukları gösterir. Eğer ticaret stratejinizde trend dönüşü bekleniyorsa, potansiyel dönüş noktalarını belirlemek için MACD’nin düzenli uyumsuzluğunu kullanabilirsiniz. Trendin devamına dayalı stratejilerde ise MACD’nin gizli uyumsuzluğu daha uygun bir tercih olacaktır. KT MACD Divergence'nın Sınırlamaları MACD uyumsuzluğunu tek başına giriş sinyali olarak kullanmak riskli olabilir. Her uyumsuzluk mutlaka bir trend dö
KT Bollinger Bands Trader MT4
KEENBASE SOFTWARE SOLUTIONS
KT Bollinger Bands Trader, düşük volatilite dönemlerinde Bollinger Bantlarını kullanarak ortalamaya dönüş stratejisi uygulayan %100 otomatik bir uzman danışmandır (Expert Advisor). Fiyat genellikle Bollinger Bantlarının üst veya alt çizgisine tepki verir, ancak her zaman bir dönüş gerçekleşmez. Bununla birlikte, düşük volatilite dönemlerinde fiyat dönüşü olasılığı daha yüksektir. Girişler Fiyat Bollinger Bantlarının alt çizgisinin altına doğru şekilde hizalandığında alış işlemi başlatılır. Fiya
KT CCI Divergence MT4
KEENBASE SOFTWARE SOLUTIONS
KT CCI Divergence shows the regular and hidden divergence created between the price and CCI oscillator. Divergence is one of the vital signals that depicts the upcoming price reversal in the market. Manually spotting the divergence between price and CCI can be a hectic and ambiguous task. Limitations of KT CCI Divergence   Using the CCI divergence as a standalone entry signal can be risky. Every divergence can't be interpreted as a strong reversal signal. For better results, try to combine it w
KT Heiken Ashi Smoothed MT4
KEENBASE SOFTWARE SOLUTIONS
Yumuşatılmış Heiken Ashi durumunu takip edin KT Heiken Ashi Smoothed, fiyat hareketini yumuşatılmış mavi ve kırmızı mumlara dönüştürür. Durum düşüşten yükselişe geçtiğinde mavi yukarı ok, yükselişten düşüşe geçtiğinde kırmızı aşağı ok ekleyerek yön geçişlerinin grafikte kolayca görülmesini sağlar. Yumuşatma periyodu ve yumuşatma yöntemi, mumların ne ölçüde yumuşatılacağını belirler. Böylece standart Heiken Ashi'ye göre daha istikrarlı bir görünüm sunarken grafiğinize uygun tepkiyi seçmenize olan
KT MA Crossover MT4
KEENBASE SOFTWARE SOLUTIONS
KT MA Crossover, seçilen hareketli ortalamaların kesişimine göre alım ve satım oklarını çizer. Ayrıca her ardışık sinyal için uygun uyarıları üretir ve MFE (En Avantajlı Sapma) değerini görüntüler. Hareketli ortalama kesişimi, dünya çapında trader'lar tarafından yaygın olarak kullanılan temel stratejilerden biridir. Genellikle biri hızlı, diğeri yavaş olmak üzere iki hareketli ortalamadan oluşur ve kesişim yönüne göre alım ya da satım sinyali üretir. Alım sinyali – hızlı MA, yavaş MA'nın üzerin
KT Round Numbers MT4
KEENBASE SOFTWARE SOLUTIONS
KT Round Numbers plots the round number levels which are also commonly known as psychological levels in the Forex world. In the context of Forex trading, round number levels are those levels in which there are two or more zeroes at the end. They are named as 00 levels on the chart. Some traders also consider the halfway points as a valid round number level. They are named as 50 levels on the chart. Use of round number levels in trading Round number levels work as strong support and resistance
KT Inside Bar Advanced MT4
KEENBASE SOFTWARE SOLUTIONS
Despite the popularity of inside bar pattern among the traders, using it as a standalone signal doesn't provide any edge in the market. KT Inside Bar Advanced indicator solves this problem by combining the classic inside bar pattern with the "ECE" cycle and Fibonacci extensions. Using this indicator in place of our classic inside bar indicator will provide a tremendous advantage and edge in the market. What is the ECE cycle? In financial markets, the price never moves in a straight line but u
KT Inside Bar Hunter MT4
KEENBASE SOFTWARE SOLUTIONS
Despite the popularity of inside bar pattern among traders, using it as a standalone entry signal doesn't provide any evidentiary advantage. KT Inside Bar Hunter trades only selected inside bar patterns using some preassessment and ECE price action cycle. Trading Strategy On successful detection of the required pattern, EA places a pending order in the direction of the forecasted price expansion phase. Pending orders are canceled if they are not triggered within the next bar. Once triggered, ac
KT CCI Surfer MT4
KEENBASE SOFTWARE SOLUTIONS
KT CCI Surfer uses a mean reversion trading strategy with a combination of extreme overbought/oversold zone detection using the Commodity Channel Index (CCI). Developed by Donald Lambert in 1980, CCI is a leading indicator that helps to identify the overbought/oversold region in the market without any lag. Obviously, not every overbought/oversold signal turns out into a price reversal. However, when combined with a well-planned mean reversion strategy, it produces excellent results. Recommend
KT RSI Divergence Robot MT4
KEENBASE SOFTWARE SOLUTIONS
Onaylanmış RSI uyumsuzluklarını işlem yapın KT RSI Divergence Robot, grafikteki sembol ve zaman diliminde fiyat ile Göreceli Güç Endeksi arasındaki normal ve gizli uyumsuzlukları izler. Yeni sinyaller bir mum tamamlandıktan sonra değerlendirilir. Yükseliş uyumsuzluğu alış pozisyonu, düşüş uyumsuzluğu ise satış pozisyonu açabilir. Ters yönde bir sinyal oluştuğunda EA, yeni girişi değerlendirmeden önce diğer yöndeki pozisyonları kapatabilir. Giriş koşullarını seçin Temel uyumsuzluk mantığını değiş
Filtrele:
Değerlendirme yok
Değerlendirmeye yanıt