Fractal Broken
- Göstergeler
- Sürüm: 1.1
- Güncellendi: 12 Nisan 2026

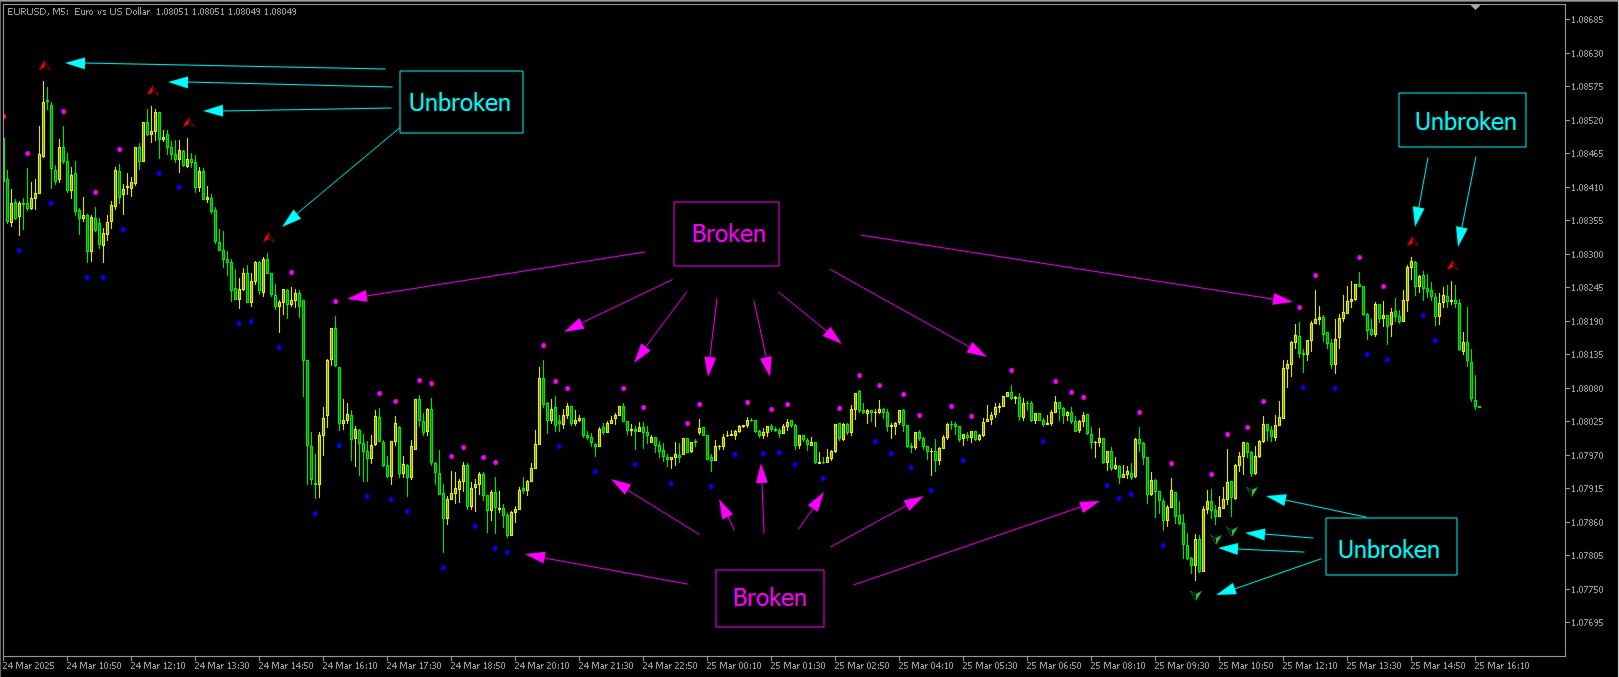
Fractals Broken/Unbroken
This indicator detects classic Bill Williams fractals and separates them into two categories: broken and unbroken fractals.
The tool helps traders quickly identify which fractal levels have already been broken by price action and which levels remain intact as potential support or resistance zones.
The indicator works directly on the chart and displays different fractal types using separate colors for easier visual analysis.
How It Works
The indicator uses the standard 5-bar Bill Williams fractal pattern:
- an upper fractal is formed when the center bar has the highest High compared to neighboring bars;
- a lower fractal is formed when the center bar has the lowest Low compared to neighboring bars.
After a fractal is confirmed, the indicator analyzes future price movement and determines:
- whether the fractal level has been broken;
- or whether the level remains unbroken.
Signal Types
Unbroken Upper Fractal
Displayed with a green arrow. Indicates an upper fractal level that has not been broken by price.
Broken Upper Fractal
Displayed with a magenta arrow. Indicates an upper fractal whose level was later broken by price action.
Unbroken Lower Fractal
Displayed with a red arrow. Indicates a lower fractal level that has not been broken by price.
Broken Lower Fractal
Displayed with a blue arrow. Indicates a lower fractal whose level was later broken by price action.
Indicator Features
- automatic classification of fractals into broken and unbroken;
- chart-based visualization;
- color separation for easier analysis;
- adjustable number of analyzed bars;
- compatible with any symbol and timeframe;
- no DLL usage or external connections.
Input Parameters
barscount
Number of bars used for fractal analysis and breakout verification.
Possible Applications
The indicator can be used for:
- identifying support and resistance levels;
- market structure analysis;
- detecting breakout areas;
- filtering trading signals;
- analyzing fractal price structure.
Important
The indicator does not open trades automatically and is not an Expert Advisor.
Indicator behavior depends on market conditions, selected symbol, timeframe, and input settings.
фрактал Вильямса фрактал БВ фракталы Вильямса пробой фрактала пробитый фрактал Торговый хаос broken fractal unbroken fractal Williams fractal Trading Haos Bill Williams
Kullanıcı değerlendirmeye herhangi bir yorum bırakmadı