Pivot Math Support and Resistance Lines

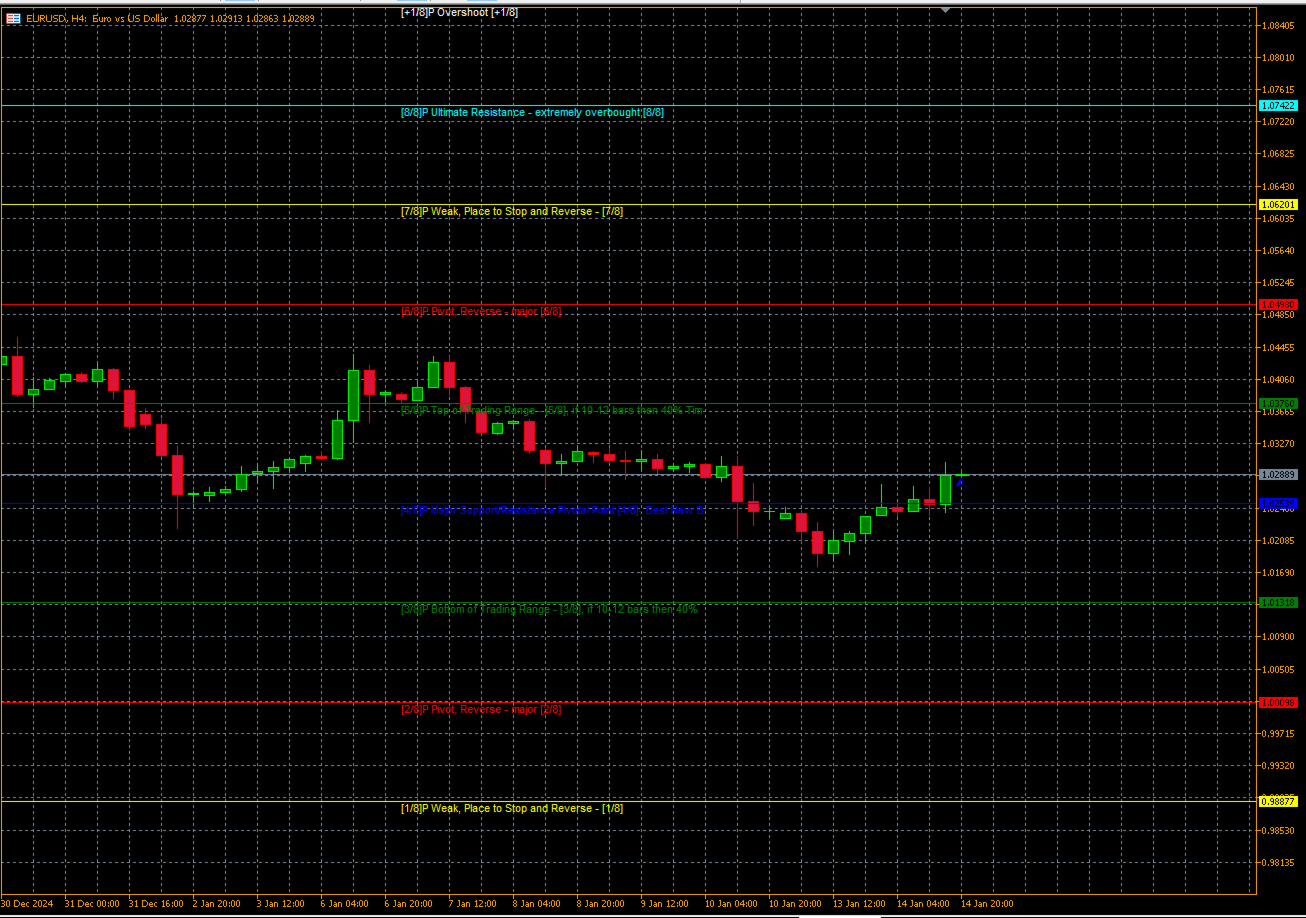
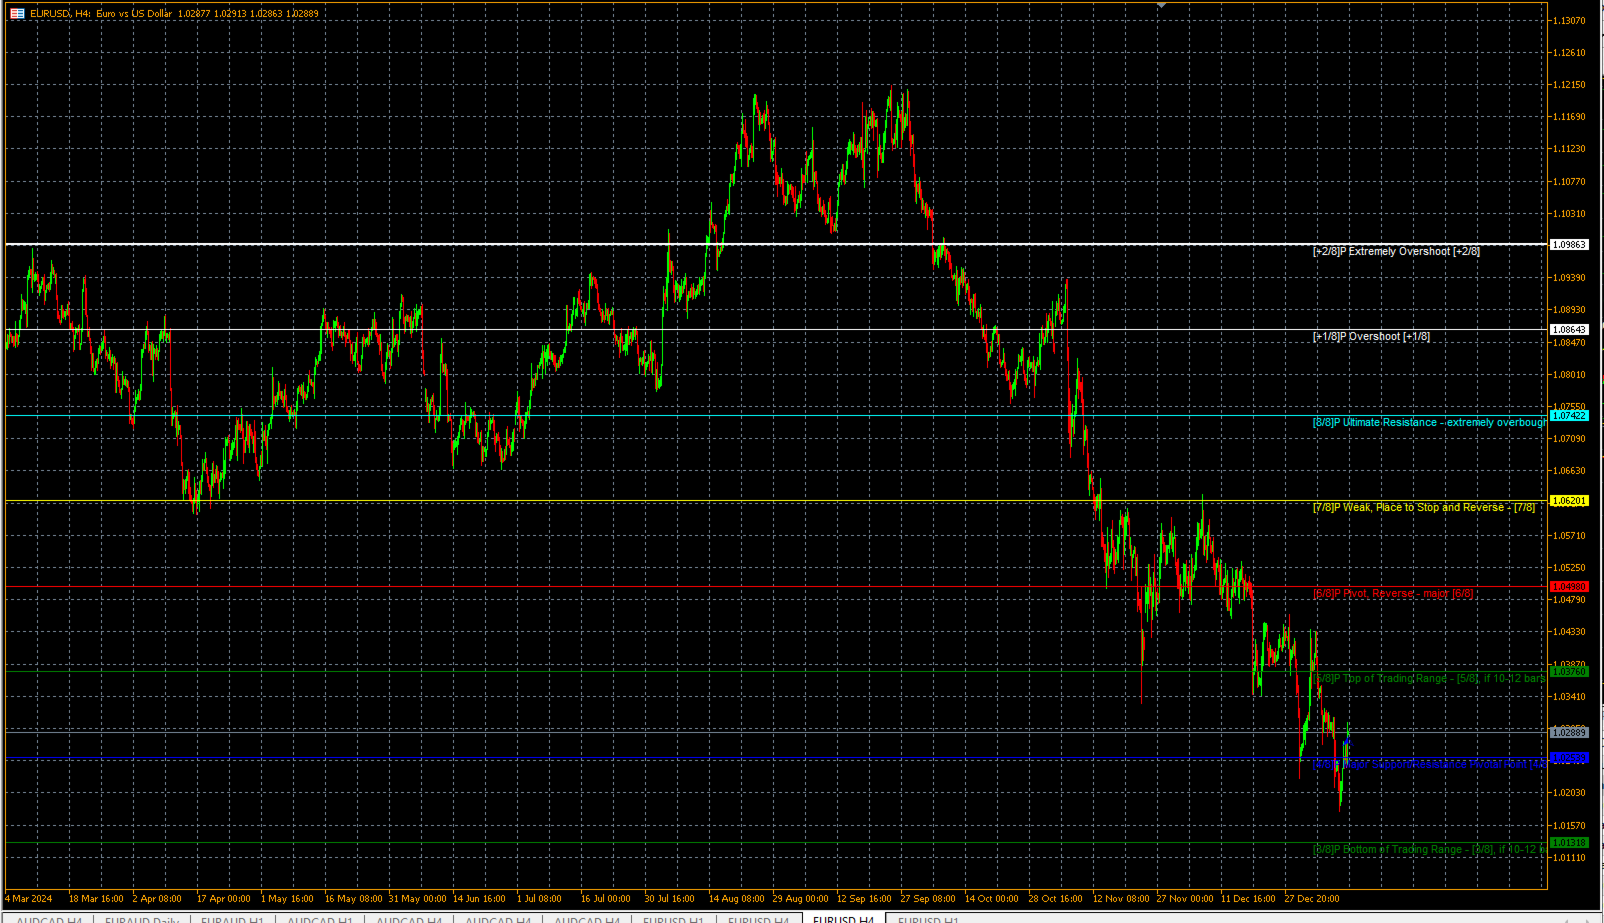
Pivot Math Support and Resistance Lines indicator — indicator showing pivot lines, which will definitely help every trader who knows how to trade with resistance, support and pivot lines. It shows 8 different lines (additional lines are also possible) on the main chart, helping you find the best points to buy, sell and exit positions. 

Input parameters:

P (default = 64) — period in bars or other periods (set using MMPeriod), on which the lines will be calculated. The smaller this number, the "fresher" and less accurate the lines will be.

MMPeriod (default = 1440) — base period in minutes (60 — for hourly lines, 1440 — for daily lines, 10080 — for weekly and 43200 — for monthly); if greater than zero, the indicator will use P MMPeriod minutes to calculate the lines. If zero, the indicator will use P current bars for its calculations.

StepBack (default = 0) — step back for calculating lines (in current bars or in MMPeriod (if set) minutes).

Other parameters — affect only the visual display of lines.

Pivot Math Support and Resistance Lines is simple. The 0/8P and 8/8P lines are the strongest support and resistance lines — they are very difficult to break. The 1/8P and 7/8P lines are weak support and resistance lines, but if the price stops near them, it will change direction. The 2/8P and 6/8P lines are strong reversal lines. 3/8P and 5/8P are the bottom and top lines of the average trading range; there is a very high probability that the price will either break through this range very quickly or stay in it for a long time. 4/8P is the strongest support and resistance line. You can confidently sell and buy when the price breaks through this level. The blue arrow shows the last bar for which the lines were calculated.


Önerilen ürünler
Pivot Points MT5 is a universal color multicurrency/multisymbol indicator of the Pivot Points levels systems. You can select one of its three versions: Standard Old, Standard New and Fibo . It plots pivot levels for financial instruments in a separate window . The system will automatically calculate the Pivot Point on the basis of market data for the previous day ( PERIOD_D1 ) and the system of support and resistance levels, three in each. A user can choose colors for the indicator lines. The on
Daha Yüksek Zaman Dilimine Dayalı Fraktal Seviyeler, daha yüksek zaman dilimindeki fraktallara dayalı doğru destek ve direnç seviyeleri oluşturmak için tasarlanmış güçlü bir araçtır, size uygun uyarılarla alım ve satım sinyalleri sağlar. Nasıl çalışır: Gösterge, üst zaman dilimindeki fraktal seviyeleri analiz eder ve bunları mevcut grafiğinizde görüntüler. Stratejilerinizle maksimum doğruluk ve alaka düzeyi elde etmek için göstergenin özelliklerinde üst düzey zaman dilimini kolayca ayarlayabil
Support and Resistance ACPG
Victor Alfonso Molina Botello
Support And Resistance ACPG Indicator  The Support And Resistance ACPG Indicator  (developed by Grok by xAI) is an advanced tool for the MetaTrader 5 (MQL5) platform, designed to identify and visualize support and resistance zones on a price chart. Unlike traditional support and resistance indicators, the ACPG method combines a dynamic approach based on swing points, volatility analysis using the Average True Range (ATR), and an adaptive clustering system to detect high-relevance zones in the
FREE
Custom Pivots MT5
Tsvetan Tsvetanov
5 (1)
Pivots Points are significant levels traders can use to determine directional movement, support and resistance. Pivot Points use the prior period's high, low and close to formulate future support and resistance. In this regard, Pivot Points are predictive and leading indicators. Pivot Points were originally used by floor traders to set key levels. Floor traders are the original day traders. They deal in a very fast moving environment with a short-term focus. At the beginning of the trading day,
Camarilla Pivot
Philip Thakadiyil George
Camarilla Pivot Pro EA is a fully automated trading robot built around the powerful Camarilla Pivot Point formula. The EA calculates intraday pivot levels (H1–H6 & L1–L6) and trades based on price reactions at major Camarilla reversal and breakout zones. It is designed for traders who want a clean, mechanical, and proven pivot-based strategy without repainting signals or complicated indicators.
Çoklu Zaman Dilimi Mumları   göstergesi, yatırımcıların daha düşük zaman dilimi analizlerini daha yüksek zaman dilimi yapısıyla uyumlu hale getirmelerine yardımcı olmak için tasarlanmış güçlü bir görselleştirme aracıdır. Seçili daha yüksek bir zaman diliminden (H1, H4, D1, vb.) mumları doğrudan mevcut grafiğinize çizerek, bu gösterge grafikleri değiştirmeden genel piyasa anlatısına dair daha net bir bakış açısı sunar. Bu Göstergeye Kimin İhtiyacı Var? Bu araç şunlar için idealdir: Akıllı Para
KT Auto Trendline MT5
KEENBASE SOFTWARE SOLUTIONS
KT Auto Trendline draws the upper and lower trendlines automatically using the last two significant swing highs/lows. Trendline anchor points are found by plotting the ZigZag over X number of bars. Features No guesswork requires. It instantly draws the notable trendlines without any uncertainty. Each trendline is extended with its corresponding rays, which helps determine the area of breakout/reversal. It can draw two separate upper and lower trendlines simultaneously. It works on all timeframe
The PUA MultiType Pivot indicator is built on the daily chart of the previous day. The PUA MultiType Pivot indicator is one of the most popular tools in technical analysis, used by traders to identify potential reversal points in financial markets. This indicator constructs three types of Pivot points: Classic, Fibonacci, and Camarilla, each offering its unique approach to market analysis. The advantages of this indicator include: Simplicity and Clarity PUA MultiType Pivot provides clearly defi
Support & Resistance Zone Indicator This indicator dynamically identifies and draws support and resistance zones based on recent price action and fractal patterns. By analyzing ZigZag pivot points and tracking price reactions (touches, bounces, and breaks), the indicator determines the strength and validity of each zone. Key Features: Multi-Timeframe Support: Can work across different timeframes. Fractal-Based Detection: Utilizes both fast and slow fractal detection to find significant swing po
Smart Trendlines MT5
Suvashish Halder
5 (3)
Smart Trendlines – No.1 Trendlines Indicator Smart Trendlines is a precision tool that automatically draws trendlines based on every valid pivot point, helping traders identify key support and resistance zones. It continuously adjusts as new market pivots form, providing a live and accurate reflection of price structure. Whether you’re tracking trends, preparing for reversals, or anticipating breakouts — this indicator keeps you one step ahead. It works seamlessly across all assets including For
Flat Auto Fibonacci is an MT5-only automatic Fibonacci drawing indicator with full multi-timeframe (MTF) support. It detects confirmed swings only by confirming HL/LH breaks based on candle close , and then automatically draws only the latest one Fibonacci set (UP / DN) per timeframe . No matter which chart timeframe you open, you can view Fibonacci levels for M5 / M15 / M30 / H1 / H2 / H4 all at the same time. Key Features Multi-Timeframe (MTF) Support Display Fibonacci levels from multiple tim
A pivot point is   an intraday technical indicator used to identify trends and reversals mainly in equities, commodities, and forex markets . Pivot points are calculated to determine levels in which the sentiment of the market could change from bullish to bearish, and vice-versa. the swing daily is an advanced pivot points indicator that grants the user control over many aspects of the trading levels that you'll get familiar with in the controls section  it's used mainly to locate intraday tr
Auto Support and Resistances
Flavio Javier Jarabeck
4.57 (70)
Are you tired of drawing Support & Resistance levels for your Quotes? Are you learning how to spot Support & Resistances? No matter what is your case, Auto Support & Resistances will draw those levels for you! AND, it can draw them from other timeframes, right into you current chart, no matter what timeframe you are using... You can also Agglutinate regions/zones that are too much closer to each other and turning them into one single Support & Resistance Level. All configurable. SETTINGS Timefr
FREE
All Harmonics 26
Alexey Isavnin
3.5 (4)
Harmonic patterns are characteristic series of price movements with respect to Fibonacci levels, which statistically precede price reversals. This indicator searches for harmonic patterns. It is capable of recognising 26 classical and non-classical harmonic patterns : Classical Gartley Butterfly Alternate Butterfly Bat Alternate Bat Crab Deep Crab Three Drives Non-classical Shark Alternate Shark Cypher 5-0 Anti Gartley Anti Butterfly Anti Alternate Butterfly Anti Bat Anti Alternate Bat Anti Crab
Created by imjesstwoone and mickey1984, this trade model attempts to capture the expansion from the 10:00-14:00 EST 4h candle using just 3 simple steps. All of the information presented in this description has been outlined by its creators, all I did was translate it to MQL5. All core settings of the trade model may be edited so that users can test several variations, however this description will cover its default, intended behavior using NQ 5m as an example. Step 1 is to identify our Price Ra
Daily Pivots Multi Indicator Daily Pivots Multi is an exclusive indicator to draw your pivots levels and much more. Most indicators draw daily pivots for the day. Daily Pivots Multi is able to draw levels for different days. The indicator can do the calculation for unlimited number of days backward. It means that you can draw the levels for today but also for the past days. This is very useful if you want to study a strategy with Pivots levels over a period of time. Another problem is that e
MetaTrend M5
Vahidreza Heidar Gholami
Meta Trend Indicator is an efficient way to forecast and detect the trend in any market. It reveals the trend, support and resistance levels, volatility and the maximum potential target, all in one indicator. To adapt to the price and to decrease consecutive trend failures, the internal trend detector algorithm studies the market and dynamically chooses the right values for the internal parameters. This indicator is a perfect trend filter for any strategy or expert advisor. Features Super Adapti
CDV Swing Radar
Pierpaolo De Nicolo
CDV Swing Radar is an indicator for MetaTrader 5 designed to identify potential reversal areas through cumulative volume delta (CVD) swing analysis. The indicator compares price pivots with CVD pivots to highlight two key conditions: Absorption: The price forms a lower low while the CVD shows a stronger structure Exhaustion: The price forms a higher high while the CVD shows a weaker structure The goal is to help you identify swing points where the price movement is no longer confirmed by the u
Automatic Fibonacci Tool Fibonacci retracements is a popular instrument used by technical analysts to determine potential Support and Resistance areas. In technical analysis, this tool is created by taking two extreme points (usually a peak and a minimum) on the chart and dividing the vertical distance by the key Fibonacci coefficients equal to 23.6%, 38.2%, 50%, 61.8%, and 100%. Our Automatic Fibonacci Tool is programmed to make thigs easier. Using this tool, there is no need to explicitly set
Support & Resistance Auto Plot Lines Indicator for MT5 – Perfect for Scalping! Make your trading easier with our Support & Resistance Auto Plot Lines indicator for MT5. This powerful tool automatically detects key support and resistance levels on your chart, helping you make better trading decisions with minimal effort. Why Choose This Indicator? Perfect for Scalping – Quickly identify strong price zones for fast, precise entries and exits. Automatic Level Detection – No need to manually dra
Awesome Oscillator by Bill Williams with the ability to fine-tune and replace the averaging algorithms of the indicator, which significantly expands the possibilities of using this oscillator in algorithmic trading and brings it closer in its properties to such an indicator as the MACD. To reduce price noise, the final indicator is processed with an additional Smooth averaging. The indicator has the ability to give alerts, send mail messages and push signals when the direction of movement of th
L'indicatore SMC Venom Model BPR è uno strumento professionale per i trader che operano nell'ambito del concetto di Smart Money (SMC). Identifica automaticamente due modelli chiave sul grafico dei prezzi: FVG   (Fair Value Gap) è una combinazione di tre candele, in cui c'è un gap tra la prima e la terza candela. Forma una zona tra livelli in cui non c'è supporto di volume, il che spesso porta a una correzione dei prezzi. BPR   (Balanced Price Range) è una combinazione di due modelli FVG che for
Price Breakout pattern Scanner is the automatic scanner for traders and investors. It can detect following patterns automatically from your chart. Head and Shoulder - Common tradable pattern. Reverse Head and Shoulder - This pattern is the reverse formation of the Head and Shoulder. Double Top - When the price hits resistance level twice and decline toward the support level, the trader can anticipate sudden bearish breakout through the support level. Double Bottom - The double bottom pattern is
Dynamic Pivot Zones
Vincent Jose Proenca
Dynamic Pivot Zones – Your Level Assistant on the Chart This indicator is a bit like a GPS for your trading . It shows you where the price likes to hang out, where it gets nervous, and where it flies through. No more calculating pivots by hand or guessing support and resistance levels. What it does: Automatically plots H1, H4, and D1 pivots . Shows support and resistance zones : R1, R2, S1, S2. Lines are colored and easy to read , so you can instantly see what’s hot or cold. Why you’ll love it:
FREE
CosmiCLab SMC FIBO CosmiCLab SMC FIBO is a professional trading indicator designed for traders who use Smart Money Concepts (SMC), market structure analysis and Fibonacci retracement levels. The indicator automatically detects market swings and builds Fibonacci levels based on the latest impulse movement. It also identifies market structure changes such as BOS (Break of Structure) and CHOCH (Change of Character), helping traders understand the current market direction. CosmiCLab SMC FIBO also pr
Dominate the Markets with Professional Support & Resistance Detection Finally , an   indicator   that does   the   heavy   lifting for you.   Stop   squ inting at charts   trying   to identify   support and resistance levels manually . Our   Automatic   SN R Indicator   transforms   your trading by   instantly   revealing the critical price   levels that  professional  traders are watching! Why   Traders   Are   Switching   to   Automate d SN R Detection Manual   analysis takes   hours   an d
To review our products, please click the link: LINK This Classic Pivot Point Indicator accurately calculates and displays 7 essential pivot levels , including the Pivot Point , 3 Support levels (S1–S3) , and 3 Resistance levels (R1–R3) based on the standard classic pivot formula . Designed for Forex, indices, commodities, and crypto trading , it supports multi-currency and multi-timeframe analysis in a clean, professional dashboard interface . With the built-in interactive dashboard , traders c
Welcome to the Ultimate Harmonic Patterns recognition indicator that is focused to detect advanced patterns. The Gartley pattern, Bat pattern, and Cypher pattern  are popular technical analysis tools used by traders to identify potential reversal points in the market. Our Ultimate Harmonic Patterns recognition Indicator is a powerful tool that uses advanced algorithms to scan the markets and identify these patterns in real-time. With our Ultimate Harmonic Patterns recognition Indicator, you ca
This Pivot Points Indicator can be switched between the following well-known types: Standard/Classic (7 levels)  Woodie (5 levels)  Fibonacci (7 levels)  DeMark (3 levels) Pivot Points are calculated based on the previous day's values - according to the most common formulas on the web - and serve as an important tool for many traders, especially in day trading. They indicate possible resistance and support where increased buyer and seller interest can be expected. A common trading approach, for
Edge loophole detector
Mahmoud Ahmed Abdou Ali
Quantitative Session Breakout Profiler & Data Miner Executive Summary: The "London Hunter v18.0" is not merely a buy/sell signal indicator; it is a statistical data mining engine . Its core idea is that market openings (London, NY, Asia) are not random, but distinct "micro-regimes." By measuring the specific "physics" of price movement (speed, pullback, candle size) during these opening windows, the system identifies which specific conditions lead to successful breakouts and which lead to fakeou
Bu ürünün alıcıları ayrıca şunları da satın alıyor
ARIPoint
Temirlan Kdyrkhan
ARIPoint is a powerful trading companion designed to generate high-probability entry signals with dynamic TP/SL/DP levels based on volatility. Built-in performance tracking shows win/loss stats, PP1/PP2 hits, and success rates all updated live. Key Features: Buy/Sell signals with adaptive volatility bands Real-time TP/SL/DP levels based on ATR Built-in MA Filter with optional ATR/StdDev volatility Performance stats panel (Success, Profit/Loss, PP1/PP2) Alerts via popup, sound, push, or email Cu
SuperScalp Pro
Van Minh Nguyen
4.57 (21)
SuperScalp Pro – Gelişmiş Çoklu Filtre Scalping Gösterge Sistemi SuperScalp Pro, işlem fırsatlarını belirlemeye yardımcı olmak için klasik Supertrend ile birden fazla akıllı onay filtresini birleştiren gelişmiş bir scalping göstergesidir. M1’den H4’e kadar farklı zaman dilimlerinde verimli şekilde çalışır ve XAUUSD, BTCUSD ile majör Forex pariteleri için optimize edilmiştir. Gösterge, net Al ve Sat sinyalleri sunar ve ATR tabanlı otomatik giriş fiyatı, stop loss ve take profit seviyeleri hesapla
Divergence Bomber
Ihor Otkydach
4.9 (86)
Bu göstergeyi satın alan herkese aşağıdaki ekstra içerikler ücretsiz olarak sunulmaktadır: Her işlemi otomatik olarak yöneten, Stop Loss ve Take Profit seviyelerini ayarlayan ve işlemleri strateji kurallarına göre kapatan özel yardımcı araç: "Bomber Utility" Göstergenin farklı varlıklar üzerinde kullanılmasına yönelik ayar dosyaları (set dosyaları) Bomber Utility için 3 farklı modda kullanım sunan ayar dosyaları: "Minimum Risk", "Dengeli Risk" ve "Bekle-Gör Stratejisi" Bu ticaret stratejisini hı
Entry In The Zone and SMC Multi Timeframe is a real-time 2-in-1 market analysis tool that combines market structure analysis and a No Repaint BUY / SELL signal system into a single indicator, built on Smart Money Concepts (SMC) — a widely adopted framework used by professional traders to understand market structure. This indicator helps you see the market more clearly, make decisions based on structure rather than guesswork, and focus on high-probability zones where price is more likely to react
Quantum TrendPulse
Bogdan Ion Puscasu
5 (23)
SuperTrend   ,   RSI   ve   Stochastic'in   gücünü tek bir kapsamlı göstergede birleştirerek işlem potansiyelinizi en üst düzeye çıkaran nihai işlem aracı olan   Quantum TrendPulse'u   tanıtıyoruz. Hassasiyet ve verimlilik arayan yatırımcılar için tasarlanan bu gösterge, piyasa trendlerini, momentum değişimlerini ve en uygun giriş ve çıkış noktalarını güvenle belirlemenize yardımcı olur. Temel Özellikler: SuperTrend Entegrasyonu:   Güncel piyasa trendlerini kolayca takip edin ve karlılık dalgası
Power Candles MT5
Daniel Stein
4.75 (8)
Power Candles – Tüm Piyasalar İçin Güce Dayalı Giriş Sinyalleri Power Candles , Stein Investments’ın kanıtlanmış güç analizini doğrudan fiyat grafiğinize taşır. Sadece fiyata tepki vermek yerine, her mum gerçek piyasa gücüne göre renklendirilir. Bu sayede momentum birikimleri, güç hızlanmaları ve net trend geçişleri anında görülebilir. Tüm Piyasalar İçin Tek Mantık Power Candles tüm işlem sembollerinde otomatik olarak çalışır. Gösterge, mevcut sembolün Forex mi yoksa Forex dışı bir piyasa mı old
Bu indikatörü satın alırsanız, Profesyonel Trade Manager’ımı  + EA ÜCRETSİZ olarak alacaksınız. Öncelikle, bu Ticaret Sistemi'nin Non-Repainting, Non-Redrawing ve Non-Lagging Göstergesi olduğunu vurgulamak önemlidir, bu da hem manuel hem de robot ticareti için ideal hale getirir. Online kurs, kılavuz ve ön ayarları indir. "Smart Trend Trading System MT5", yeni ve deneyimli tüccarlar için özelleştirilmiş kapsamlı bir ticaret çözümüdür. 10'dan fazla premium göstergeyi birleştiriyor ve 7'den fazla
Gann Made Easy , bay teorisini kullanarak ticaretin en iyi ilkelerine dayanan, profesyonel ve kullanımı kolay bir Forex ticaret sistemidir. WD Gann. Gösterge, Zararı Durdur ve Kâr Al Seviyeleri dahil olmak üzere doğru SATIN AL ve SAT sinyalleri sağlar. PUSH bildirimlerini kullanarak hareket halindeyken bile işlem yapabilirsiniz. Satın alma işleminden sonra, alım satım talimatlarını ve harika ek göstergeleri ücretsiz olarak almak için lütfen benimle iletişime geçin! Muhtemelen Gann ticaret yöntem
Azimuth Pro
Ottaviano De Cicco
5 (7)
Azimuth Pro V2: Synthetic Fractal Structure and Confirmed Entries for MT5 Overview Azimuth Pro is a multi-level swing structure indicator by Merkava Labs . Four nested swing layers, swing-anchored VWAP, ABC pattern detection, three-timeframe structural filtering, and closed-bar confirmed entries — one chart, one workflow from micro-swings to macro-cycles. This is not a blind signal product. It is a structure-first workflow for traders who care about location, context, and timing. V2 Launch Offe
OmniSync Projection
Antonio-alin Teculescu
5 (1)
Chronos Fractal Engine is an innovative price projection indicator for MetaTrader 5, designed to transform your technical analysis by intelligently identifying and projecting historical price patterns. Built upon an advanced correlation algorithm and the fractal principles of the market, this powerful tool visualizes potential future price movements, giving you a unique edge in your trading decisions. What is Chronos Fractal Engine? At its core, the Chronos Fractal Engine employs a sophisticat
FX Trend MT5 NG
Daniel Stein
5 (4)
FX Trend NG: Yeni Nesil Çoklu Piyasa Trend Zekâsı Genel Bakış FX Trend NG , çoklu zaman dilimlerinde çalışan profesyonel bir trend analiz ve piyasa izleme aracıdır. Piyasanın yapısını saniyeler içinde anlamanızı sağlar. Birden fazla grafik arasında geçiş yapmak yerine, hangi enstrümanların trendde olduğunu, momentumun nerede zayıfladığını ve hangi zaman dilimlerinin uyumlu olduğunu anında görebilirsiniz. Lansman Teklifi – FX Trend NG sadece $30 (6 Ay) veya $80 Ömür Boyu Lisans ile edinin. Zate
Trend Screener Pro MT5
STE S.S.COMPANY
4.85 (104)
Trend Göstergesi, Trend Alım Satım ve Filtreleme için Çığır Açan Benzersiz Çözüm, Tüm Önemli Trend Özellikleriyle Tek Bir Araç İçinde Yerleştirildi! Forex, emtialar, kripto para birimleri, endeksler ve hisse senetleri gibi tüm sembollerde/araçlarda kullanılabilen %100 yeniden boyamayan çoklu zaman çerçevesi ve Çoklu para birimi göstergesidir. Trend Screener, grafikte noktalarla ok trend sinyalleri sağlayan etkili bir trend trend göstergesidir. Trend analizörü göstergesinde bulunan özellikler: 1.
Grabber System MT5
Ihor Otkydach
4.83 (23)
Size mükemmel bir teknik gösterge olan Grabber’ı tanıtıyorum. Bu araç, kullanıma hazır bir “her şey dahil” işlem stratejisi olarak çalışır. Tek bir yazılım kodu içinde güçlü piyasa teknik analiz araçları, işlem sinyalleri (oklar), uyarı işlevleri ve push bildirimleri entegre edilmiştir. Bu göstergeyi satın alan herkes aşağıdaki hediyeleri ücretsiz olarak alır: Açık emirleri otomatik yönetmek için Grabber Yardımcı Aracı Kurulum, yapılandırma ve nasıl işlem yapılacağını adım adım anlatan video kıl
Önce dürüst olalım. Hiçbir gösterge tek başına sizi kârlı yapmaz. Eğer biri size aksini söylüyorsa, size bir hayal satıyordur. Mükemmel al/sat okları gösteren her gösterge, kusursuzmuş gibi görünecek şekilde yapılabilir — sadece geçmişin doğru bir bölümünü yakınlaştırıp kazanan işlemleri ekran görüntüsü almanız yeterlidir. Biz bunu yapmıyoruz.  SMC Intraday Formula bir araçtır. Piyasa yapısını sizin için okur, en yüksek olasılıklı fiyat bölgelerini belirler ve şu anda akıllı paranın izinin nası
Hangi stratejinin sizin sembolunuzde gercekten calistigini gorun - gercek paranizi riske atmadan once. Power Bar, herhangi bir sembol ve herhangi bir zaman diliminde asiri fiyat barlarini tespit eder, ardindan 3 farkli islem stratejisini aninda geriye donuk test eder. Boylece kazanma oranlarini, kar faktorlerini ve P&L'yi yan yana karsilastirabilirsiniz. Tek bir interaktif panelde. Tahmin yok. Esriye uydurma yok. Sadece veri. Power Bar'i benzersiz yapan nedir? Cogu indikator size bir sinyal ver
CGE Trading Suite
Carl Gustav Johan Ekstrom
5 (2)
Institutional-Grade Analytics for MT5 C GE Trading Suite delivers the analytical edge typically reserved for professional trading desks. The platform integrates a full suite of analytical tools into one seamless workflow: dynamic grid mapping, liquidity behavior analysis, ECM, trend lines, MIDAS, trade cycles, and directional channel projections. Together, these provide a unified view of market structure and momentum. Directional clarity is further enhanced by the capital flow index, which meas
SignalTech MT5 is a trading system for EURUSD, USDCHF, USDJPY, AUDUSD, NZDUSD, EURJPY, AUDJPY, NZDJPY, CADJPY H2 and H3 Timeframe.  It can generate signals with Buy/Sell Arrows and Pop-Up/Sound Alerts. Each signal has clear Entry and Stop Loss levels, which should be automatically flagged on the chart, as well as potential Targets 1, 2, and 3. The Entry and TP levels are fixed after the trade is taken. The exit level is dynamic. If there are signs of a potential short-term trend reversal, the
Atomic Analyst MT5
Issam Kassas
3.94 (31)
Öncelikle belirtmek gerekir ki bu Ticaret Göstergesi Yeniden Çizim Yapmaz, Gecikmez ve Gecikme Göstermez, bu da hem manuel hem de robot ticareti için ideal hale getirir. Kullanıcı kılavuzu: ayarlar, girişler ve strateji. Atom Analisti, Piyasada Daha İyi Bir Avantaj Bulmak İçin Fiyatın Gücünü ve Momentumunu Kullanan PA Fiyat Hareketi Göstergesidir. Gürültüleri ve Yanlış Sinyalleri Kaldırmaya ve Ticaret Potansiyelini Artırmaya Yardımcı Olan Gelişmiş Filtrelerle Donatılmıştır. Birden fazla katmanl
FX Power MT5 NG
Daniel Stein
5 (31)
FX Power: Daha Akıllı Ticaret Kararları için Para Birimlerinin Gücünü Analiz Edin Genel Bakış FX Power , her piyasa koşulunda başlıca para birimlerinin ve altının gerçek gücünü anlamak için vazgeçilmez bir araçtır. Güçlü para birimlerini alıp zayıf olanları satarak, FX Power ticaret kararlarınızı basitleştirir ve yüksek olasılıklı fırsatları ortaya çıkarır. İster trendlere sadık kalın ister Delta'nın aşırı değerlerini kullanarak tersine dönüşleri öngörün, bu araç ticaret tarzınıza mükemmel bir
Btmm state engine pro
Garry James Goodchild
5 (4)
BTMM State Engine Pro is a MetaTrader 5 indicator for traders who use the Beat The Market Maker approach: Asian session context, kill zone timing, level progression, peak formation detection, and a multi-pair scanner from a single chart. It combines cycle state logic with a built-in scanner dashboard so you do not need the same tool on many charts at once. What it does Draws the Asian session range; session times can follow broker server offset or be set in inputs. Tracks level progression (L
Tanıtım       Quantum Breakout PRO   , Breakout Bölgeleri ile ticaret yapma şeklinizi değiştiren çığır açan MQL5 Göstergesi! 13 yılı aşkın ticaret tecrübesine sahip deneyimli tüccarlardan oluşan bir ekip tarafından geliştirilmiştir.       Kuantum Breakout PRO       yenilikçi ve dinamik koparma bölgesi stratejisiyle ticaret yolculuğunuzu yeni zirvelere taşımak için tasarlanmıştır. Kuantum Breakout Göstergesi, size 5 kar hedefi bölgesi ile kırılma bölgelerinde sinyal okları ve kırılma kutusuna da
Bill Williams Advanced
Siarhei Vashchylka
5 (11)
Bill Williams Advanced is designed for automatic chart analysis using Bill Williams' "Profitunity" system. The indicator analyzes four timeframes at once. Manual (Be sure to read before purchasing) Advantages 1. Analyzes the chart using Bill Williams' "Profitunity" system. Signals are displayed in a table in the corner of the screen and on the price chart. 2. Finds all known AO and AC signals, as well as zone signals. Equipped with a trend filter based on the Alligator. 3. Finds "Divergence Bar
Berma Bands
Muhammad Elbermawi
5 (8)
Berma Bantları (BB'ler) göstergesi, piyasa trendlerini belirlemeyi ve bunlardan yararlanmayı amaçlayan yatırımcılar için değerli bir araçtır. Fiyat ile BB'ler arasındaki ilişkiyi analiz ederek, yatırımcılar bir piyasanın trend veya aralıklı fazda olup olmadığını ayırt edebilir. Daha fazla bilgi edinmek için [ Berma Home Blog ] adresini ziyaret edin. Berma Bantları üç belirgin çizgiden oluşur: Üst Berma Bandı, Orta Berma Bandı ve Alt Berma Bandı. Bu çizgiler fiyatın etrafına çizilir ve genel tren
Auto Optimized Parabolic RSI: Gelişmiş 3D Momentum Motoru Çoğu perakende indikatörü, piyasa volatilitesi değiştiği an çöken statik girdilere dayandığı için başarısız olur. Auto Optimized Parabolic RSI, kendi matematiksel avantajını sürekli olarak yeniden hesaplayarak "indikatör körelmesi" (indicator decay) sorununu çözer ve kurumsal düzeyde kantitatif adaptasyonu doğrudan MT5 terminalinize getirir. Temel Avantaj: Özel Bellek İçi (In-Memory) 3D Optimizasyon Standart otomatik optimize ediciler, te
Meridian Pro
Ottaviano De Cicco
5 (1)
Meridian Pro: Professional Multi-Timeframe Trend Matrix for MT5 Overview Meridian Pro is a multi-timeframe trend matrix by Merkava Labs that compresses directional state, strength, momentum condition and matrix agreement into one compact panel. One adaptive engine, applied consistently from M1 to W1. No per-symbol tuning. No indicator stacking. One structured readout across every asset and every timeframe. Launch Offer — Get Meridian Pro for USD 99 (introductory). Regular price: USD 149. 1. Why
Crystal Heikin Ashi Signals
Muhammad Jawad Shabir
5 (2)
Crystal Heikin Ashi Signals - Professional Trend & Signal Detection Indicator Advanced Heikin Ashi Visualization with Intelligent Signal System for Manual & Automated Trading Final Price: $149 ---------> Price goes up $10 after every 10 sales . Limited slots available — act fast . Overview Crystal Heikin Ashi Signals is a professional-grade MetaTrader 5 indicator that combines pure Heikin Ashi candle visualization with an advanced momentum-shift detection system. Designed for both manual traders
Market Structure Order Block Dashboard MT5, piyasa yapısını ve fiyatın ana tepki bölgelerini doğrudan grafik üzerinde okumak isteyen yatırımcılar için tasarlanmış bir MT5 göstergesidir. BOS, ChoCH, Order Blocks, Fair Value Gaps (FVG), Liquidity, Kill Zones, Volume Profile ve hızlı analiz için kompakt bir dashboard yapısını bir araya getirir. Bu gösterge, piyasa yapısını, ICT kavramlarını ve Smart Money kavramlarını karar verme çerçevesi olarak kullanan yatırımcılar için geliştirilmiştir. Trend d
IX Power MT5
Daniel Stein
4.92 (13)
IX Power: Endeksler, Emtialar, Kripto Paralar ve Forex Piyasaları için İçgörüler Genel Bakış IX Power , endeksler, emtialar, kripto paralar ve forex sembollerinin gücünü analiz etmek için tasarlanmış çok yönlü bir araçtır. FX Power , tüm kullanılabilir döviz çiftlerinin verilerini kullanarak döviz çiftleri için maksimum doğruluk sağlarken, IX Power yalnızca temel sembolün piyasa verilerine odaklanır. Bu, IX Power 'ı forex dışındaki piyasalar için ideal ve daha basit forex analizleri için güven
ARICoins
Temirlan Kdyrkhan
ARICoin is a powerful trading companion designed to generate high-probability entry signals with dynamic TP/SL/DP levels based on volatility. Built-in performance tracking shows win/loss stats, PP1/PP2 hits, and success rates all updated live. Key Features: Buy/Sell signals with adaptive volatility bands Real-time TP/SL/DP levels based on ATR Built-in MA Filter with optional ATR/StdDev volatility Performance stats panel (Success, Profit/Loss, PP1/PP2) Alerts via popup, sound, push, or email Cust
Meravith Scanner
Ivan Stefanov
5 (1)
MERAVITH SCANNER, MetaTrader 5 için profesyonel bir finansal piyasa göstergesidir ve birden fazla analiz aracını tek bir entegre sistemde birleştirir. Tüm hesaplamaları, özel hacim ağırlıklı ortalama fiyat (VWAP) metodolojisini kullanarak otomatik olarak gerçekleştirir ve subjektif yorumları tamamen ortadan kaldırır. Bu gösterge, tüm varlık sınıflarında (Forex, Hisseler, Endeksler, Emtialar, Kripto Paralar) ve M1’den Aylık’a kadar tüm zaman dilimlerinde çalışır. Temel prensip, fiyatın hacmi taki
Yazarın diğer ürünleri
The Extreme Spike PRT Indicator   is an effective tool for identifying   sharp market fluctuations .   It performs its calculations using the ATR (Average True Range) indicator and displays candles with extreme volatility in two categories:   primary spikes   and   secondary spikes , within the Metatrader platform oscillator window. This tool assists traders in detecting   intense price movements   and conducting more precise   analyses   based on these fluctuations. Time Frame 15-minute - 1-ho
The TMA Centered Bands Indicator for MT5 draws bands on the chart and shows the overall price trend. It displays three bands - the lower and upper boundaries of the channel and the median.   The bands are made up of moving averages, and each of them has an MA period. The name TMA comes from triangular moving averages, as the indicator draws triangular bands.   The price will fluctuate between these ranges whenever the trend changes direction, thus creating entry and exit points.   How to trade
FREE
The Channel Sgnals ProfRoboTrading Indicator for MT5 is an effective Forex trading tool designed to track market movements.   The MT5 signal point indicator effectively detects trend reversals after they have already occurred. This Indicator   is a fully automated technical tool that includes a number of parameters to track market trends.   It automatically examines the ever-changing price dynamics of the market, compares the information with earlier data and generates a trading signal. Because
FREE
Bollinger Bands Stop Indicator holds significant importance for traders navigating the complex world of financial markets. Its relevance lies in several key aspects. Firstly, it aids in trend identification. By analyzing price movements relative to the Bollinger Bands, traders can discern whether the market is in an uptrend, downtrend, or ranging phase. Secondly, the indicator provides valuable insights into market volatility. Wider bands indicate higher volatility, while narrower bands suggest
FREE
The Kalires Channel Indicator is a technical indicator used to evaluate trend direction and potential trading opportunities. This is a hybrid indicator that combines Kauffman Adaptive Moving Average (KAMA), linear regression and smoothing. The Kalires Channel Indicator consists of two lines: one central and two outer bands. The central line is a smoothed KAMA modified according to the direction of the trend. The outer bars represent two linear regression lines drawn above and below the center l
FREE
The TMA Centered Bands indicator for MT4 draws bands on the chart and reports the overall price trend, as well as gives arrows signals to buy and sell when the bar closes outside the channel. Unlike many TMAs, our version uses the calculation part of the algorithm without redrawing, and also adds the ability to select a symbol. The bands are made up of moving averages, and each of them has an MA period. The name TMA comes from triangular moving averages, as the indicator draws triangular bands
FREE
Our modernized version of the popular channel TMA_TRUE  indicator for MT4, which provides information on the main points of trend reversal and momentum exhaustion by drawing a channel on the chart, also draws arrows of signals for buy and sell. As a result, traders can identify bullish and bearish price reversal zones and BUY and SELL accordingly. This indicator works well on all instruments and on all Timeframes. This indicator is the basis of our Channel Trigger EA, which you can buy in MQL
FREE
The TrendChannelTracker Indicator is an innovative Forex trading tool. This indicator, which is based on the standard Stochastic Oscillator, provides traders with a unique and simplified method for observing market trends. In contrast to the traditional Stochastic Oscillator, which is shown at the bottom of the chart, the TrendChannelTracker Indicator is built into the price action itself. This removes the need for traders to continually switch their attention between the oscillator and the pri
FREE
Regression_Channel_mod Indicator that expands our standard linear regression channel by adding support and resistance lines. Easy to integrate into other indicators. The linear regression channel consists of several parallel lines equidistant from the upper and lower part of the linear regression trend line. The distance between the channel boundaries and the regression line is equal to the deviation of the maximum closing price from the regression line.
The TrendOscillator Indicator is an upgraded version of the traditional Stochastic Oscillator.   It comprises two lines: %K and %D.   The %K line represents the current market position.   In contrast, the %D line is a moving average of the %K line used to generate signals and identify potential entry or exit points. The good thing is the indicator works on all timeframes like the traditional Stochastic.   However, to avoid any false signals, applying the indicator on longer timeframes is better
FREE
The Forex Gangster Indicator allows you to determine the current trend. If the Forex Gangster Indicator line has moved below the price and turned blue, then you should open deals for an increase. If the Forex Gangster Indicator line has appeared above the price and turned red, then you should open deals for a decrease: The indicator is suitable for any time frames, but it needs to be supplemented with filtering indicators, since by itself it is late and does not have time to give an accurate si
FREE
The Red Dragons Support and Resistance Levels indicator automatically determines support and resistance levels using the proprietary algorithm based on historical and current data, so the levels are dynamic, which allows you to adjust trading targets based on the current price movement. For this reason, we use this indicator in our advisors, for example, Red Dragons, which you can purchase here: https://www.mql5.com/en/market/product/128713?source=Site +Market+MT4+New+Rating006 The panel also
FREE
This indicator works by plotting fractals on the chart as arrows that can be used as buy or sell signals. It is a great tool for both new and experienced traders as it provides a clear visual representation of the market and helps traders identify fractals. Although it repaints, it can be used quite effectively in conjunction with other tools to filter trading strategies. We use this indicator in this way in our Royal Fractals EA, which you can purchase on the MQL5 Market: https://www.mql5.com
FREE
The BandsFill Indicator is a modified Bollinger Bands with a colored cloud.   It has two adjustable parameters: Period Deviation The cloud is colored as follows: If the price crosses the upper band, the cloud is blue. If the price crosses the lower band, the cloud is pink.   Thanks to this, the BandsFill Indicator provides traders with an easy opportunity to detect various features and patterns in price dynamics that are invisible to the naked eye. Based on this information, traders can predict
FREE
This indicator works by plotting fractals on the chart as arrows that can be used as buy or sell signals. It is a great tool for both new and experienced traders as it provides a clear visual representation of the market and helps traders identify fractals. Although it repaints, it can be used quite effectively in conjunction with other tools to filter trading strategies. We use this indicator in this way in our RoyalFractals II Expert Advisor, which you can purchase on the MQL5 Market: https:
FREE
Moving Averages Divergence 3x3    Indicator     uses the crossover technique for signaling the market trend and the trade opportunities as well.     It applies 3 formats of the same indicator and allows them to plot the crossover signals which are interpreted as the trade signals along with the direction of the market trend. Moving Averages Divergence 3x3    Indicator   can be applied to trade all kinds of forex currency pairs within the financial markets.  Although, this indicator works well o
FREE
The Teamtrader Channel Stop indicator allows you to determine the current trend. If the Teamtrader Channel Stop indicator line has moved below the price and turned blue, then you should open deals for an increase. If the Teamtrader Channel Stop indicator line has appeared above the price and turned red, then you should open deals for a decrease: The indicator is suitable for any time frames, but it needs to be supplemented with filtering indicators, since by itself it is late and does not have
FREE
Forex Gangster PRT
Irina Cherkashina
FOREX GANGSTER is a unique Expert Advisor created by a professional prop trader and financial asset manager with many years of experience. This is a solution for those who strive for stable profits without constant control over each transaction or monitoring the work of a trading advisor. Created for optimal conservative trading and investing through exchange instruments with long-term regular profits and minimal risks. The Expert Advisor algorithm is based on a deep understanding of market pat
The Wolf Wave Finder Indicator is a popular indicator, that is useful in identifying potential trading opportunities.   The indicator works by recognizing the Wolf Wave pattern, which is a well-known pattern used by professional traders to identify potential areas of support and resistance.   The indicator is easy to use and provides traders with an easy way to identify potential trades.   The Wolf Wave Finder Indicator is a great tool for traders who are looking for a reliable and accurate way
This indicator is a fusion of the Parabolic SAR and Fibonacci indicators. Fibo is drawn on the last wave, at the peaks the indicator displays prices for convenience. Parabolic SAR helps to define the market trend and generates trends following trade signals.     On the other hand, Fibonacci plots the price retracement levels so that traders can determine a better and safer place to enter the market. Scalping with Parabolic SAR and Fibonacci Overview. For this strategy, in addition to our indica
This is an easy-to-set-up and easy-to-use Expert Advisor that will help you always have the necessary information about your trading account at hand, sending from MetaTrader 4 to you in Telegram: • Account drawdown • Number of open positions • Volume of open positions • Profit per day, week, month How to get an chat ID: - Chat with BotFather to create Bot and get API Token of Bot. If you had Bot, skip the step. - Chat with bot @userinfobot , then the bot will reply your ID. How to setu
The SYMBOL MANAGER symbol change indicator is an effective tool designed to enhance trading convenience and significantly simplify the trader's experience. This indicator allows users to switch seamlessly between currency pairs and timeframes within a single open window of the trading terminal. Importantly, when switching, the associated template, including indicators and current chart settings, is automatically duplicated, ensuring a consistent trading environment.
Morning Star PRT göstergesi sabah düz kırılma ilkesini kullanır. Gösterge sabah düz seviyelerini görüntüler ve olası hedefleri gösterir. Göstergeye ek bir Fibonacci seviyesi eklenmiştir ve ayrıca ayarlarda belirtilen her iki hedef seviyesinin ve gece düz seviyesinin kesişimi hakkında sesli uyarılar vardır. Morning Star PRT göstergesi gecenin sonunda bir gece düz kanalı ve yukarı ve aşağı iki Fibonacci fiyat seviyesi oluşturur. Bu seviyeler hem hedef hem de geri dönüş seviyeleri olarak düşünüle
Gösterge Arz ve Talep bölgeleri PRT– grafiğin arz ve talep bölgelerini işaretlemek için kullanılan özel bir araçtır. Gösterge, direnç/destek seviyelerini ve arz/talep bölgelerini vurgulayan grafikte çizgiler ve dikdörtgenler çizer. Kolaylık olması açısından, hem çizgiler hem de şekiller farklı renklerle boyanmıştır, böylece sinyaller birbirinden kolayca ayırt edilebilir. Gösterge yalnızca yeni seviyeleri, yani henüz kullanılmamış ve fiyatın henüz bunları aşmamış seviyeleri çizer. Hem yeni başla
Bu gösterge, grafik desenlerini belirlemek isteyen yatırımcılar için güçlü bir araçtır ve bunu işlem stratejilerine dahil etmenin sayısız faydası vardır. Bu araç, finansal piyasalardaki potansiyel eğilimleri ve geri dönüşleri etkili bir şekilde belirler ve işaret eder, böylece işlem karlılığını artırır. Gelişmiş algoritması sayesinde gösterge, piyasa verilerini doğru bir şekilde analiz edebilir ve yatırımcılara bilinçli kararlar almalarına yardımcı olabilecek değerli bilgiler sağlar. Bu gösterg
This universal expert advisor is based on our own Algorithm, which is based on effective and time-tested Elliot Wave Theory.  This   expert advisor   is ideal for working both on a flat and during sharp or protracted trend movements (thanks to the Martingale method, according to which averaging positions are opened in accordance with the multiplier and distance set in the settings for accepting a new signal). ATTENTION! CAREFULLY STUDY THE OPERATING PRINCIPLE AND AVAILABLE SETTINGS OF THE EXPER
This is the automatic price spike signal indicator for MT4. Plots advance alerts on potential breakouts/pullbacks. Suits forex, stocks & crypto trading strategies. This is a perfect indicator for reversal traders. A spike often indicates a turn-around moment. The best way to use that gauge is to apply it to your favourite trading system as a filter. 這是 MT4 的自動價格飆升訊號指示器。繪製有關潛在突破/回調的預先警報。適合外匯、股票和加密貨幣交易策略。 對於反轉交易者來說,這是一個完美的指標。尖峰通常表示轉變時刻。使用該指標的最佳方法是將其作為過濾器應用到您最喜歡的交易系統中
Parabolik SAR ve Destek/Direnç Seviyeleri, forex ticaretinde potansiyel trend dönüşlerini ve giriş ve çıkış noktalarını belirlemek için kullanılan bir teknik analiz göstergesi olmakla kalmayıp aynı zamanda hazır bir otonom ticaret stratejisidir. Gösterge, grafiğe dinamik destek ve direnç seviyeleri ekleyerek PSAR göstergesini temel alır ve bu da yatırımcıların piyasanın potansiyel olarak tersine dönebileceği önemli fiyat seviyelerini belirlemesine yardımcı olabilir. Yatırımcılar bu göstergeyi
ProfRobotrading'in All Market Channels göstergesi, ekranda oluşan tüm işlem kanallarını otomatik olarak oluşturur ve görüntüler. Bu gösterge, mevcut tüm kanal stratejilerinde işlem yapmak için çok uygundur ve tüm enstrümanlara ve zaman dilimlerine uygulanabilir. Ekran görüntüsüne bakın - size daha fazlasını anlatacaktır :) ProfRoboTrading web sitemizde daha fazla bilgi mevcuttur. The All Market Channels indicator from ProfRobotrading automatically builds and displays all formed trading chann
Bu bir Bollinger Bantları Sıkıştırma göstergesidir. Volatilite sıkıştırmasını ve "bastırılmış momentumun" serbest bırakılmasını tespit eder. Herhangi bir belirli işlem girişiyle çakıştığında kullanılabilir - serbest bırakılan volatilite, makul bir kar elde etme olasılığının daha yüksek olması anlamına gelir. Ayrıca, zayıflığı veya gücü simgeleyen renkli bantlara sahip bir histogram ve sıfır çizgisi geçişi de vardır. Bu nedenle, bu gösterge hem işlem stratejileri içindeki diğer göstergelerle birl
Filtrele:
Değerlendirme yok
Değerlendirmeye yanıt