• Genel bakış
  • İncelemeler
  • Yorumlar

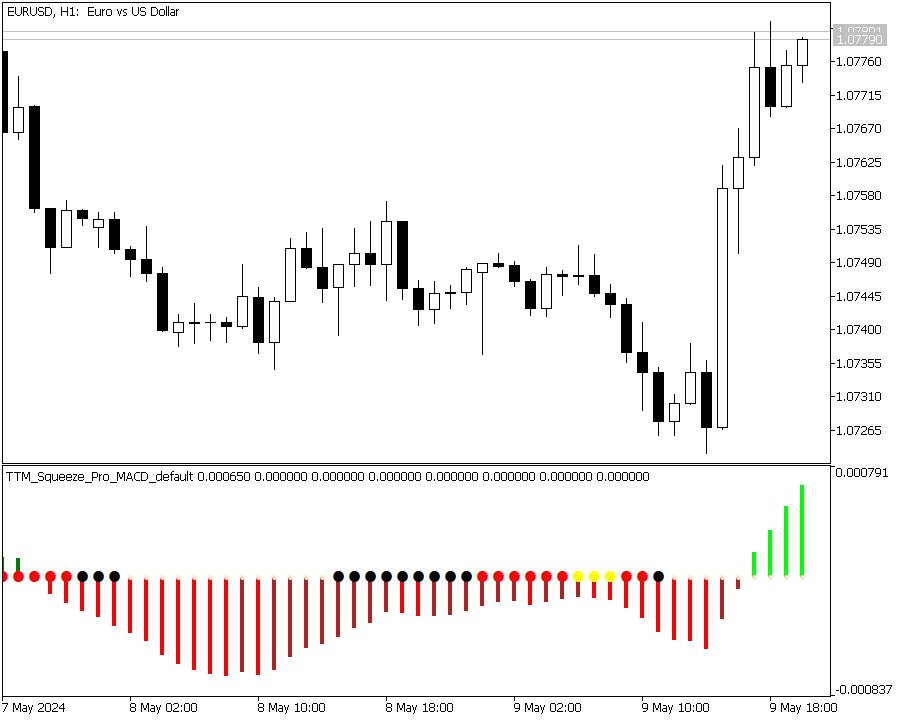
John Carters TTM Squeeze Pro with MACD

This is actually just a combination of 3 classic TTM_Squeeze indicators, nothing special. As I know exactly this is implemented in original TTM_Squeeze PRO indicator. It shows strong, middle and weak squeeze.

If someone interested, TTM_Squeeze is not completely John Carter's invention. Concept of squeeze is commonly known as well as the method of squeeze search using Bollinger Bands and Kelthner Channels.

How to use

As always there is a lot of variations. For example here is simple strategy

  • Use charts H1 and higher. Better to use Daily charts. Never use use 1min, 5min charts.
  • Wait for 3 red dots
  • After 3 red dots appeared, wait for the bar closing upper or lower of Bollinger Bands. The bar should close above/below band, not touch it.
  • If dot on that bar is not red anymore, but black or white, enter in market
  • Place your stop on 3 times 14th period ATR. Another option is to place your stop on the opposite band.
  • Start to move your stop when opposite band become equal to you entry price
  • Trail your stop with opposite band
  • Make decision of taking profits on 1:1 risk reward ratio
  • Price can have deep pullbacks and can return to your entry price. Do not exit from the position, exit with profit or on the stop loss.
You can read more about squeeze trading method in John Bollinger's book.


Önerilen ürünler
Free automatic Fibonacci is an indicator that automatically plots a Fibonacci retracement based on the number of bars you select on the BarsToScan setting in the indicator. The Fibonacci is automatically updated in real time as new highest and lowest values appears amongst the selected bars. You can select which level values to be displayed in the indicator settings. You can also select the color of the levels thus enabling the trader to be able to attach the indicator several times with differe
FREE
Trend Yakalayıcı: Alarm İndikatörü ile Trend Yakalayıcı Stratejisi, piyasa trendlerini ve potansiyel giriş ve çıkış noktalarını belirlemede yardımcı olan çok yönlü bir teknik analiz aracıdır. Piyasa koşullarına uyum sağlayarak trend yönünün net görsel temsili için dinamik bir Trend Yakalayıcı Stratejisi sunar. Tüccarlar tercihlerine ve risk toleranslarına göre parametreleri özelleştirebilirler. Gösterge, trendleri tanımlamaya yardımcı olur, potansiyel ters dönüşleri sinyaller, trailing stop m
FREE
Show Pips for MT5
Roman Podpora
4.61 (18)
This information indicator will be useful for those who always want to be aware of the current situation on the account. - More useful indicators The indicator displays data such as profit in points, percentage and currency, as well as the spread for the current pair and the time until the bar closes on the current timeframe. There are several options for placing the information line on the chart: - To the right of the price (runs behind the price); - As a comment (in the upper left corner
FREE
WH Price Wave Pattern MT5
Wissam Hussein
3.82 (11)
Fiyat Dalga Modeli   MT5 --(ABCD Modeli)--   hoş geldiniz ABCD modeli, teknik analiz dünyasında güçlü ve yaygın olarak kullanılan bir ticaret modelidir. Tüccarların piyasadaki potansiyel alım ve satım fırsatlarını belirlemek için kullandıkları uyumlu bir fiyat modelidir. ABCD modeliyle, tüccarlar potansiyel fiyat hareketlerini tahmin edebilir ve alım satımlara ne zaman girip çıkacakları konusunda bilinçli kararlar verebilir. EA Sürümü: Price Wave  EA MT5 MT4 Sürümü :   Price Wave Pattern
FREE
Indicator measures strength of each currency in your list. Main idea: It simply iterates through all combinations of pairs and adds difference between open and close in percent. Parameters: List of currencies - what currencies will be calculated (maximum is 8) Calculation type - from which data will be strength calculated Calculation data input - used as input related to calculation type Symbol suffix - used in case of suffix on symbols, e.g: when your symbols look like EURUSDm, EURUSDmicro et
FREE
PZ Penta O MT5
PZ TRADING SLU
4 (6)
The Penta-O is a 6-point retracement harmonacci pattern which usually precedes big market movements. Penta-O patterns can expand and repaint quite a bit. To make things easier this indicator implements a twist: it waits for a donchian breakout in the right direction before signaling the trade. The end result is an otherwise repainting indicator with a very reliable trading signal. The donchian breakout period is entered as an input. [ Installation Guide | Update Guide | Troubleshooting | FAQ | A
FREE
High Low Open Close
Alexandre Borela
4.97 (36)
Bu projeyi seviyorsanız, 5 yıldız incelemesi bırakın. instagram'da izleyin: borelatech Bu gösterge açık, yüksek, düşük ve belirtilen fiyatlar için çizer Dönem ve belirli bir zaman bölgesi için ayarlanabilir. Bunlar birçok kurumsal ve profesyonel tarafından görünen önemli seviyelerdir. tüccarlar ve daha fazla olabileceği yerleri bilmeniz için yararlı olabilir Aktif. Mevcut dönemler şunlardır: Önceki gün. Önceki Hafta. Önceki Ay. Previous Quarter. Önceki yıl. Veya: Mevcut gün. Hafta. Şimdi Ay.
FREE
Value Chart Candlesticks
Flavio Javier Jarabeck
4.67 (9)
The idea of a Value Chart indicator was presented in the very good book I read back in 2020 , " Dynamic Trading Indicators: Winning with Value Charts and Price Action Profile ", from the authors Mark Helweg and David Stendahl. The idea is simple and the result is pure genius: Present candlestick Price analysis in a detrended way! HOW TO READ THIS INDICATOR Look for Overbought and Oversold levels. Of course, you will need to test the settings a lot to find the "correct" one for your approach.
FREE
What is this indicator? This indicator is the MACD (Moving Average Convergence/Divergence) supporting Virtual Trading mode of  Knots Compositor . When the mode is turned on, the indicator will be recalculated based on the displayed candlesticks. When the mode is turned off, the indicator will be recalculated based on the original chart candlesticks. Types of the applied price - Close - Open - High - Low - Median Price (HL/2) - Typical Price (HLC/3) - Weighted Price (HLCC/4) KC-Indicators
FREE
TradeQL
Abdiel Aviles Jimenez
The TradeQL Indicator is a customizable tool that highlights specific trading patterns on candlestick charts. Users can define patterns through TradeQL queries, which the indicator then applies to the chart, visually representing matches and captured groups. Ideal for identifying complex trade setups in real-time. TradeQL queries are specified using the TradeQL Language. See https://github.com/abdielou/tradeql for more details. This language is expressed as a regular expression. The language a
FREE
Pivot Point Fibo RSJ, Fibonacci oranlarını kullanarak günün destek ve direnç çizgilerini izleyen bir göstergedir. Bu muhteşem gösterge, Fibonacci oranlarını kullanarak Pivot Point üzerinden 7 seviyeye kadar destek ve direnç oluşturur. Fiyatların, bir operasyonun olası giriş/çıkış noktalarını algılamanın mümkün olduğu bu destek ve direncin her bir düzeyine uyması harika. Özellikleri 7 seviyeye kadar destek ve 7 seviye direnç Seviyelerin renklerini ayrı ayrı ayarlayın Girişler Pivot Tipi
FREE
LT Donchian Channel
Thiago Duarte
4.75 (4)
Donchian Channel is an indicator created by Richard Donchian. It is formed by taking the highest high and the lowest low of the last specified period in candles. The area between high and low is the channel for the chosen period. Its configuration is simple. It is possible to have the average between the upper and lower lines, plus you have alerts when price hits one side. If you have any questions or find any bugs, please contact me. Enjoy!
FREE
What is this indicator? This indicator is the RSI (Relative Strength Index) supporting Virtual Trading mode of  Knots Compositor . When the mode is turned on, the indicator will be recalculated based on the displayed candlesticks. When the mode is turned off, the indicator will be recalculated based on the original chart candlesticks. Types of the applied price - Close - Open - High - Low - Median Price (HL/2) - Typical Price (HLC/3) - Weighted Price (HLCC/4) KC-Indicators -   KC-MA   (M
FREE
The indicator identifies when a divergence occurs between price and an indicator or oscillator. It identifies both regular and hidden divergences. Combined with your own rules and techniques, this indicator will allow you to create (or enhance) your own powerful system. Features Can detect divergences for the following oscillators/indicators:   MACD, OsMA, Stochastics, RSI, CCI, RVI, Awesome, ADX, ATR, OBV, Composite index, MFI and Momentum. Only one oscillator/indicator can be selected. Draws
FREE
Bar Color Trend
Germano Chagas
4.5 (10)
Combining the best of Price Action , Directional Movement , and Divergence/Convergence analysis, Candle Color Trend is a easy and reliable way to identify trend direction. The indicator automatically paints the candles according to the assumption that an uptrend is defined by prices that form a series of higher highs and higher lows. In contrast, a downtrend is defined by prices that form a series of lower highs and lower lows. Additionally, ADX Wilder indicator is used to measure trend weakness
FREE
Cumulative Delta MT5
Evgeny Shevtsov
4.48 (58)
The indicator analyzes the volume scale and splits it into two components - seller volumes and buyer volumes, and also calculates the delta and cumulative delta. The indicator does not flicker or redraw, its calculation and plotting are performed fairly quickly, while using the data from the smaller (relative to the current) periods. The indicator operation modes can be switched using the Mode input variable: Buy - display only the buyer volumes. Sell - display only the seller volumes. BuySell -
FREE
Follow The Line MT5
Oliver Gideon Amofa Appiah
4.4 (30)
This indicator obeys the popular maxim that: "THE TREND IS YOUR FRIEND" It paints a GREEN line for BUY and also paints a RED line for SELL. (you can change the colors). It gives alarms and alerts of all kinds. IT DOES NOT REPAINT and can be used for all currency pairs and timeframes. Yes, as easy and simple as that. Even a newbie can use it to make great and reliable trades. NB: For best results, get my other premium indicators for more powerful and reliable signals. Get them here: https://www.m
FREE
Are you tired of drawing trendlines every time you're analyzing charts? Or perhaps you would like more consistency in your technical analysis. Then this is for you. This indicator will draw trend lines automatically when dropped on a chart. How it works Works similar to standard deviation channel found on mt4 and mt5. It has 2 parameters: 1. Starting Bar 2. Number of bars for calculation The   starting bar   is the bar which drawing of the trend lines will begin, while the   number of bars for c
FREE
PZ Pivot Points MT5
PZ TRADING SLU
4.95 (22)
This indicator displays pivot points in the chart, including historical vales, and supports many calculation modes for Pivot Points and S/R levels. [ Installation Guide | Update Guide | Troubleshooting | FAQ | All Products ] It plots historical levels for backtesting purposes It allows you to select the reference timeframe It implements different Pivot Point calculation modes It implements different SR calculation modes It implements customizable colors and sizes Calculation Modes The indi
FREE
Cybertrade Keltner Channels - MT5 Created by Chester Keltner, this is a volatility indicator used by technical analysis. It is possible to follow the trend of financial asset prices and generate support and resistance patterns. In addition, envelopes are a way of tracking volatility in order to identify opportunities to buy and sell these assets. It works on periods longer than the period visible on the chart. All values ​​are available in the form of buffers to simplify possible automations.
FREE
Important Lines
Terence Gronowski
4.88 (26)
This indicator displays Pivot-Lines, preday high and low, preday close and the minimum and maximum of the previous hour. You just have to put this single indicator to the chart to have all these important lines, no need to setup many single indicators. Why certain lines are important Preday high and low : These are watched by traders who trade in a daily chart. Very often, if price climbs over or falls under a preday low/high there is an acceleration in buying/selling. It is a breakout out of
FREE
What is this indicator? This indicator is the Stochastic Oscillator supporting Virtual Trading mode of   Knots Compositor . When the mode is turned on, the indicator will be recalculated based on the displayed candlesticks. When the mode is turned off, the indicator will be recalculated based on the original chart candlesticks. KC-Indicators -   KC-MA   (Moving Average) -   KC-ENV   (Envelopes) -   KC-BB   (Bollinger Bands) -   KC-ADX   (Average Directional Movement Index) -   KC-MACD   (Mo
FREE
Market Profile 3 ForexArby com
Hussien Abdeltwab Hussien Ryad
4.17 (12)
Market Profile 3 MetaTrader 5 indicator  version 4.70— is a classic Market Profile implementation that can show the price density over time, outlining the most important price levels, value area, and control value of a given trading session. This indicator can be attached to timeframes between M1 and D1 and will show the Market Profile for daily, weekly, monthly, or even intraday sessions. Lower timeframes offer higher precision. Higher timeframes are recommended for better visibility. It is als
FREE
Automatic Trendlines
Pasi Hakamaki
4.64 (50)
The indicator draws trendlines on chart. This indicator has six inputs. User can specify alternative labels for both lines. If multiple instances of the indicator are used, the labels must differ. User can set width and color of the lines and depth which specifies what significant peaks should be used. For example, Depth=10 sets trendlines using the current peaks and valleys that have at least 10 bars to the right and to the left and that have highs/lows less/greater than the peak's high/low. In
FREE
This is a buyer and seller aggression indicator that analyzes the shape of each candle and project this data in a histogram form. There are 4 histograms in one. On the front we have two: Upper - Buyer force. Lower - Seller force. At the background we also have two histogram, both with same color. They measure the combined strenght of buyers and sellers. This histograms can be turned off in Input Parameters. It is also possible to have the real or tick volume to help on this force measurement. IN
FREE
ContiStat restricted - Free DEMO version of the ContiStat indicator Free version of the indicator is ment as DEMO of full paid version. Full functionality is available, however The indicator work only on M30 chart period . Find the ContiStat indicator for full functionality Brief description The ContiStat indicator calculate statistic frequency of green (up) and red (down) movement in the chart and determine movement dynamics (silver curve). There are two key parameters to understand the Conti
FREE
Spike Catch Pro
Amani Fungo
4.17 (6)
Spike Catch Pro 22:03 release updates Advanced engine for searching trade entries in all Boom and Crash pairs (300,500 and 1000) Programmed strategies improvements Mx_Spikes (to combine Mxd,Mxc and Mxe), Tx_Spikes,   RegularSpikes,   Litho_System,   Dx_System,   Md_System,   MaCross,   Omx_Entry(OP),  Atx1_Spikes(OP),   Oxc_Retracement (AT),M_PullBack(AT) we have added an arrow on strategy identification, this will help also in the visual manual backtesting of the included strategies and see h
FREE
PZ Three Drives MT5
PZ TRADING SLU
3.11 (9)
This indicator finds Three Drives patterns. The Three Drives pattern is a 6-point reversal pattern characterised by a series of higher highs or lower lows that complete at a 127% or 161.8% Fibonacci extension. It signals that the market is exhausted and a reversal can happen. [ Installation Guide | Update Guide | Troubleshooting | FAQ | All Products ] Customizable pattern sizes Customizable colors and sizes Customizable breakout periods Customizable 1-2-3 and 0-A-B ratios It implements visua
FREE
This indicator is a zero-lag indicator and displays  strength of trend change . True Trend  Oscillator Pro works best in combination with True Trend Moving Average Pro that displays exact trend as is. Oscillator value is exact price change in given direction of the trend. True Trend Moving Average Pro: https://www.mql5.com/en/market/product/103586 If you set PERIOD input parameter to 1 this indicator becomes a sharpshooter for binary options. Developers can use True Trend Oscillator in E
FREE
Donchian Pro
Paulo Henrique Faquineli Garcia
5 (2)
The Donchian Channel Channels are among the most popular tools of technical analysis, as they visually convey to the analyst the limits within which most price movement tends to occur. Channel users know that valuable information can be obtained at any time, whether prices are in the central region of a band or close to one of the border lines. One of the best known techniques to explore these concepts is Bollinger Bands. However, John Bollinger was not the only one to research the applicatio
FREE
Bu ürünün alıcıları ayrıca şunları da satın alıyor
Öncelikle belirtmek gerekir ki bu Ticaret Göstergesi Yeniden Çizim Yapmaz, Gecikmez ve Gecikme Göstermez, bu da hem manuel hem de robot ticareti için ideal hale getirir. Kullanıcı kılavuzu: ayarlar, girişler ve strateji. Atom Analisti, Piyasada Daha İyi Bir Avantaj Bulmak İçin Fiyatın Gücünü ve Momentumunu Kullanan PA Fiyat Hareketi Göstergesidir. Gürültüleri ve Yanlış Sinyalleri Kaldırmaya ve Ticaret Potansiyelini Artırmaya Yardımcı Olan Gelişmiş Filtrelerle Donatılmıştır. Birden fazla katmanl
Öncelikle, bu Ticaret Sistemi'nin Non-Repainting, Non-Redrawing ve Non-Lagging Göstergesi olduğunu vurgulamak önemlidir, bu da hem manuel hem de robot ticareti için ideal hale getirir. Online kurs, kılavuz ve ön ayarları indir. "Smart Trend Trading System MT5", yeni ve deneyimli tüccarlar için özelleştirilmiş kapsamlı bir ticaret çözümüdür. 10'dan fazla premium göstergeyi birleştiriyor ve 7'den fazla sağlam ticaret stratejisi sunuyor, bu da çeşitli piyasa koşulları için esnek bir seçim yapar. Tr
Gold Stuff mt5
Vasiliy Strukov
4.89 (173)
Gold Stuff mt5, özellikle altın için tasarlanmış bir trend göstergesidir ve herhangi bir finansal enstrümanda da kullanılabilir. Gösterge yeniden çizilmez ve gecikmez. Önerilen zaman dilimi H1. Ayarları ve kişisel bir bonusu almak için satın alma işleminden hemen sonra benimle iletişime geçin!   AYARLAR Ok Çiz - açık kapalı. grafik üzerinde oklar çizmek. Uyarılar - sesli uyarılar kapalı. E-posta bildirimi - açık kapalı. E-posta Bildirimleri. Puch bildirimi - açık kapalı. Push bildirimleri
Reversal First Impulse levels (RFI)      INSTRUCTIONS        RUS       -       ENG              R ecommended to use with an indicator   -   TREND PRO -  Version MT4                 A key element in trading is zones or levels from which decisions to buy or sell a trading instrument are made. Despite attempts by major players to conceal their presence in the market, they inevitably leave traces. Our task was to learn how to identify these traces and interpret them correctly. Main functions:: Di
Quantum Trend Sniper
Bogdan Ion Puscasu
5 (39)
Tanıtım       Kuantum Trend Keskin Nişancı Göstergesi   , trend tersine dönmeleri belirleme ve ticaret yapma şeklinizi değiştiren çığır açan MQL5 Göstergesi! 13 yılı aşkın ticaret tecrübesine sahip deneyimli tüccarlardan oluşan bir ekip tarafından geliştirilmiştir.       Kuantum Trend Keskin Nişancı Göstergesi       trend dönüşlerini son derece yüksek doğrulukla belirlemenin yenilikçi yolu ile ticaret yolculuğunuzu yeni zirvelere taşımak için tasarlanmıştır. ***Kuantum Trend Keskin Nişancı Gö
RelicusRoad Pro MT5
Relicus LLC
4.82 (22)
Şimdi 147 $ (birkaç güncellemeden sonra 499 $ 'a yükseliyor) - Sınırsız Hesaplar (PC'ler veya Mac'ler) RelicusRoad Kullanım Kılavuzu + Eğitim Videoları + Özel Discord Grubuna Erişim + VIP Durumu PİYASAYA BAKMAK İÇİN YENİ BİR YOL RelicusRoad, forex, vadeli işlemler, kripto para birimleri, hisse senetleri ve endeksler için dünyanın en güçlü ticaret göstergesidir ve yatırımcılara kârlı kalmaları için ihtiyaç duydukları tüm bilgileri ve araçları sağlar. Başlangıç ​​seviyesinden ileri seviyey
TPSpro TRENDPRO  - is a trend indicator that automatically analyzes the market and provides information about the trend and each of its changes, as well as giving signals for entering trades without redrawing! The indicator uses each candle, analyzing them separately. referring to different impulses - up or down impulse. Exact entry points into transactions for currencies, crypto, metals, stocks, indices!  -  Version MT4               DETAILED DESCRIPTION               R ecommended to use with
Trend Screener Pro MT5
STE S.S.COMPANY
4.87 (62)
Trend Göstergesi, Trend Alım Satım ve Filtreleme için Çığır Açan Benzersiz Çözüm, Tüm Önemli Trend Özellikleriyle Tek Bir Araç İçinde Yerleştirildi! Forex, emtialar, kripto para birimleri, endeksler ve hisse senetleri gibi tüm sembollerde/araçlarda kullanılabilen %100 yeniden boyamayan çoklu zaman çerçevesi ve Çoklu para birimi göstergesidir. Trend Screener, grafikte noktalarla ok trend sinyalleri sağlayan etkili bir trend trend göstergesidir. Trend analizörü göstergesinde bulunan özellikler: 1.
74% discount for the next 10 buyers (original price $605): 1 left Get a 50% bonus by buying (or even renting) any of our products. After buying (or renting), send a message for more information. 3 Indicators in 1 indicator Strategy based on price action Made specifically for the best forex currency pairs Can be used in the best time frame of the market at a very reasonable price This indicator is basically 3 different indicatos . But we have combined these 3 indicators in 1 indicator so th
Bill Williams Advanced
Siarhei Vashchylka
5 (4)
Bill Williams Advanced is designed for automatic chart analysis using Bill Williams' "Profitunity" system. The indicator analyzes four timeframes at once. Manual (Be sure to read before purchasing) Advantages 1. Automatically analyzes the chart using the "Profitunity" system of Bill Williams. The found signals are placed in a table in the corner of the screen. 2. Equipped with a trend filter based on the Alligator indicator. Most of the system signals are recommended to be used only accordi
FX Volume MT5
Daniel Stein
4.94 (17)
Sabah Brifingimiz aracılığıyla ayrıntılar ve ekran görüntüleri ile günlük piyasa güncellemenizi alın burada mql5 ve on Telegram ! FX Volume, bir brokerin bakış açısından piyasa duyarlılığı hakkında GERÇEK bir fikir veren İLK ve TEK hacim göstergesidir. COT raporlarından çok daha hızlı bir şekilde, brokerlar gibi kurumsal piyasa katılımcılarının Forex piyasasında nasıl konumlandıklarına dair harika bilgiler sağlar. Bu bilgileri doğrudan grafiğinizde görmek, ticaretiniz için gerçek oyun değiştir
Öncelikle, bu Ticaret Aracının Non-Repainting, Non-Redrawing ve Non-Lagging Gösterge olduğunu vurgulamakta fayda var, bu da onu profesyonel ticaret için ideal hale getiriyor. Çevrimiçi kurs, kullanıcı kılavuzu ve demo. Akıllı Fiyat Hareketi Kavramları Göstergesi, hem yeni hem de deneyimli tüccarlar için çok güçlü bir araçtır. İleri ticaret fikirlerini, Inner Circle Trader Analizi ve Smart Money Concepts Ticaret Stratejileri gibi 20'den fazla kullanışlı göstergeyi bir araya getirerek bir aray
AW Trend Predictor MT5
AW Trading Software Limited
4.77 (56)
Tek bir sistemde trend ve kırılma seviyelerinin kombinasyonu. Gelişmiş bir gösterge algoritması piyasa gürültüsünü filtreler, trendi, giriş noktalarını ve olası çıkış seviyelerini belirler. Gösterge sinyalleri, sinyal geçmişinin etkinliğini gösteren en uygun enstrümanların seçilmesine izin veren bir istatistiksel modüle kaydedilir. Gösterge Kâr Al ve Zararı Durdur işaretlerini hesaplar. Kılavuz ve talimatlar ->   BURAYA   / MT4 versiyonu ->   BURAYA Gösterge ile nasıl ticaret yapılır: Trend Pre
ICT, SMC, SMART MONEY CONCEPTS, SMART MONEY, Smart Money Concept, Support and Resistance, Trend Analysis, Price Action, Market Structure, Order Blocks, BOS/CHoCH,   Breaker Blocks ,  Momentum Shift,   Supply&Demand Zone/Order Blocks , Strong Imbalance,   HH/LL/HL/LH,    Fair Value Gap, FVG,  Premium  &   Discount   Zones, Fibonacci Retracement, OTE, Buy Side Liquidity, Sell Side Liquidity, BSL/SSL Taken, Equal Highs & Lows, MTF Dashboard, Multiple Time Frame, BigBar, HTF OB, HTF Market Structure
Was: $249  Now: $99   Market Profile defines a number of day types that can help the trader to determine market behaviour. A key feature is the Value Area, representing the range of price action where 70% of trading took place. Understanding the Value Area can give traders valuable insight into market direction and establish the higher odds trade. It is an excellent addition to any system you may be using. Inspired by Jim Dalton’s book “Mind Over Markets”, this indicator is designed to suit the
Advanced Supply Demand MT5
Bernhard Schweigert
4.53 (15)
Herhangi bir Acemi veya Uzman Tüccar için En İyi Çözüm! Bu gösterge benzersiz, yüksek kaliteli ve uygun fiyatlı bir ticaret aracıdır çünkü bir dizi tescilli özelliği ve yeni bir formülü bir araya getirdik. Bu güncelleme ile çift zaman dilimi dilimlerini gösterebileceksiniz. Yalnızca daha yüksek bir TF gösteremeyeceksiniz, aynı zamanda TF grafiğini ve ARTIK daha yüksek TF'yi de gösterebileceksiniz: YUVARLAK BÖLGELERİ GÖSTERMEK. Tüm Arz Talebi tüccarları buna bayılacak. :) Önemli Bilgiler Açıkland
FxaccurateLS
Shiv Raj Kumawat
WHY IS OUR FXACCCURATE LS MT5 THE PROFITABLE ? PROTECT YOUR CAPITAL WITH RISK MANAGEMENT Gives entry, stop and target levels from time to time. It finds Trading opportunities by analyzing what the price is doing during established trends. POWERFUL INDICATOR FOR A RELIABLE STRATEGIES We have made these indicators with a lot of years of hard work. It is made at a very advanced level. Established trends provide dozens of trading opportunities, but most trend indicators completely ignore them!
Tanıtım       Quantum Breakout PRO   , Breakout Bölgeleri ile ticaret yapma şeklinizi değiştiren çığır açan MQL5 Göstergesi! 13 yılı aşkın ticaret tecrübesine sahip deneyimli tüccarlardan oluşan bir ekip tarafından geliştirilmiştir.       Kuantum Breakout PRO       yenilikçi ve dinamik koparma bölgesi stratejisiyle ticaret yolculuğunuzu yeni zirvelere taşımak için tasarlanmıştır. Kuantum Breakout Göstergesi, size 5 kar hedefi bölgesi ile kırılma bölgelerinde sinyal okları ve kırılma kutusuna
Blahtech Supply Demand MT5
Blahtech Limited
4.57 (14)
Was: $299  Now: $99   Supply Demand uses previous price action to identify potential imbalances between buyers and sellers. The key is to identify the better odds zones, not just the untouched ones. Blahtech Supply Demand indicator delivers functionality previously unavailable on any trading platform. This 4-in-1 indicator not only highlights the higher probability zones using a multi-criteria strength engine, but also combines it with multi-timeframe trend analysis, previously confirmed swings
Gartley Hunter Multi
Siarhei Vashchylka
5 (6)
Gartley Hunter Multi - An indicator for searching for harmonic patterns simultaneously on dozens of trading instruments and on all classic timeframes: (m1, m5, m15, m30, H1, H4, D1, Wk, Mn). Manual (Be sure to read before purchasing) | Version for MT4 Advantages 1. Patterns: Gartley, Butterfly, Shark, Crab. Bat, Alternate Bat, Deep Crab, Cypher 2. Simultaneous search for patterns on dozens of trading instruments and on all classic timeframes 3. Search for patterns of all possible sizes. Fr
Black Dragon indicator mt5
Ramil Minniakhmetov
4.82 (57)
Trend algılama göstergesi, herhangi bir stratejiyi tamamlayacak ve bağımsız bir araç olarak da kullanılabilir. ÖNEMLİ! Talimatlar ve bonus almak için satın alma işleminden hemen sonra benimle iletişime geçin!   Faydalar Kullanımı kolay; grafiği gereksiz bilgilerle aşırı yüklemez. Herhangi bir strateji için filtre olarak kullanma yeteneği. Hem kar elde etmek hem de zararı durdurmayı ayarlamak için kullanılabilen, yerleşik dinamik cupport ve direnç seviyeleri içerir. Mum kapandıktan sonra g
ADR Ters Çevirme Göstergesi, normal ortalama günlük aralığına göre fiyatın şu anda nerede işlem gördüğünü bir bakışta size gösterir. Fiyat, ortalama aralığı ve seçtiğiniz seviyenin üzerindeki seviyeleri aştığında, açılır pencere, e-posta veya push yoluyla anında uyarılar alacaksınız, böylece hızlı bir şekilde geri çekilmelere ve geri dönüşlere atlayabilirsiniz. Gösterge, grafikte ortalama günlük aralık uç noktalarında yatay çizgiler ve ayrıca fiyatları aşan matematiksel olasılıkları olan seviye
Golden Gate Algo MT5
James David Lane
4 (6)
CHRISTMAS İÇİN %40 İNDİRİM! 1 OCAK'TA FİYATI $250'YE YÜKSELECEK! GoldenGate Entries Tanıtımı: Keskin Kenarlı Bir Ticaret Çözümü! GoldenGate Entries (GGE) ile ticarette devrim niteliğinde bir yaklaşım keşfedin. GGE, ticaret deneyiminizi yükseltmek amacıyla tasarlanmış gelişmiş bir gösterge olup kullanıcılara ticaret kararlarında hassasiyet ve güven sağlamak için kapsamlı bir özellik seti sunar. Çiftler: Herhangi biri (FX - Emtia - Hisse Senetleri - Hisse Senetleri - Kripto) Zaman Çerçeve
Auto Order Block with break of structure based on ICT and Smart Money Concepts (SMC) Futures Break of Structure ( BoS )             Order block ( OB )            Higher time frame Order block / Point of Interest ( POI )    shown on current chart           Fair value Gap ( FVG ) / Imbalance   -  MTF      ( Multi Time Frame )    HH/LL/HL/LH  -  MTF      ( Multi Time Frame )  Choch  MTF      ( Multi Time Frame )  Volume Imbalance     ,  MTF          vIMB Gap’s Equal High / Low’s     ,
Quantum Heiken Ashi PRO MT5
Bogdan Ion Puscasu
4.5 (8)
Quantum Heiken Ashi PRO ile   tanışın Pazar eğilimleri hakkında net bilgiler sağlamak üzere tasarlanan Heiken Ashi mumları, gürültüyü filtreleme ve yanlış sinyalleri ortadan kaldırma yetenekleriyle ünlüdür. Kafa karıştırıcı fiyat dalgalanmalarına veda edin ve daha sorunsuz, daha güvenilir bir grafik sunumuna merhaba deyin. Quantum Heiken Ashi PRO'yu gerçekten benzersiz kılan şey, geleneksel şamdan verilerini okunması kolay renkli çubuklara dönüştüren yenilikçi formülüdür. Kırmızı ve yeşil çubukl
Grafiğinizde otomatik olarak destek ve direnç seviyeleri PLUS itici mum boşlukları çizin, böylece fiyatın nereye gidebileceğini ve / veya potansiyel olarak tersine dönebileceğini görebilirsiniz. Bu gösterge, web sitemde (The Market Structure Trader) öğretilen pozisyon ticareti metodolojisinin bir parçası olarak kullanılmak üzere tasarlanmıştır ve hedefleme ve potansiyel girişler için temel bilgileri görüntüler. MT4 Version:  https://www.mql5.com/en/market/product/97246/ Göstergede 2 TEMEL öze
Trend Line Map Pro MT5
STE S.S.COMPANY
4.67 (9)
Trend Line Map indicator is an addons for   Trend Screener Indicator . It's working as a scanner for all signals generated by Trend screener ( Trend Line Signals ) . It's a Trend Line Scanner based on Trend Screener Indicator.  If you don't have Trend Screener Pro Indicator,   the Trend Line Map Pro will not work.     LIMITED TIME OFFER : Trend Line Map Indicator is available for only 50 $ and lifetime. ( Original price 125$ ) By accessing to our MQL5 Blog,  you can find all our premium indica
FX Power MT5 NG
Daniel Stein
5 (5)
Sabah Brifingimiz burada mql5 ve on Telegram! FX Power MT5 NG , uzun zamandır çok popüler olan döviz gücü ölçerimiz FX Power'ın yeni neslidir. Peki bu yeni nesil güç ölçer ne sunuyor? Orijinal FX Power hakkında sevdiğiniz her şey PLUS GOLD/XAU güç analizi Daha da hassas hesaplama sonuçları Ayrı ayrı yapılandırılabilir analiz dönemleri Daha da iyi performans için özelleştirilebilir hesaplama limiti Özel çokluDaha fazlasını görmek isteyenler için örnek ayarlar Her grafikte en sevdiğiniz renkler i
Yeni Başlayanlar veya Uzman Tüccarlar için En İyi Çözüm! Bu Gösterge benzersiz, yüksek kaliteli ve uygun fiyatlı bir ticaret aracıdır çünkü bir dizi tescilli özellik ve yeni bir formül ekledik. Sadece BİR grafik ile 28 Forex çifti için Döviz Gücünü okuyabilirsiniz! Yeni bir trendin veya scalping fırsatının tam tetik noktasını belirleyebildiğiniz için ticaretinizin nasıl gelişeceğini hayal edin? Kullanım kılavuzu:   buraya tıklayın Bu ilk olan, orijinal! Değersiz bir özenti klonunu almayın
IX Power MT5
Daniel Stein
5 (3)
IX Power   nihayet FX Power'ın rakipsiz hassasiyetini Forex dışı sembollere getiriyor. En sevdiğiniz endeksler, hisse senetleri, emtialar, ETF'ler ve hatta kripto para birimlerindeki kısa, orta ve uzun vadeli eğilimlerin yoğunluğunu doğru bir şekilde belirler. Terminalinizin sunduğu   her şeyi analiz   edebilirsiniz. Deneyin ve işlem yaparken   zamanlamanızın   nasıl   önemli ölçüde iyileştiğini   deneyimleyin. IX Power Temel Özellikler 100 hassas, yeniden boyanmayan hesaplama sonuçları -
Yazarın diğer ürünleri
This indicator created based on original John Carter's TTM_Squeeze indicator and represents "squeeze" of the market which can be followed (or maybe not) by significant moves. Original indicator prints black dots when Bollinger Bands are inside Kelthner Channels and exactly this implemented in this custom version. Instead of original implementation as momentum indicator MACD indicator with standard settings 12-26-9 is being used. Mainly, the indicator is useful for understanding when it's better
FREE
The indicator shows Jake Bernstein's MAC (Moving Average Channel) System signals ---------------------------------------- System assumes several types of entering in trade, in this indicator only one type implemented - on closing of second trigger bar. It is recommended to start using this indicator together with Jake Bernstein's free lessons  https://www.youtube.com/@JakeatMBH/videos Arrow shows signal bar - enter on closing or on opening of the next bar, cross - stop level, dot - minimum profi
FREE
The same indicator as here Скачайте Технический индикатор 'John Carters TTM Squeeze with MACD Multitimeframe' для MetaTrader 5 в магазине MetaTrader Market (mql5.com) , but instead of MACD, Bill Williams' AO (Awesome Oscillator) is used. It goes well with a sleeping Alligator to determine periods of "compression-calm", which may be followed by significant movement. It is useful to use an indicator from a higher timeframe (coefficient 5 or 6) to determine the possible direction of a breakout.
FREE
Mitimom
Danil Poletavkin
The indicator is based on Robert Miner's methodology described in his book "High probability trading strategies" and displays signals along with momentum of 2 timeframes. A Stochastic oscillator is used as a momentum indicator. The settings speak for themselves period_1 is the current timeframe, 'current' period_2 is indicated - the senior timeframe is 4 or 5 times larger than the current one. For example, if the current one is 5 minutes, then the older one will be 20 minutes The rest of the
FREE
The same indicator that is published here  https://www.mql5.com/en/market/product/105645?source=Site+Market+My+Products+Page , but instead of the MACD, a Stochastic Oscillator is used.  The indicator can be useful for searching for the possibility of opening a position on the Momuntum of multiple timeframes - a method described by Robert Miner in his book "High probability trading strategies". The settings speak for themselves Period - the timeframe for which the indicator is calculated.
FREE
AO on Bars
Danil Poletavkin
Bill's Williams Awesome Oscillator signal from his book "Trading chaos 2nd edition" on bars.  Normally this signal is being used for 2nd entry after 1st entry by Divergent bar ----------------------------------------------------------------------------------------------------------- Please make shure that you understand Bill's Williams system before trade with real money using this indicator. Ideal entry setup is: 1) Divergence with zero line AO crossing 2) Divergent bar on top of the final 5th
FREE
Market scanner based on the indicator published here  Download the 'John Carters TTM Squeeze with MACD' Technical Indicator for MetaTrader 5 in MetaTrader Market (mql5.com) .  Only the instruments that are in the Market Watch window are scanned. Maximum number of scanning tools up to 5000. The scan timeframe is selected from the timeframe panel of the terminal. To use it, open any chart and attach the Expert Advisor to the chart, the 'Search' button will appear in the upper left corner. When you
FREE
The same indicator as here  https://www.mql5.com/ru/market/product/105089?source=Site+Market+My+Products+Page  but with timeframe change possibility. It is convinient to see picture from different timeframes in the single chart. When using multiple timeframes, it is recommended (A.Elder "The new trading for a living") to adhere to a coefficient of 5 or 6. That is, the two older timeframes for a 5-minute chart will be 30 minutes and 3 hours.
FREE
Divergent Bar
Danil Poletavkin
Bill Williams'ın angülasyonla tersine çevrilmiş sapkın barı. Yeşil çizgi ile çubuğun üstü / alt kısmı arasındaki açı, temelde Justin Williams'ın güncellenmiş yönergelerine uygun olarak köşe olarak kullanılır. Timsah Dudak çizgisinin kesiştiği andan itibaren 85 ve 21 bar açısının varsayılan ayarları oldukça iyi çalışıyor. Bu göstergeyi gerçek ticarette kullanırsanız - gün içinde ticaret yapmanızı şiddetle tavsiye etmiyorum, günlük grafikleri kullanın. Sinyal EURUSD, US500, BTCUSD ve DE40'DA te
FREE
Market scanner based on the indicator published here Download the 'Divergent Bar' Technical Indicator for MetaTrader 5 in MetaTrader Market (mql5.com) . Only the instruments that are in the Market Watch window are scanned. Maximum number of scanning tools up to 5000. The scan timeframe is selected from the timeframe panel of the terminal. To use it, open any chart and attach the Expert Advisor to the chart, the 'Search' button will appear in the upper left corner. When you click on the button, t
FREE
Filtrele:
İnceleme yok
İncelemeye yanıt