Comprehensive Moving Average MT5
- Göstergeler
- Sürüm: 1.71
- Güncellendi: 6 Aralık 2024

Profesyonel Kapsamlı Hareketli Ortalama göstergemizle EMA, SMA, WMA ve çok daha fazlası dahil olmak üzere çok çeşitli hareketli ortalamalara erişin. Teknik analizinizi, benzersiz ticaret tarzınıza uyacak şekilde hareketli ortalamaların mükemmel kombinasyonu ile özelleştirin / MT4 Sürümü
Özellikler
- Farklı ayarlarla iki MA'yı etkinleştirme imkanı.
- Grafik ayarlarını özelleştirme imkanı.
- Çapraz MA'lara veya MA'larla çaprazlanan fiyata bağlı olarak mum çubuklarının rengini değiştirme imkanı.
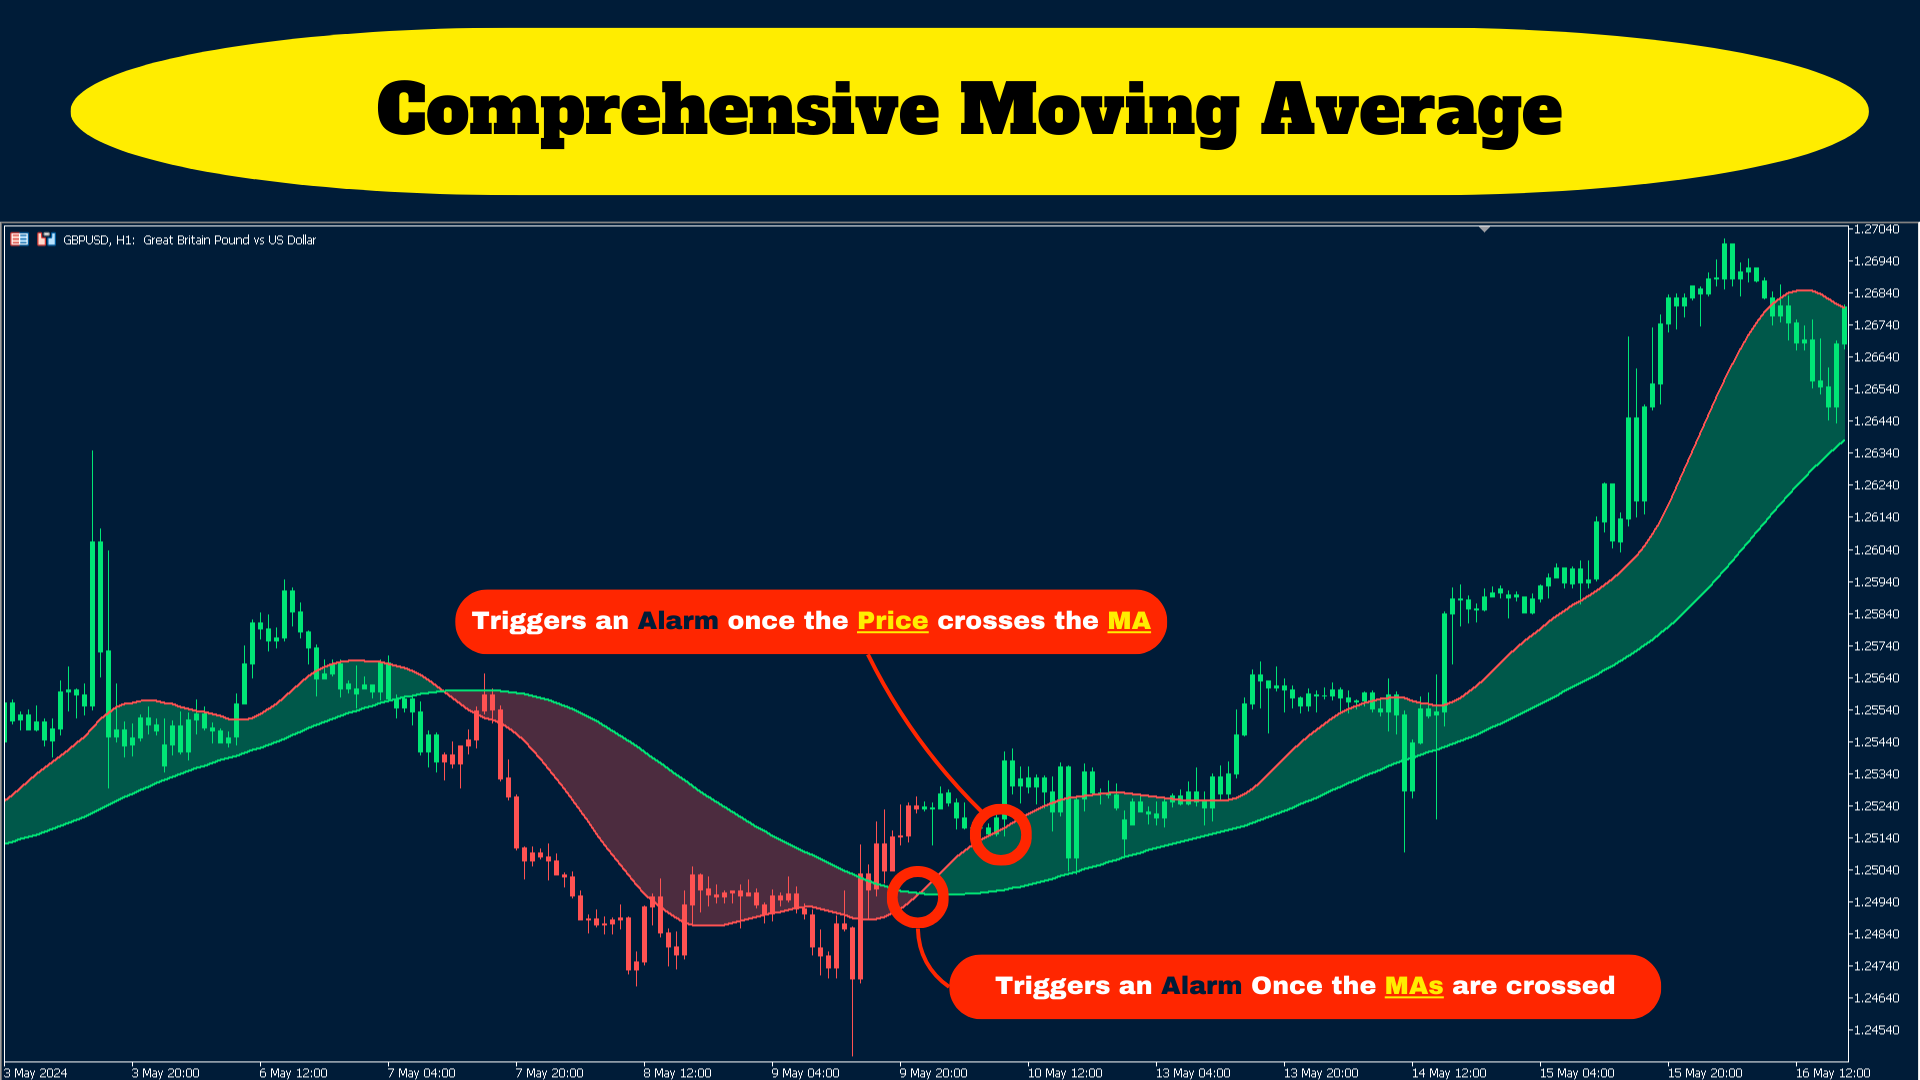
- MA'ların kesişmesi veya fiyatın MA'larla kesişmesi durumunda uyarı gönderme.
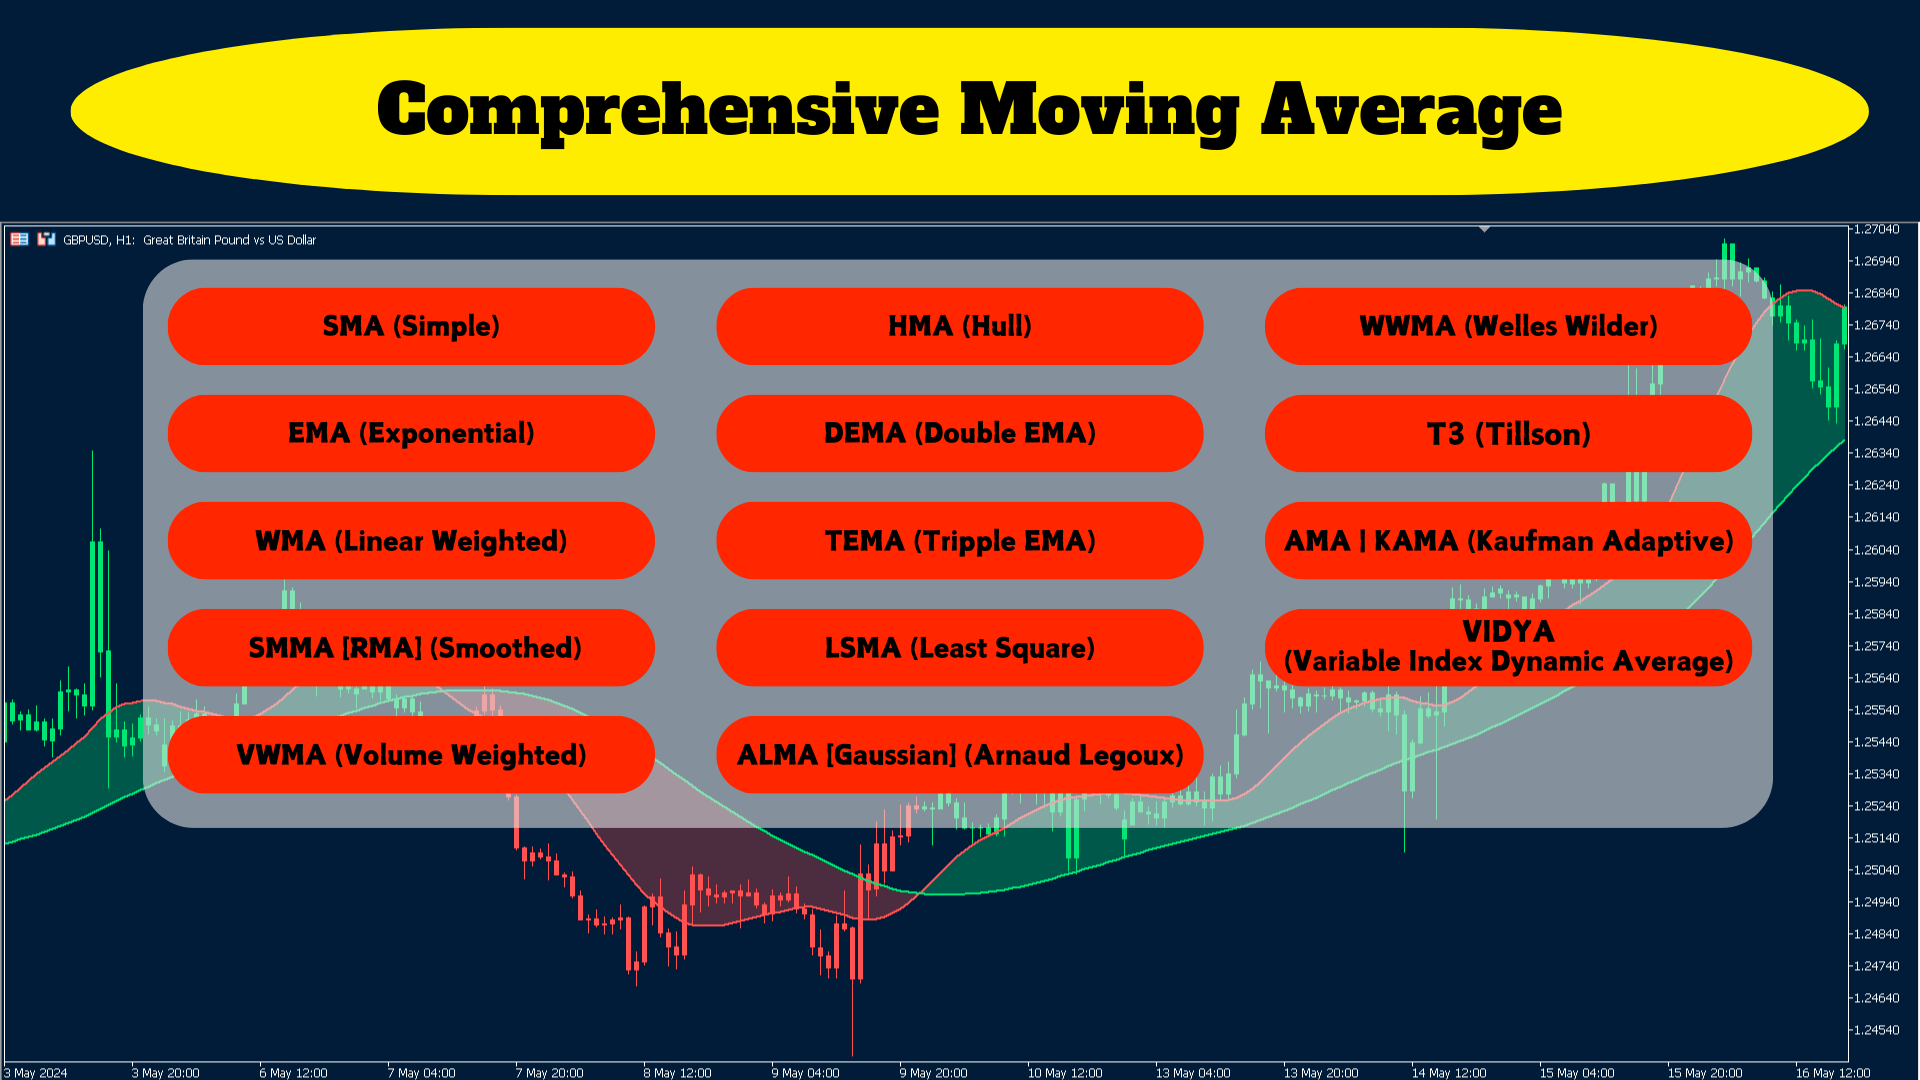
Hareketli ortalama türleri şunları içerir
- SMA --------------------> (Simple)
- EMA --------------------> (Exponential)
- SMMA [RMA] ----------> (Smoothed)
- WMA -------------------> (Linear Weighted)
- DEMA ------------------> (Double EMA)
- TEMA ------------------> (Triple EMA)
- VWMA -----------------> (Volume Weighted)
- HMA -------------------> (Hull)
- LSMA ------------------> (Least Square)
- ALMA [Gaussian] ----> (Arnaud Legoux)
- WWMA ----------------> (Wilder's MA)
Ana girişler
- Length: Bu parametre, hareketli ortalamayı hesaplamak için kullanılan dönem sayısını ifade eder. Örneğin, uzunluğu 20 olarak ayarlarsanız, hareketli ortalama son 20 dönemdeki veriler kullanılarak hesaplanacaktır.
- Offset: ofset, hareketli ortalamayı taşımak istediğiniz ileri veya geri dönem sayısını ifade eder. Örneğin, ofseti 2 olarak ayarlarsanız, hareketli ortalama grafikte iki dönem ileriye kaydırılır.
- SIGMA (ALMA mode): ALMA (Arnaud Legoux Hareketli Ortalama) modunda SIGMA, hareketli ortalamanın giriş verilerindeki değişikliklere duyarlılığını kontrol eden yumuşatma faktörünü temsil eder. Daha yüksek bir SIGMA değeri daha yumuşak bir hareketli ortalama üretirken, daha düşük bir değer hareketli ortalamanın giriş verilerindeki değişikliklere daha hızlı tep ki vermesine neden olur.
- MAs cross each other alert: bu giriş, seçilen iki hareketli ortalama birbirini kestiğinde bir uyarıyı tetikler. Bu seçeneği, daha kısa dönemli hareketli ortalama daha uzun dönemli hareketli ortalamanın üstüne veya altına geçtiğinde bir bildirim almak için ayarlayabilirsiniz, bu da trendde bir değişiklik olduğunu gösterebilir.
- Price cross MAs alert: Bu özellik, bir varlığın fiyatı seçilen bir veya daha fazla hareketli ortalamanın üstüne veya altına geçtiğinde bir uyarı oluşturur. Bu tür bir uyarı, hareketli ortalamalarla fiyat etkileşimine dayalı olarak giriş veya çıkış noktalarını belirlemek için yararlı olabilir.
- Pop-up alert: MT5 terminaline uyarı
- Email alert: e-posta uyarısı
- Push notification alert: telefona uyarı
- Alerts after candle close: Bu ayar, belirli bir koşul karşılandığında uyarıların hemen tetiklenip tetiklenmeyeceğini veya mevcut mum kapanana kadar ertelenip ertelenmeyeceğini belirler. Uyarıları mum kapandıktan sonra tetiklemeyi seçmek, tüm mum çubuğu dönemi boyunca fiyat hareketini değerlendirmenize olanak tanıdığından, bir karar vermeden önce bir alım satım sinyalinin geçerliliğini doğrulamaya yardımcı olabilir.
*Diğer girdiler renklerin ve çizgilerin özelliklerinin kişiselleştirilmesiyle ilgilidir*


Хороший индикатор, очень удобно по нему делать входы!