 MetaTrader 5
 Uzmanlar
 Göstergeler
 Kütüphaneler
 Yardımcı programlar
 Widget'lar
 Kurallar
YouTube'dan Mağaza ile ilgili öğretici videoları izleyin
Bir alım-satım robotu veya gösterge nasıl satın alınır?
Uzman Danışmanınızı
sanal sunucuda çalıştırın
sanal sunucuda çalıştırın
Satın almadan önce göstergeyi/alım-satım robotunu test edin
Mağazada kazanç sağlamak ister misiniz?
Satış için bir ürün nasıl sunulur?
MetaTrader 5 için Teknik Göstergeler - 166
 Teknik göstergelerden gelen sinyaller, borsa ve Forex piyasalarında işlemler açılması ve kapatılmasında çok önemli bir rol oynar. Göstergeler, fiyat değişikliklerini tahmin etmeyi amaçlayan, finansal sembol fiyatının matematiksel dönüşümüdür.
Piyasa davranışını daha iyi tahmin etmek ve bundan kar elde etmek için teknik göstergeleri test edin.

Liquidity Sweep Reclaim Atlas Liquidity Sweep Reclaim Atlas is a MetaTrader 5 price action indicator that identifies potential liquidity sweeps around confirmed swing highs and swing lows. It highlights candles that move beyond an established swing level and close back inside it, helping traders examine breakout rejection and price reclaim behavior on their charts. The indicator also offers optional follow-through confirmation, configurable volatility and wick filters, active swing reference lev

Heikin-Ashi'nin verebileceği en temiz trend okuması, bütün izleme listenizde. Smoothed Heikin Ashi Scanner çift yumuşatılmış mumu yirmi sekize kadar sembol ve dört zaman diliminde çalıştırır, tabloyu en son ne döndüyse ona göre sıralar ve davranmadan önce mumun gövdesini görebilmeniz için grafiği altta tutar. Her 10 satın almada fiyat 10 $ artar. Smoothed Heikin Ashi Scanner tek dosyada iki üründür. Birincisi, önünüzdeki grafiğe çizilen Smoothed Heikin Ashi'nin kendisidir: yumuşatılmış kapanış,

Bir tablo, yirmi sekiz sembol ve güvenilecek kadar sakin bir momentum okuması. SMI Ergodic Scanner Blau'nun çift yumuşatılmış endeksini sembol başına dört zaman diliminde çalıştırır, bir kesişime seviyelerin ötesinde olup olmadığına göre derece verir ve kesişimi gözle denetleyebilmeniz için osilatörü tablonun altında tutar. Her 10 satın almada fiyat 10 $ artar. SMI Ergodic Scanner tek dosyada iki üründür. Birincisi, bu grafiğin kendi penceresindeki SMI Ergodic endeksinin kendisidir: endeks, siny

Erken dönüşler, bütün izleme listesinde bir kerede bulunur. Schaff Trend Cycle Scanner Doug Schaff'ın çevrimini yirmi sekize kadar sembol ve dört zaman diliminde çalıştırır, her dönüşe bölgenin ne kadar derininde başladığına göre derece verir ve işlemden önce dönüşü görebilmeniz için osilatörü tablonun altında tutar. Her 10 satın almada fiyat 10 $ artar. Schaff Trend Cycle Scanner tek dosyada iki üründür. Birincisi, bu grafiğin kendi penceresindeki Schaff Trend Cycle'ın kendisidir: çevrim çizgis
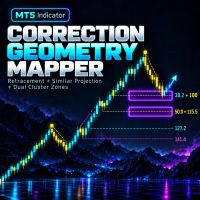
ToolForge Correction Geometry Mapper is a manual chart-analysis indicator for MetaTrader 5. It combines two measurements: a Fibonacci retracement of a selected price movement and a projected similar correction based on a reference correction selected by the trader.
When an enabled retracement level and an enabled similar-correction projection fall within the configured distance, the indicator draws a purple analysis zone. This zone shows where the two measurements overlap. It is intended as an

Bu göstergenin amacı MetaTrader 5 grafiğinde, işlemlerinizin sonuçlarını gösteren bir panel görüntüler. Veriler hesabın işlem geçmişinden alınır; işlem yapamaz. Şu soruları yanıtlar: Bugün, dün, evvelsi gün, ay içinde ve yıl içinde ne kadar kazandım veya kaybettim? Hangi paritelerde kârdayım, hangilerinde zarardayım? Hangi saatlerde (brokerin sunucu saatine göre) işlemlerim kâr getiriyor, hangi saatlerde zarar getiriyor? Maksimum drawdown ne kadardı? Birçok paritede aynı anda Uzman Danışman (EA

ALYAS Market Sentiment ALYAS Market Sentiment is a lightweight real-time market sentiment indicator for MetaTrader 5, designed to provide a quick visual overview of the current bullish and bearish pressure on the chart. Instead of relying on a single technical indicator, ALYAS Market Sentiment combines several market factors into one weighted sentiment score and displays the result in a simple Buy / Sell percentage bar . Key Features Multi-Factor Market Analysis The indicator combines six differ

All in One Trading Tool — Multi-Indicator Trading Assistant All in One Trading Tool is a comprehensive MetaTrader 5 indicator that combines several popular technical analysis tools into one convenient and easy-to-use interface. Instead of adding multiple indicators separately to your chart, this tool allows you to control EMA, Market Structure, Momentum, RSI, MACD, ADX, and ATR from a single interactive panel. Key Features EMA Group Display five Exponential Moving Averages directly on the mai

See at a glance where you are in the trading day. QuantEdge Sessions & Levels draws the Asia, London and New York sessions, the levels every trader watches, and the breakouts of the Asian range - with arrows that never repaint.
Sessions done right - Asia, London and New York boxes from their high to their low, with the size in pips - Each session is set in the local time of its city (Tokyo, London, New York): summer and winter time changes are handled automatically, including the weeks when Eur

FRACTAL BREAKOUT SCANNER DASHBOARD PRO MT5 - MULTI-PAIR & MULTI-TIMEFRAME ALGORITHMIC SCANNER WITH DYNAMIC ATR SL/TP & 16-LAYER INSTITUTIONAL FILTER MATRIX
PRODUCT SPECIFICATION & ARCHITECTURE OVERVIEW Product Name : Fractal Breakout Scanner Dashboard Pro MT5 Platform : MetaTrader 5 (MT5) Desktop Client Architecture ️ Product Type : Multi-As

MACD LEVEL 0 SCANNER DASHBOARD PRO MT5 Institutional Multi-Currency & Multi-Timeframe Momentum Scanner Dynamic Volatility ATR Stop Loss & Dual Take Profit Target Engine (1:1 & 1:2 R:R) 16 Modular Institutional Confluence Filters | 100% Strict Non-Repainting Architecture Interactive HUD Command Center with 1-Click Chart Switch, Drag & Drop, and Live Sorter
PRODUCT SPECIFICATIONS Product Type: Multi-Asset Dashboard Sca

MV Support & Resistance (SNR) Indicator MT5 The Support & Resistance (SNR) Indicator helps traders identify important price levels where the market may experience a price reversal, rejection, or breakout. Support and resistance levels are useful for understanding market structure, identifying potential entry opportunities, and planning trading strategies. Understanding Support & Resistance Green Line – Resistance Resistance is a price level where selling pressure may increase, potentially cau

Pattern Oracle is an all-in-one chart pattern engine for MetaTrader. It scans three zigzag levels at once, finds more than 30 harmonic, chart, continuation and reversal patterns, scores every setup and draws a complete trade plan with entry, stop-loss and two take-profit levels. A built-in teaching mode explains every pattern right on the chart. Pivots are only used once they are confirmed and every decision is made on a closed bar, so signals do not repaint . Patterns detected Reversal : Double

Quantum Edge is a machine-learning trend and signal indicator for MetaTrader. It combines a Lorentzian-distance k-nearest-neighbours classifier, a rational-quadratic kernel regression cloud and a multi-timeframe trend filter into one clean chart tool, then turns the result into clear, tiered BUY and SELL setups with ready-made stop-loss and three take-profit levels. Every signal is calculated on closed bars only . Once a label appears on the chart it stays exactly where it is: no repainting, no

LQ NEWS SCANNER — GOLD IMPACT & HISTORICAL EDGE Understand the news. Read the reaction. Discover the edge. Economic releases can create some of the most volatile moments in the Gold market. But knowing when the news is released is only part of the picture. Understanding its potential implications and examining how Gold has reacted to similar events can provide valuable context for your trading decisions. LQ News Scanner brings economic news monitoring, fundamental interpretation and historical

Ultimate Gold Scalper Ultimate Gold Scalper is a MetaTrader 5 indicator designed to present structured short-term XAUUSD trading setups directly on the M1 and M5 chart. It combines multi-timeframe market filtering with clear entry, stop-loss, and take-profit visualization. If the indicator does not appear on your chart, simply right click anywhere on the MT5 chart screen and select Refresh
Key Features BUY and SELL setup detection Clearly marked Entry, Stop Loss, and Take Profit levels Fixed 1:

BuySell Breakeven – sıfırda nerede çıkacağınızı tam olarak bilin Aynı sembolde birden fazla açık işleminiz olduğunda (farklı fiyatlarda alışlar ve satışlar, swap ve komisyonla birlikte) basit bir soruyu yanıtlamak zordur: "Şimdi her şeyi kapatırsam, hangi fiyatta başa baş çıkarım?" BuySell Breakeven bu soruyu grafikteki tek ve net bir çizgiyle yanıtlar ve yeni bir işlem açmadan önce bu çizginin nereye kayacağını görmenizi sağlar. NE YAPAR Breakeven çizgisi (turuncu): tüm işlemlerinizi aynı anda

How many CRT opportunities are missed while you are watching another chart or timeframe? The Candle Range Theory Indicator monitors three configurable timeframes simultaneously and brings qualifying bullish and bearish CRT setups directly to your current chart. Spend less time switching between charts and more time evaluating structured trading opportunities.

MT5 için "Major_Trend_Histogram" Kripto_Forex Göstergesi, Yeniden Boyama Yok. - Gerçekten büyük trendleri yakalamak için tasarlanmış Major_Trend_Histogram göstergesi. - Gösterge 2 renkte olabilir: Düşüş trendi için Pembe, yükseliş trendi için Yeşil (renkler değiştirilebilir). - Başlangıç aşamalarındaki trendleri tespit eder - standart bir hareketli ortalamadan çok daha verimlidir. - Major_Trend_Histogram, diğer tüm işlem yöntemleriyle birleştirilebilir: Fiyat Hareketi, VSA ve diğer göstergeler.

Mega MNFM MT5
Mega MNFM brings ten technical readings, a seven-timeframe trend map, regional session clocks and account-deal statistics into one MetaTrader 5 dashboard.
Technical dashboard RSI, MACD histogram, Stochastic, EMA trend, ADX, Bollinger Bands, an asset technical Fear & Greed proxy, an indicative synthetic dollar basket, ATR rank and OBV flow. Readings use completed candles. The timeframe map covers M1, M5, M15, M30, H1, H4 and D1. The dashboard includes a directional summary, trend

Volume Anomaly Candle Radar — MT5 Indicator Volume Anomaly Candle Radar is a price-action and volume analysis indicator for MetaTrader 5. It compares each completed candle's trading activity and price structure with a rolling baseline of older candles, helping traders identify unusually active directional moves and high-activity candles with limited price movement. Instead of treating every volume spike as a trading signal, the indicator separates three observable market conditions and displays

THV Camarilla Pivot MT5 – Reversal, Breakout & Target Levels
Overview THV Camarilla Pivot MT5 is a technical indicator that automatically calculates and displays Camarilla Pivot levels on your MetaTrader 5 chart. Based on the previous candle of the selected timeframe, the indicator plots eight key levels: H3, H4, H5, H6, L3, L4, L5, and L6. These levels help traders identify potential reversal zones, breakout areas, and price targets. The indicator also provides customizable line colors, styles

MT5 için "MFI Hızı" Kripto Forex Göstergesi, Yeniden Boyanma Yok. - Bu göstergenin hesaplanması fizik denklemlerine dayanmaktadır. MFI Hızı, MFI'nin birinci türevidir. - Money_Flow_Index (MFI), aşırı satım ve aşırı alım bölgelerini belirlemek için fiyat ve hacim verilerini kullanan teknik bir osilatördür. - MFI Hızı, ana trend yönünde momentum girişlerini scalping yapmak için iyidir. - Uygun trend göstergesiyle, örneğin standart EMA (resimlerdeki gibi) ile birlikte kullanın. - MFI Hızı gösterge

THV SMC Plus MT5 – Smart Money Concepts & Multi-Timeframe Analysis
Overview THV SMC Plus MT5 is a comprehensive Smart Money Concepts (SMC) indicator designed to help traders analyze market structure, identify potential liquidity zones, and recognize high-probability trading setups directly on MetaTrader 5. The indicator combines multiple price-action and institutional trading concepts into one customizable tool, including Break of Structure (BOS), Change of Character (CHoCH), Order Blocks (OB)

Inside Bar Breakout Retest Radar
Inside Bar Breakout Retest Radar is a price-action indicator for MetaTrader 5. It identifies completed inside candles, keeps the original mother bar boundaries fixed, and tracks a setup through a candle-close breakout and an optional first retest.
The indicator is designed for traders who study consolidation and the reaction of price around previously established levels. It shows chart events rather than placing orders.
Features
- Inside bar detection using

️ UTS Prime Zones — The Ultimate Multi-Timeframe Support & Resistance Engine UTS Prime Zones is an advanced, institutional-grade indicator that automatically maps out the most critical Support and Resistance zones across two different timeframes simultaneously . Stop drawing lines by hand. Stop guessing where the market will reverse. UTS Prime Zones uses a sophisticated fractal and ATR-based algorithm to identify high-probability "zones" (areas, not just single lines) where price is highly l

Inversion FVG, Fair Value Gap'leri (3 mumluk dengesizlikler) bulur ve bunların başarısız olduğu anı işler. Bir mumun gövdesi boşluğun ötesinde kapandığında boşluk "ters çevrilir" ve destek ya da direnç olur. Fiyat geri test edip reddedildiğinde gösterge, hazır Giriş, Stop Loss, TP1 ve TP2 seviyeleriyle bir ok çizer.
Nasıl çalışır 1. Yükseliş ya da düşüş FVG'si tespit edilir ve ham bölge olarak çizilir. 2. Bir mum gövdesinin bölgenin ötesinde kapanması bölgeyi ters çevirir. 3. İlk geri test + r

Elliott Wave Auto Count labels Elliott waves automatically on four degrees at the same time: the base degree and the three degrees above it. It follows the rules and guidelines of "Elliott Wave Principle" (Frost & Prechter). For the current wave it also shows a price x time target zone and an invalidation level.
HOW IT WORKS 1. Swings: five ATR(100)-based zigzags. Each higher degree uses a larger swing threshold. The finest zigzag is hidden and is used only to count the sub-waves inside each l

Neuron Chart is a complete charting workspace for MetaTrader 5 from Neuron Systems. It turns the standard chart into a modern, web-style workspace: a top toolbar, a drawing toolbar on the left, a panel bar on the right, indicator panes inside the chart, price alerts, bar replay, a watchlist, a screener, the economic calendar and more, all on the chart you already use. It is an indicator for chart analysis only: it draws on the chart, it does not place, modify or close trades, it does not send or

Zone Risk Planner turns support and resistance zones into a complete trade plan: where to enter, where to place the stop loss (SL), where the take profit (TP) goes and how many lots match your risk. It also shows the risk of your whole account, the market regime on several timeframes and a multi-symbol scanner, all in one indicator.
It is a planning and risk-management tool. It does not give buy or sell signals and it does not open, modify or close trades.
Support and resistance zones
- Calcu

Dow Structure MTF shows the Dow theory trend structure of five timeframes at the same time, using the pullback low / rally high approach that is common among Japanese traders. For each timeframe you see whether the trend is up, down or range, which price would change it, and how far the current price is from that level. Only closed bars are used, so a confirmed result never changes afterwards (no repaint).
WHAT YOU SEE - Table of five timeframes (M15, H1, H4, D1, W1 by default, all changeable)

Fibo Price Time Zones combines Fibonacci price levels with Fibonacci time targets and draws them on the chart as boxes (price x time zones). It helps you organize which price areas to watch and roughly when. Where boxes from several waves and from higher timeframes overlap, the area is emphasized in three levels. Base waves are built only from confirmed swings, so a confirmed box does not move afterwards (see the conditions below).
WHAT IT DRAWS - Price levels: retracement 38.2 / 50 / 61.8 / 7

RSI Divergence Structure Confirmation RSI Divergence Structure Confirmation is a MetaTrader 5 indicator that combines RSI divergence analysis with confirmed price pivots and a subsequent market-structure break. It is designed for traders who want to distinguish an early divergence observation from a later, price-confirmed signal. How the Analysis Works First, the indicator identifies confirmed price swing highs and lows and compares the RSI values at eligible pairs of pivots. The detection proc

Product Title Multi-Stage Fibonacci Structure – Wave-Based Support & Resistance English Description A Fibonacci structure designed to identify high-value price levels by preserving the Fibonacci relationships created during previous market waves. Instead of drawing Fibonacci levels only from the most recent high and low, this method keeps the important levels created during previous 1st to 5th wave structures and uses them as reference points for future price action. The key concept is simple: P
FREE

This is the test product. Please, DO NOT BUY IT! This is the test product. Please, DO NOT BUY IT! This is the test product. Please, DO NOT BUY IT! This is the test product. Please, DO NOT BUY IT! This is the test product. Please, DO NOT BUY IT! This is the test product. Please, DO NOT BUY IT! This is the test product. Please, DO NOT BUY IT! This is the test product. Please, DO NOT BUY IT!
MetaTrader Mağazasının neden alım-satım stratejileri ve teknik göstergeler satmak için en iyi platform olduğunu biliyor musunuz? Reklam veya yazılım korumasına gerek yok, ödeme sorunları yok. Her şey MetaTrader Mağazasında sağlanmaktadır.

Alım-satım fırsatlarını kaçırıyorsunuz:
- Ücretsiz alım-satım uygulamaları
- İşlem kopyalama için 8.000'den fazla sinyal
- Finansal piyasaları keşfetmek için ekonomik haberler
Kayıt
Giriş yap
Web sitesi politikasını ve kullanım şartlarını kabul edersiniz
Hesabınız yoksa, lütfen kaydolun