 MetaTrader 5
 Experts
 지표
 라이브러리
 유틸리티
 위젯
 규칙
MetaTrader 5용 기술 지표 - 166
 기술 지표의 시그널은 주식 및 외환 시장에서 거래를 개시 및 종료하는 데 중요한 역할을 합니다. 지표의 본질은 미래의 가격 변화를 예측하기 위한 금융 시그널 값의 수학적 변형입니다.
기술 지표를 테스트하여 시장 행동과 그로 인한 이익을 더 잘 예측할 수 있습니다.

Liquidity Sweep Reclaim Atlas Liquidity Sweep Reclaim Atlas is a MetaTrader 5 price action indicator that identifies potential liquidity sweeps around confirmed swing highs and swing lows. It highlights candles that move beyond an established swing level and close back inside it, helping traders examine breakout rejection and price reclaim behavior on their charts. The indicator also offers optional follow-through confirmation, configurable volatility and wick filters, active swing reference lev

헤이킨 아시가 줄 수 있는 가장 깨끗한 추세 읽기를 관심 목록 전체에서. Smoothed Heikin Ashi Scanner는 두 번 매끄럽게 한 봉을 최대 스물여덟 종목과 네 시간대에서 돌리고, 가장 최근에 돌아선 것부터 보드를 정렬하며, 움직이기 전에 봉의 몸통을 보도록 아래에 차트를 둡니다. 10개가 판매될 때마다 가격이 10달러씩 인상됩니다. Smoothed Heikin Ashi Scanner는 한 파일에 두 제품이 들어 있습니다. 첫째는 눈앞의 차트에 그려지는 Smoothed Heikin Ashi 자체로, 매끄러워진 종가, 그 둘레의 봉의 고가와 저가, 그리고 몸통의 부호가 바뀐 화살표입니다. 두 번째 제품은 같은 계산을 종목 목록에 대해 여러 시간대에서 동시에 돌리는 보드입니다. 보드는 어떤 종목이 신호를 냈고 얼마나 오래전인지 알려 줍니다. 그 아래 차트는 무엇이 그 신호를 만들었는지 보여 주므로, 표가 찾아낸 것에 따라 움직이려고 두 번째 지표를 붙일 필요가 없습니다.

한 장의 보드, 스물여덟 종목, 그리고 믿을 만큼 차분한 모멘텀 값. SMI Ergodic Scanner는 Blau 님의 이중 평활 지수를 종목당 네 시간대에서 돌리고, 교차가 수준 바깥에서 일어났는지로 등급을 매기며, 교차를 눈으로 확인하도록 보드 아래에 오실레이터를 둡니다. 10개가 판매될 때마다 가격이 10달러씩 인상됩니다. SMI Ergodic Scanner는 한 파일에 두 제품이 들어 있습니다. 첫째는 이 차트 전용 창에 있는 SMI Ergodic 지수 자체로, 지수, 그 신호선, 그리고 둘 사이의 히스토그램입니다. 두 번째 제품은 같은 계산을 종목 목록에 대해 여러 시간대에서 동시에 돌리는 보드입니다. 보드는 어떤 종목이 신호를 냈고 얼마나 오래전인지 알려 줍니다. 그 아래 차트는 무엇이 그 신호를 만들었는지 보여 주므로, 표가 찾아낸 것에 따라 움직이려고 두 번째 지표를 붙일 필요가 없습니다. 보드 종목마다 한 줄, 스캔하는 시간대마다 한 열, 최대 네 열과 최대 스물여

이른 전환을 관심 목록 전체에서 한 번에 찾아냅니다. Schaff Trend Cycle Scanner는 Doug Schaff 님의 순환을 최대 스물여덟 종목과 네 시간대에서 돌리고, 각 전환이 구간의 얼마나 깊은 곳에서 시작했는지로 등급을 매기며, 거래 전에 전환을 보도록 보드 아래에 오실레이터를 둡니다. 10개가 판매될 때마다 가격이 10달러씩 인상됩니다. Schaff Trend Cycle Scanner는 한 파일에 두 제품이 들어 있습니다. 첫째는 이 차트 전용 창에 있는 Schaff Trend Cycle 자체로, 순환의 선, 그 구간 수준, 그리고 다이버전스 표시입니다. 두 번째 제품은 같은 계산을 종목 목록에 대해 여러 시간대에서 동시에 돌리는 보드입니다. 보드는 어떤 종목이 신호를 냈고 얼마나 오래전인지 알려 줍니다. 그 아래 차트는 무엇이 그 신호를 만들었는지 보여 주므로, 표가 찾아낸 것에 따라 움직이려고 두 번째 지표를 붙일 필요가 없습니다. 보드 종목마다 한 줄, 스
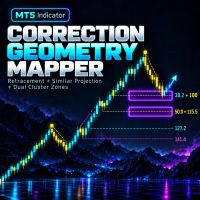
ToolForge Correction Geometry Mapper is a manual chart-analysis indicator for MetaTrader 5. It combines two measurements: a Fibonacci retracement of a selected price movement and a projected similar correction based on a reference correction selected by the trader.
When an enabled retracement level and an enabled similar-correction projection fall within the configured distance, the indicator draws a purple analysis zone. This zone shows where the two measurements overlap. It is intended as an

이 지표의 용도 MetaTrader 5 차트에 거래 결과를 보여주는 패널을 표시합니다. 데이터는 계정의 거래 내역에서 가져오며, 거래를 할 수는 없습니다. 다음 질문에 답합니다: 오늘, 어제, 그저께, 이번 달, 올해 얼마를 벌었거나 잃었는가? 어떤 통화쌍에서 수익 중이고 어떤 통화쌍에서 손실 중인가? 어떤 시간(브로커 서버 시간 기준)에 거래가 수익을 내고 어떤 시간에 손실을 내는가? 최대 드로다운은 얼마였는가? 여러 통화쌍에서 동시에 EA(전문가 자문)로 거래하는 경우 특히 편리합니다. 한 화면에서 어떤 통화쌍이 잘 작동하고 어떤 통화쌍이 계정을 끌어내리는지 볼 수 있습니다. 패널에 표시되는 내용 메인 표. 각 통화쌍별로: 거래 수(Deals), 순이익(Net, 수수료와 스왑 포함), 수익 거래 비율(Win %), 프로핏 팩터(PF, 이익을 손실로 나눈 값, 1보다 크면 좋음, "inf"는 손실이 전혀 없음을 의미), 현재 스프레드. 합계. TOTAL 행과 Today, Yeste

ALYAS Market Sentiment ALYAS Market Sentiment is a lightweight real-time market sentiment indicator for MetaTrader 5, designed to provide a quick visual overview of the current bullish and bearish pressure on the chart. Instead of relying on a single technical indicator, ALYAS Market Sentiment combines several market factors into one weighted sentiment score and displays the result in a simple Buy / Sell percentage bar . Key Features Multi-Factor Market Analysis The indicator combines six differ

All in One Trading Tool — Multi-Indicator Trading Assistant All in One Trading Tool is a comprehensive MetaTrader 5 indicator that combines several popular technical analysis tools into one convenient and easy-to-use interface. Instead of adding multiple indicators separately to your chart, this tool allows you to control EMA, Market Structure, Momentum, RSI, MACD, ADX, and ATR from a single interactive panel. Key Features EMA Group Display five Exponential Moving Averages directly on the mai

See at a glance where you are in the trading day. QuantEdge Sessions & Levels draws the Asia, London and New York sessions, the levels every trader watches, and the breakouts of the Asian range - with arrows that never repaint.
Sessions done right - Asia, London and New York boxes from their high to their low, with the size in pips - Each session is set in the local time of its city (Tokyo, London, New York): summer and winter time changes are handled automatically, including the weeks when Eur

FRACTAL BREAKOUT SCANNER DASHBOARD PRO MT5 - MULTI-PAIR & MULTI-TIMEFRAME ALGORITHMIC SCANNER WITH DYNAMIC ATR SL/TP & 16-LAYER INSTITUTIONAL FILTER MATRIX
PRODUCT SPECIFICATION & ARCHITECTURE OVERVIEW Product Name : Fractal Breakout Scanner Dashboard Pro MT5 Platform : MetaTrader 5 (MT5) Desktop Client Architecture ️ Product Type : Multi-As

MACD LEVEL 0 SCANNER DASHBOARD PRO MT5 Institutional Multi-Currency & Multi-Timeframe Momentum Scanner Dynamic Volatility ATR Stop Loss & Dual Take Profit Target Engine (1:1 & 1:2 R:R) 16 Modular Institutional Confluence Filters | 100% Strict Non-Repainting Architecture Interactive HUD Command Center with 1-Click Chart Switch, Drag & Drop, and Live Sorter
PRODUCT SPECIFICATIONS Product Type: Multi-Asset Dashboard Sca

MV Support & Resistance (SNR) Indicator MT5 The Support & Resistance (SNR) Indicator helps traders identify important price levels where the market may experience a price reversal, rejection, or breakout. Support and resistance levels are useful for understanding market structure, identifying potential entry opportunities, and planning trading strategies. Understanding Support & Resistance Green Line – Resistance Resistance is a price level where selling pressure may increase, potentially cau

Pattern Oracle is an all-in-one chart pattern engine for MetaTrader. It scans three zigzag levels at once, finds more than 30 harmonic, chart, continuation and reversal patterns, scores every setup and draws a complete trade plan with entry, stop-loss and two take-profit levels. A built-in teaching mode explains every pattern right on the chart. Pivots are only used once they are confirmed and every decision is made on a closed bar, so signals do not repaint . Patterns detected Reversal : Double

Quantum Edge is a machine-learning trend and signal indicator for MetaTrader. It combines a Lorentzian-distance k-nearest-neighbours classifier, a rational-quadratic kernel regression cloud and a multi-timeframe trend filter into one clean chart tool, then turns the result into clear, tiered BUY and SELL setups with ready-made stop-loss and three take-profit levels. Every signal is calculated on closed bars only . Once a label appears on the chart it stays exactly where it is: no repainting, no

LQ NEWS SCANNER — GOLD IMPACT & HISTORICAL EDGE Understand the news. Read the reaction. Discover the edge. Economic releases can create some of the most volatile moments in the Gold market. But knowing when the news is released is only part of the picture. Understanding its potential implications and examining how Gold has reacted to similar events can provide valuable context for your trading decisions. LQ News Scanner brings economic news monitoring, fundamental interpretation and historical

Ultimate Gold Scalper Ultimate Gold Scalper is a MetaTrader 5 indicator designed to present structured short-term XAUUSD trading setups directly on the M1 and M5 chart. It combines multi-timeframe market filtering with clear entry, stop-loss, and take-profit visualization. If the indicator does not appear on your chart, simply right click anywhere on the MT5 chart screen and select Refresh
Key Features BUY and SELL setup detection Clearly marked Entry, Stop Loss, and Take Profit levels Fixed 1:

BuySell Breakeven – 본전에 청산되는 가격을 정확히 알 수 있습니다 같은 종목에 여러 포지션(서로 다른 가격의 매수와 매도, 스왑과 수수료 포함)을 보유하고 있으면 간단한 질문에도 답하기 어렵습니다: "지금 전부 청산하면 어느 가격에서 본전이 될까?" BuySell Breakeven은 차트 위의 명확한 선 하나로 이 질문에 답하고, 새 포지션을 열기 전에 그 선이 어디로 이동할지 보여줍니다. 주요 기능 Breakeven 선(주황색): 모든 포지션을 한 번에 청산했을 때 결과가 0이 되는 가격 – 이익도 손실도 없음. 스왑, 수수료, 각종 비용, 스프레드가 포함됩니다. 매수만, 매도만, 또는 매수와 매도가 섞인 경우(헤지, 물타기, 그리드) 모두 지원합니다. 포지션을 열거나 닫을 때마다 선이 자동으로 이동합니다. 매수와 매도의 랏이 정확히 같으면 결과는 더 이상 가격에 좌우되지 않습니다. 지표는 선 대신 "Hedged" 와 고정된 결과를 표시합니다. 미리보기: BUY

How many CRT opportunities are missed while you are watching another chart or timeframe? The Candle Range Theory Indicator monitors three configurable timeframes simultaneously and brings qualifying bullish and bearish CRT setups directly to your current chart. Spend less time switching between charts and more time evaluating structured trading opportunities.

MT5용 Crypto_Forex 지표 "Major_Trend_Histogram", 리페인트 불필요 - 주요 추세 히스토그램 지표는 매우 큰 추세를 포착하도록 설계되었습니다. - 지표는 두 가지 색상으로 제공됩니다. 약세 추세는 분홍색, 강세 추세는 녹색(색상 변경 가능)입니다. - 초기 단계의 추세를 감지하여 일반적인 이동평균선(MA)보다 훨씬 효율적입니다. - 주요 추세 히스토그램은 가격 움직임, VSA, 기타 지표 등 다른 거래 방식과 결합할 수 있습니다. - 지표에는 모바일 및 PC 알림 기능이 내장되어 있습니다. Click here to see high quality Trading Robots and Indicators! MQL5 웹사이트에서만 제공되는 오리지널 제품입니다.

Mega MNFM MT5
Mega MNFM brings ten technical readings, a seven-timeframe trend map, regional session clocks and account-deal statistics into one MetaTrader 5 dashboard.
Technical dashboard RSI, MACD histogram, Stochastic, EMA trend, ADX, Bollinger Bands, an asset technical Fear & Greed proxy, an indicative synthetic dollar basket, ATR rank and OBV flow. Readings use completed candles. The timeframe map covers M1, M5, M15, M30, H1, H4 and D1. The dashboard includes a directional summary, trend

Volume Anomaly Candle Radar — MT5 Indicator Volume Anomaly Candle Radar is a price-action and volume analysis indicator for MetaTrader 5. It compares each completed candle's trading activity and price structure with a rolling baseline of older candles, helping traders identify unusually active directional moves and high-activity candles with limited price movement. Instead of treating every volume spike as a trading signal, the indicator separates three observable market conditions and displays

THV Camarilla Pivot MT5 – Reversal, Breakout & Target Levels
Overview THV Camarilla Pivot MT5 is a technical indicator that automatically calculates and displays Camarilla Pivot levels on your MetaTrader 5 chart. Based on the previous candle of the selected timeframe, the indicator plots eight key levels: H3, H4, H5, H6, L3, L4, L5, and L6. These levels help traders identify potential reversal zones, breakout areas, and price targets. The indicator also provides customizable line colors, styles

MT5용 Crypto_Forex 지표 "MFI 속도", 리페인트 없음. - 이 지표는 물리학 방정식을 기반으로 계산됩니다. MFI 속도는 MFI 자체의 1차 미분값입니다. - Money_Flow_Index(MFI)는 가격과 거래량 데이터를 사용하여 과매도 및 과매수 구간을 식별하는 기술적 오실레이터입니다. - MFI 속도는 주요 추세 방향으로 모멘텀 진입을 스캘핑하는 데 유용합니다. - 표준 EMA(그림 참조)와 같은 적절한 추세 지표와 함께 사용하십시오. - MFI 속도 지표는 MFI 자체의 방향이 얼마나 빨리 변하는지를 보여주며, 매우 민감합니다. - MFI 속도 지표 값이 0보다 작으면 속도는 음수이고, 0보다 크면 속도는 양수입니다. - 이 지표에는 모바일 및 PC 알림 기능이 내장되어 있습니다. 여기를 클릭하여 고품질 트레이딩 로봇과 지표를 확인하세요! 본 제품은 MQL5 웹사이트에서만 제공되는 정품입니다.

THV SMC Plus MT5 – Smart Money Concepts & Multi-Timeframe Analysis
Overview THV SMC Plus MT5 is a comprehensive Smart Money Concepts (SMC) indicator designed to help traders analyze market structure, identify potential liquidity zones, and recognize high-probability trading setups directly on MetaTrader 5. The indicator combines multiple price-action and institutional trading concepts into one customizable tool, including Break of Structure (BOS), Change of Character (CHoCH), Order Blocks (OB)

Inside Bar Breakout Retest Radar
Inside Bar Breakout Retest Radar is a price-action indicator for MetaTrader 5. It identifies completed inside candles, keeps the original mother bar boundaries fixed, and tracks a setup through a candle-close breakout and an optional first retest.
The indicator is designed for traders who study consolidation and the reaction of price around previously established levels. It shows chart events rather than placing orders.
Features
- Inside bar detection using

️ UTS Prime Zones — The Ultimate Multi-Timeframe Support & Resistance Engine UTS Prime Zones is an advanced, institutional-grade indicator that automatically maps out the most critical Support and Resistance zones across two different timeframes simultaneously . Stop drawing lines by hand. Stop guessing where the market will reverse. UTS Prime Zones uses a sophisticated fractal and ATR-based algorithm to identify high-probability "zones" (areas, not just single lines) where price is highly l

Inversion FVG는 공정가치 갭(3개 캔들로 만들어진 불균형)을 찾아내고, 그 갭이 무너지는 순간을 거래하는 인디케이터입니다. 캔들 몸통이 갭을 넘어 마감하면 갭이 "반전"되어 지지 또는 저항이 됩니다. 가격이 재테스트 후 거부되면 화살표와 함께 진입, 손절, TP1, TP2 레벨이 바로 표시됩니다.
작동 방식 1. 상승 또는 하락 FVG를 감지해 기본 구간으로 표시합니다. 2. 캔들 몸통이 구간을 넘어 마감하면 구간이 반전됩니다. 3. 첫 재테스트 + 거부 마감 = 신호 화살표 (파란 위쪽 = 매수, 빨간 아래쪽 = 매도). 4. 손절은 구간 바깥에 ATR 여유를 더해 설정합니다. TP1과 TP2는 R 배수(기본 1R, 2R)입니다.
기능 - 마감된 캔들만 사용: 화살표는 다시 그려지지 않으며 캔들 마감 후 움직이지 않습니다. - 진입, SL, TP1, TP2 선은 가격이 도달하면 거기서 멈춥니다. - 50%(CE) 선, 정보 패널, 활성 구간 카운터. - 팝업, 푸시

Elliott Wave Auto Count labels Elliott waves automatically on four degrees at the same time: the base degree and the three degrees above it. It follows the rules and guidelines of "Elliott Wave Principle" (Frost & Prechter). For the current wave it also shows a price x time target zone and an invalidation level.
HOW IT WORKS 1. Swings: five ATR(100)-based zigzags. Each higher degree uses a larger swing threshold. The finest zigzag is hidden and is used only to count the sub-waves inside each l

Neuron Chart is a complete charting workspace for MetaTrader 5 from Neuron Systems. It turns the standard chart into a modern, web-style workspace: a top toolbar, a drawing toolbar on the left, a panel bar on the right, indicator panes inside the chart, price alerts, bar replay, a watchlist, a screener, the economic calendar and more, all on the chart you already use. It is an indicator for chart analysis only: it draws on the chart, it does not place, modify or close trades, it does not send or

Zone Risk Planner turns support and resistance zones into a complete trade plan: where to enter, where to place the stop loss (SL), where the take profit (TP) goes and how many lots match your risk. It also shows the risk of your whole account, the market regime on several timeframes and a multi-symbol scanner, all in one indicator.
It is a planning and risk-management tool. It does not give buy or sell signals and it does not open, modify or close trades.
Support and resistance zones
- Calcu

Dow Structure MTF shows the Dow theory trend structure of five timeframes at the same time, using the pullback low / rally high approach that is common among Japanese traders. For each timeframe you see whether the trend is up, down or range, which price would change it, and how far the current price is from that level. Only closed bars are used, so a confirmed result never changes afterwards (no repaint).
WHAT YOU SEE - Table of five timeframes (M15, H1, H4, D1, W1 by default, all changeable)

Fibo Price Time Zones combines Fibonacci price levels with Fibonacci time targets and draws them on the chart as boxes (price x time zones). It helps you organize which price areas to watch and roughly when. Where boxes from several waves and from higher timeframes overlap, the area is emphasized in three levels. Base waves are built only from confirmed swings, so a confirmed box does not move afterwards (see the conditions below).
WHAT IT DRAWS - Price levels: retracement 38.2 / 50 / 61.8 / 7

RSI Divergence Structure Confirmation RSI Divergence Structure Confirmation is a MetaTrader 5 indicator that combines RSI divergence analysis with confirmed price pivots and a subsequent market-structure break. It is designed for traders who want to distinguish an early divergence observation from a later, price-confirmed signal. How the Analysis Works First, the indicator identifies confirmed price swing highs and lows and compares the RSI values at eligible pairs of pivots. The detection proc

Product Title Multi-Stage Fibonacci Structure – Wave-Based Support & Resistance English Description A Fibonacci structure designed to identify high-value price levels by preserving the Fibonacci relationships created during previous market waves. Instead of drawing Fibonacci levels only from the most recent high and low, this method keeps the important levels created during previous 1st to 5th wave structures and uses them as reference points for future price action. The key concept is simple: P
FREE

This is the test product. Please, DO NOT BUY IT! This is the test product. Please, DO NOT BUY IT! This is the test product. Please, DO NOT BUY IT! This is the test product. Please, DO NOT BUY IT! This is the test product. Please, DO NOT BUY IT! This is the test product. Please, DO NOT BUY IT! This is the test product. Please, DO NOT BUY IT! This is the test product. Please, DO NOT BUY IT!
트레이딩 전략과 기술 지표를 판매하기에 가장 좋은 장소가 왜 MetaTrader 마켓인지 알고 계십니까? 광고나 소프트웨어 보호가 필요 없고, 지불 문제도 없습니다. 모든 것이 MetaTrader 마켓에서 제공됩니다.
