 MetaTrader 5
 Experts
 Indicatori
 librerie
 Utilità
 Widget
 Regole
Guarda i video tutorial del Market su YouTube
Come acquistare un Robot di Trading o un indicatore
Esegui il tuo EA
hosting virtuale
hosting virtuale
Prova un indicatore/robot di trading prima di acquistarlo
Vuoi guadagnare nel Market?
Come presentare un prodotto per venderlo con successo
Indicatori tecnici per MetaTrader 5 - 166
 I segnali degli indicatori tecnici giocano un ruolo cruciale nell'apertura e nella chiusura delle transazioni sui mercati azionari e Forex. L'essenza degli indicatori è una trasformazione matematica del prezzo di un simbolo finanziario, finalizzata alla previsione dei cambiamenti futuri dei prezzi. Prova gli indicatori tecnici, per prevedere al meglio il comportamento del mercato e ricavarne dei guadagni.

Gold Volatility Levels answers the questions every gold trader asks before an entry: how far can price realistically move today, where is a sensible stop, and is the current spread worth it? What you get on the chart: ATR risk ruler. Choose the ATR timeframe and period; stop-distance multipliers and reward multiples (R) are drawn for both directions, updating with the current market. Average Daily Range. Mean or median of completed days, with projected upper/lower ADR levels and how much of toda

USER MANUAL: TDI OPTIMIZED BY MARSU (MT5) 1. Introduction: TDI Optimized by Marsu is a super indicator developed specifically for the MetaTrader 5 (MT5) platform. Upgraded from the classic Traders Dynamic Index (TDI) system, this version brings a fresh perspective with its excellent noise signal removal capabilities, direct optimization on Japanese candlesticks (lighter and smoother), and especially its Auto Timeframe system that automatically adapts to all trading styles. The indicator pr

SD Zones MTF Dashboard is a chart-analysis tool for MetaTrader 5 that automatically marks supply and demand zones and shows the trend of four timeframes in a compact on-chart panel. WHAT IT DOES - Detects supply and demand zones from confirmed swing pivots. - Keeps only zones that were followed by a real impulse move (measured in ATR), so weak levels are filtered out. - Extends active zones to the right and removes them once price closes beyond them (optionally shows broken zones as outlines). -

Nexum Veritas: market structure, zones, liquidity and a price projection tool on your MT5 chart. Nexum Veritas draws the Smart Money Concepts structure of the market from one consistent pivot chain that never repaints , shows the zones, levels and liquidity that SMC traders read, and lets you sketch the path you expect on the chart. Optionally it marks four classic SMC setups as a learning aid. It is a tool to read the market and plan your own trades, not a signal service. MARKET STRUCTURE Pivot

NexusFlow MTF Pro — The Ultimate Multi-Timeframe Power for MetaTrader 5 Tired of trading on the M5 or M15 timeframe only to realize too late that the H1 or H4 trend was completely against your entry? Lost count of how many times you had to open multiple windows, constantly switch charts, or clutter your screen with confusing indicators just to align the market direction? NexusFlow MTF Pro was engineered specifically to eliminate this operational friction and elevate your flow and trend analysis.

MSB Pro SMC Gold disegna sul grafico gli strumenti fondamentali degli Smart Money Concepts e li aggiorna a ogni nuova candela. È stato progettato e testato su XAUUSD (oro) e funziona su qualsiasi simbolo e timeframe.
Tutti i calcoli usano solo candele chiuse. Una volta disegnati, un segnale, un BOS/CHoCH, un Order Block o un FVG non vengono rimossi né ridisegnati sulle candele successive. I punti swing vengono confermati dopo la chiusura delle candele della finestra destra, come in ogni strume

Mavin SMC Pro is a Smart Money Concepts indicator for MetaTrader 5 designed to help traders analyze market structure and price action. Features include: Major and minor market structure Break of Structure (BOS) and Change of Character (CHoCH) Order Blocks (OB) Fair Value Gaps (FVG) Liquidity levels Strict BUY and SELL signals H4, H1 and M15 directional bias dashboard The indicator provides visual analysis tools to support your own trading decisions. It does not guarantee profitable results. Alwa

THV Key SRs and TrendLines MT5
Automatically Identify Key Swing Highs, Swing Lows, Support, Resistance, and Trendlines on MetaTrader 5. THV Key SR and Trend Line MT5 is a technical analysis indicator designed to help traders identify important market swing points and visualize potential support and resistance levels. The indicator detects Key Highs and Key Lows using a configurable Pivot setting, draws optional support and resistance lines, and connects recent swing points with upper and lower

Swing Range High Low — 4-Level Market Structure & Range Automatic swing highs/lows with confirmed level lines and a price range channel. Clean structure, no repaint option, alerts and push. Full description Swing Range High Low is a chart indicator that marks confirmed swing pivots and turns them into four readable price levels: the last confirmed Swing High, the last confirmed Swing Low, and the upper/lower boundaries of the working range. What it draws Element Meaning Red arrow Confirmed Sw
Chart Pattern Navigator MT5 Overview Chart Pattern Navigator MT5 is a technical analysis indicator designed to automatically detect, classify and visualize classic chart patterns directly on your MetaTrader 5 charts. It helps traders identify potential market structures, monitor pattern development and evaluate possible trading scenarios without having to draw every formation manually. The indicator combines pattern recognition, configurable breakout and retest logic, projected entry levels, st

Market State Reader reads the chart the way a price action trader does and writes the result on the chart in plain words: is this a trend or a trading range, who is in control (bulls or bears), did the last breakout follow through or fail, where is the gap, where is the measured-move target, and what is worth looking for on the next bar. It works on closed bars only, so nothing repaints. It was built for intraday index trading (DAX, US500, Nasdaq) on M5, but it runs on any symbol and timeframe.

SVP Session Volume Profile HD for MT5 SVP Session Volume Profile HD is a session-based volume profile indicator for MetaTrader 5, styled after TradingView’s “Session Volume Profile HD”. It shows where volume traded during each session, so you can see the price levels the market accepted and rejected. How it works For each session, the indicator loads high-resolution data (M1 by default) and spreads each bar’s volume across its price range. The result is a detailed histogram, with up and down vol

Gf Macd Ma Cross Divergence Product Description Gf Macd Ma Cross Divergence is a technical analysis indicator designed to help traders identify potential buy and sell opportunities in the financial markets. It combines three popular trading tools: MACD, Moving Average (MA) Cross, and Divergence to help traders understand market momentum, spot possible trend changes, and identify potential entry points. Key Features MACD Signals: Helps traders assess market momentum and identify potential bullish

VWAP Sessions: Session-Anchored VWAP for MetaTrader 5 VWAP Sessions plots a separate volume-weighted average price for each major trading session, directly on your chart. Each VWAP starts fresh when its session opens and ends when the session closes, so you see where each session’s average traded price sits rather than one continuous line that blends everything together. What it does Plots up to 3 independent session VWAP lines at once Defaults to Asia, London and New York, with every start and

Multi-timeframe high-resistance liquidity-zone identification — combining a union of multiple methods + multi-timeframe confluence + strength scoring to mark the key levels where price is most likely to reverse after sweeping liquidity . 01 Purpose & Positioning A liquidity-zone visualization indicator built for domestic futures (MT5/CTP) and forex (MT4/MT5), helping traders quickly lock onto: Genuine High-Resistance Zones Scores "multi-timeframe confluence + volume participation/a

A cosa serve questo indicatore Mostra sul grafico di MetaTrader 5 un pannello con i risultati del tuo trading. I dati provengono dalla cronologia delle operazioni del conto; non sa fare trading. Risponde alle domande: Quanto ho guadagnato o perso oggi, ieri, l'altro ieri, nel mese e nell'anno? Su quali coppie sono in positivo e su quali sono in negativo? A quali ore (secondo l'ora del server del broker) le mie operazioni portano profitto e a quali ore portano perdite? Qual è stato il drawdown ma

Quantum Trade Signals — Advanced Trading Indicator All-in-One Professional Trading Indicator! Quantum Trade Signals combines multiple trading strategies, Smart Money Concepts (SMC), and advanced technical analysis to identify potential trading opportunities. Key Features: Advanced BUY & SELL Signals Intelligent Signal Scoring System Multiple Trading Strategies BOS, CHoCH & Liquidity Sweeps Trend & Market Structure Analysis Breakout & Retest Detection Suggested Stop Loss & Ta

LONDON SWEEP iFVG INDICATOR
MT5 Trading Indicator Trade the London Liquidity Sweep. Catch the Inversion. Target the Next Move. The London Sweep iFVG Indicator is an advanced MetaTrader 5 trading tool designed to help traders identify potential reversal opportunities during the London trading session using liquidity sweeps, Fair Value Gaps (FVGs), and inverse Fair Value Gap (iFVG) confirmation. Instead of relying on random entries or chasing candles after a strong move, the indicator follows

Level 3 Sweep Indicator Stop buying the first bounce. Trade the second fake-out. Most traders enter right after liquidity is taken, then watch price dip again and stop them out. 3rd Level Sweep waits for the move that comes after the trap. It scans for the sequence where smart money clears the early entrants before the real move starts.
The 6-step sequence it looks for External liquidity sweep: old highs or lows get taken. Higher-timeframe FVG delivery: price reacts from an M15, M30 or H1 fair

Liquidity Sweep Reclaim Atlas Liquidity Sweep Reclaim Atlas is a MetaTrader 5 price action indicator that identifies potential liquidity sweeps around confirmed swing highs and swing lows. It highlights candles that move beyond an established swing level and close back inside it, helping traders examine breakout rejection and price reclaim behavior on their charts. The indicator also offers optional follow-through confirmation, configurable volatility and wick filters, active swing reference lev
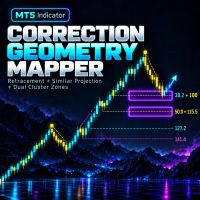
TOOLFORGE CORRECTION GEOMETRY MAPPER — INDICATORE MT5 TRACCIA I RITRACCIAMENTI. PROIETTA CORREZIONI SIMILI. VISUALIZZA LE CONFLUENZE.
ToolForge Correction Geometry Mapper è un indicatore per l'analisi manuale dei grafici in MetaTrader 5. Combina un ritracciamento di Fibonacci selezionato dal trader con proiezioni basate su una correzione precedente scelta manualmente. Quando un livello attivo di ritracciamento e una proiezione attiva sono sufficientemente vicini, la sovrapposizione viene evide

ATS Round Number Cascade Stats misura cosa ha fatto il prezzo dopo aver attraversato i livelli tondi sul tuo simbolo, usando lo storico prezzi del tuo broker. Il risultato compare in un pannello nell'angolo del grafico. I livelli sono disegnati come linee sul grafico. Molti trader guardano i prezzi tondi come possibili livelli di reazione. Questo indicatore non dà per scontato che contino. Conta cosa è successo dopo ogni attraversamento e lo confronta con livelli scelti a caso. Cosa misura Ogni

A Chart-style Long/Short Position tool for MT5. Drag entry, take profit and stop loss directly on the chart, see the risk/reward ratio and the lot size calculated from your risk % instantly. Green TP zone, red SL zone, clean English labels, and a round on-chart button to show or hide the tool. Purely visual - it never opens, modifies or closes orders. Plan trades on MetaTrader 5 visually, directly on the chart. Place the box, drag the levels, and read the price, RR and position size at a glance.

Model S/R + Rotation + Sessions One overlay. Three engines. No repaint Indicator A professional analytical indicator that combines historical Support/Resistance with strength scoring , a rotation trend channel with live angle readout , and a session engine with countdown monitor — all rendered natively on the MT5 chart with zero external dependencies. What It Does Engine Output S/R Engine Auto-detected historical bands, colour-coded (RES/SUP), tagged xN touches and strength % (0–100). Strongest

Вот профессиональный перевод описания индикатора на английский язык, полностью оформленный и готовый для публикации на площадке MQL5 Market : ADX-Trend Pro MTF — Professional Trend Indicator for MetaTrader 5 ADX-Trend Pro is a modern, high-tech tool for comprehensive market analysis designed to identify strong, sustainable trends and filter out market noise (flat ranges). The indicator combines classic moving average analysis, a powerful ADX/DI trend strength filter, and dynamic ATR-based volati

Neuron Chart is a complete charting workspace for MetaTrader 5 from Neuron Systems. It turns the standard chart into a modern, web-style workspace: a top toolbar, a drawing toolbar on the left, a panel bar on the right, indicator panes inside the chart, price alerts, bar replay, a watchlist, a screener, the economic calendar and more, all on the chart you already use. It is an indicator for chart analysis only: it draws on the chart, it does not place, modify or close trades, it does not send or

HD Candels Chart – Ultra-Light MT5 Chart Controller HD Candels Chart is a lightweight MetaTrader 5 indicator designed to let traders switch chart styles and customize their chart appearance instantly with simple on-chart buttons. Key Features Line Chart Toggle: Quickly switch to Line Chart mode and toggle between Parrot Green and Black line colors. HD Chart Mode: Apply a professional TradingView-inspired dark slate theme with teal bullish candles, coral bearish candles, and a clean chart backgro

See at a glance where you are in the trading day. QuantEdge Sessions & Levels draws the Asia, London and New York sessions, the levels every trader watches, and the breakouts of the Asian range - with arrows that never repaint.
Sessions done right - Asia, London and New York boxes from their high to their low, with the size in pips - Each session is set in the local time of its city (Tokyo, London, New York): summer and winter time changes are handled automatically, including the weeks when Eur

MV Support & Resistance (SNR) Indicator MT5 The Support & Resistance (SNR) Indicator helps traders identify important price levels where the market may experience a price reversal, rejection, or breakout. Support and resistance levels are useful for understanding market structure, identifying potential entry opportunities, and planning trading strategies. Understanding Support & Resistance Green Line – Resistance Resistance is a price level where selling pressure may increase, potentially cau

Pattern Oracle is an all-in-one chart pattern engine for MetaTrader. It scans three zigzag levels at once, finds more than 30 harmonic, chart, continuation and reversal patterns, scores every setup and draws a complete trade plan with entry, stop-loss and two take-profit levels. A built-in teaching mode explains every pattern right on the chart. Pivots are only used once they are confirmed and every decision is made on a closed bar, so signals do not repaint . Patterns detected Reversal : Double

Quantum Edge is a machine-learning trend and signal indicator for MetaTrader. It combines a Lorentzian-distance k-nearest-neighbours classifier, a rational-quadratic kernel regression cloud and a multi-timeframe trend filter into one clean chart tool, then turns the result into clear, tiered BUY and SELL setups with ready-made stop-loss and three take-profit levels. Every signal is calculated on closed bars only . Once a label appears on the chart it stays exactly where it is: no repainting, no

LQ NEWS SCANNER — GOLD IMPACT & HISTORICAL EDGE Understand the news. Read the reaction. Discover the edge. Economic releases can create some of the most volatile moments in the Gold market. But knowing when the news is released is only part of the picture. Understanding its potential implications and examining how Gold has reacted to similar events can provide valuable context for your trading decisions. LQ News Scanner brings economic news monitoring, fundamental interpretation and historical

Ultimate Gold Scalper Ultimate Gold Scalper is a MetaTrader 5 indicator designed to present structured short-term XAUUSD trading setups directly on the M1 and M5 chart. It combines multi-timeframe market filtering with clear entry, stop-loss, and take-profit visualization. If the indicator does not appear on your chart, simply right click anywhere on the MT5 chart screen and select Refresh
Key Features BUY and SELL setup detection Clearly marked Entry, Stop Loss, and Take Profit levels Fixed 1:

How many CRT opportunities are missed while you are watching another chart or timeframe? The Candle Range Theory Indicator monitors three configurable timeframes simultaneously and brings qualifying bullish and bearish CRT setups directly to your current chart. Spend less time switching between charts and more time evaluating structured trading opportunities.

BuySell Breakeven – sai esattamente dove esci a zero Quando hai più operazioni aperte sullo stesso simbolo (acquisti e vendite, a prezzi diversi, con swap e commissioni), è difficile rispondere a una domanda semplice: "Se chiudo tutto adesso, a che prezzo esco in pari?" BuySell Breakeven risponde con una linea chiara sul grafico e ti permette di vedere dove si sposterebbe quella linea prima di aprire una nuova operazione. COSA FA Linea Breakeven (arancione): il prezzo al quale, chiudendo tutte

Indicatore Crypto_Forex "Major_Trend_Histogram" per MT5, senza ridisegno. - Indicatore Major_Trend_Histogram progettato per individuare trend davvero significativi. - L'indicatore può essere di 2 colori: rosa per trend ribassista e verde per trend rialzista (i colori possono essere modificati). - Rileva i trend nelle fasi iniziali, molto più efficiente di qualsiasi media mobile standard. - Major_Trend_Histogram può essere combinato con qualsiasi altro metodo di trading: Price Action, VSA e altr

Mega MNFM MT5
Mega MNFM brings ten technical readings, a seven-timeframe trend map, regional session clocks and account-deal statistics into one MetaTrader 5 dashboard.
Technical dashboard RSI, MACD histogram, Stochastic, EMA trend, ADX, Bollinger Bands, an asset technical Fear & Greed proxy, an indicative synthetic dollar basket, ATR rank and OBV flow. Readings use completed candles. The timeframe map covers M1, M5, M15, M30, H1, H4 and D1. The dashboard includes a directional summary, trend

️ UTS Prime Zones — The Ultimate Multi-Timeframe Support & Resistance Engine UTS Prime Zones is an advanced, institutional-grade indicator that automatically maps out the most critical Support and Resistance zones across two different timeframes simultaneously . Stop drawing lines by hand. Stop guessing where the market will reverse. UTS Prime Zones uses a sophisticated fractal and ATR-based algorithm to identify high-probability "zones" (areas, not just single lines) where price is highly l

THV Camarilla Pivot MT5 – Reversal, Breakout & Target Levels
Overview THV Camarilla Pivot MT5 is a technical indicator that automatically calculates and displays Camarilla Pivot levels on your MetaTrader 5 chart. Based on the previous candle of the selected timeframe, the indicator plots eight key levels: H3, H4, H5, H6, L3, L4, L5, and L6. These levels help traders identify potential reversal zones, breakout areas, and price targets. The indicator also provides customizable line colors, styles

Indicatore Crypto_Forex "MFI Speed" per MT5, senza ridisegno. - Il calcolo di questo indicatore si basa su equazioni fisiche. MFI Speed è la derivata prima di MFI stesso. - Money_Flow_Index (MFI) è un oscillatore tecnico che utilizza i dati di prezzo e volume per identificare zone di ipervenduto e ipercomprato. - MFI Speed è utile per scalping di ingressi momentum nella direzione del trend principale. - Utilizzalo in combinazione con un indicatore di trend appropriato, ad esempio l'EMA stan

THV SMC Plus MT5 – Smart Money Concepts & Multi-Timeframe Analysis
Overview THV SMC Plus MT5 is a comprehensive Smart Money Concepts (SMC) indicator designed to help traders analyze market structure, identify potential liquidity zones, and recognize high-probability trading setups directly on MetaTrader 5. The indicator combines multiple price-action and institutional trading concepts into one customizable tool, including Break of Structure (BOS), Change of Character (CHoCH), Order Blocks (OB)

Inversion FVG individua i Fair Value Gap (squilibri di 3 candele) e opera nel momento in cui falliscono. Quando il corpo di una candela chiude attraverso il gap, questo viene "invertito" e diventa supporto o resistenza. Quando il prezzo lo ritesta e viene respinto, l'indicatore disegna una freccia con livelli pronti di ingresso, Stop Loss, TP1 e TP2.
Come funziona 1. Viene rilevato un FVG rialzista o ribassista e disegnato come zona grezza. 2. La chiusura del corpo di una candela attraverso la

Elliott Wave Auto Count labels Elliott waves automatically on four degrees at the same time: the base degree and the three degrees above it. It follows the rules and guidelines of "Elliott Wave Principle" (Frost & Prechter). For the current wave it also shows a price x time target zone and an invalidation level.
HOW IT WORKS 1. Swings: five ATR(100)-based zigzags. Each higher degree uses a larger swing threshold. The finest zigzag is hidden and is used only to count the sub-waves inside each l

Zone Risk Planner turns support and resistance zones into a complete trade plan: where to enter, where to place the stop loss (SL), where the take profit (TP) goes and how many lots match your risk. It also shows the risk of your whole account, the market regime on several timeframes and a multi-symbol scanner, all in one indicator.
It is a planning and risk-management tool. It does not give buy or sell signals and it does not open, modify or close trades.
Support and resistance zones
- Calcu

Dow Structure MTF shows the Dow theory trend structure of five timeframes at the same time, using the pullback low / rally high approach that is common among Japanese traders. For each timeframe you see whether the trend is up, down or range, which price would change it, and how far the current price is from that level. Only closed bars are used, so a confirmed result never changes afterwards (no repaint).
WHAT YOU SEE - Table of five timeframes (M15, H1, H4, D1, W1 by default, all changeable)

Fibo Price Time Zones combines Fibonacci price levels with Fibonacci time targets and draws them on the chart as boxes (price x time zones). It helps you organize which price areas to watch and roughly when. Where boxes from several waves and from higher timeframes overlap, the area is emphasized in three levels. Base waves are built only from confirmed swings, so a confirmed box does not move afterwards (see the conditions below).
WHAT IT DRAWS - Price levels: retracement 38.2 / 50 / 61.8 / 7

Gold Compass Lite is a premier multi-timeframe trend and signal system engineered specifically for XAUUSD (Gold) on the M15 chart . It acts as a comprehensive diagnostic dashboard, synchronizing momentum while shielding your capital. ️ THE UNFAIR ADVANTAGE Unlike 99% of indicators that print delayed arrows based on simple moving averages, Gold Compass Lite features an advanced, data-driven Fair Value Gap (FVG) probability model tested on over 20,000 historical gaps. It automatically calculates

AURUM Line Alerts [SNAP] Description AURUM Line Alerts gives you four horizontal price alert lines that place themselves on the levels where price has repeatedly turned. Instead of drawing lines by hand and setting alerts one by one, attach the indicator and the lines appear on the strongest aligned tops and bottoms: two above price and two below. Drag any line to a new price at any time, and its alert re-arms automatically. Key features 4 independent alert lines, each with its own label, price,

Stoch Zone Pro non è un semplice oscillatore, ma una stazione analitica completa direttamente sul tuo grafico. Abbiamo preso la meccanica classica del ritorno alla media (mean-reversion) e abbiamo risolto il suo problema principale: l'enorme quantità di falsi segnali durante i forti movimenti direzionali dei prezzi. Grazie all'algoritmo proprietario integrato Advanced Trend Filter , l'indicatore analizza continuamente il momentum nascosto del mercato. Ricevi segnali solo quando l'inversione di p

EN
LumenSMC draws Smart Money Concepts zones, structure and teaching drawings where you click. It does not find zones by itself, does not trade and gives no signals.
What you can build
- SMC zones: Order Block (bullish/bearish), Order Block with sweep, Fair Value Gap with a 50% CE line, Liquidity and EQH/EQL.
- Structure: Swing (HH/HL/LH/LL), BOS/CHoCH, Premium/Discount with a 50% line, Fibonacci, R:R box.
- Drawing: line, rectangle, triangle, ellipse.
- Patterns: zigzag, Head and Shoul

Gold Xauusd Structure Compass Mt5 is a MetaTrader 5 indicator designed for discretionary gold trading analysis. It identifies sweep-and-reclaim and trend-pullback setups on XAUUSD, combining closed-candle confirmation, completed context candles and volatility filters. The indicator brings setup markers, market context and reference stop-loss and take-profit levels into one chart interface. It supports manual decision-making and does not open or manage trades. Two setup models The sweep-and-recla

Time Average Lines draws four averages that are measured by time, not by the number of bars. When you switch timeframes, each line still averages the same length of time. The main line (3) averages how far price had moved from the day's open at the same clock time on past days, and the rest of today is shown as a dotted path that joins those past averages. The path is a summary of the past, not a forecast.
THE FOUR LINES - (1) Time MA: average close of the bars that started within the last N m

This is the test product. Please, DO NOT BUY IT! This is the test product. Please, DO NOT BUY IT! This is the test product. Please, DO NOT BUY IT! This is the test product. Please, DO NOT BUY IT! This is the test product. Please, DO NOT BUY IT! This is the test product. Please, DO NOT BUY IT! This is the test product. Please, DO NOT BUY IT! This is the test product. Please, DO NOT BUY IT!
Il MetaTrader Market offre un luogo pratico e sicuro dove acquistare applicazioni per la piattaforma MetaTrader. Scarica versioni demo gratuite di Expert Advisors e indicatori direttamente dal tuo terminale e testali nello Strategy Tester.
Prova le applicazioni in diverse modalità per monitorare le prestazioni ed effettuare pagamenti per i prodotti desiderati, utilizzando il sistema di pagamento MQL5.community.

Ti stai perdendo delle opportunità di trading:
- App di trading gratuite
- Oltre 8.000 segnali per il copy trading
- Notizie economiche per esplorare i mercati finanziari
Registrazione
Accedi
Accetti la politica del sito e le condizioni d’uso
Se non hai un account, registrati