 MetaTrader 5
 エキスパート
 インディケータ
 ライブラリ
 ユーティリティ
 ウィジェット
 ルール
YouTubeにあるマーケットチュートリアルビデオをご覧ください
ロボットや指標を購入する
仮想ホスティングで
EAを実行
EAを実行
ロボットや指標を購入前にテストする
マーケットで収入を得る
販売のためにプロダクトをプレゼンテーションする方法
MetaTrader 5のためのテクニカル指標 - 166
 テクニカル指標からのシグナルは、株式および外国為替市場での取引の開始と終了に重要な役割を果たします。指標の本質は、将来の価格変動を予測することを目的とした金融銘柄価格の数学的変換です。
テクニカル指標をテストして、市場の動きとそれからの利益をより正確に予測します。

**RSI Divergence Pro with Engulfing Confirmation**
Filter out false divergence signals and capture high-probability market reversals and continuation legs with **RSI Divergence Pro**!
Standard divergence indicators often produce premature signals in strong trending markets. This professional indicator solves that problem by requiring a confirmed **Engulfing Candlestick** right after a valid RSI divergence forms.
---
**KEY ADVANTAGES**
* **100% Non-Repainting & Non-Lagging:** Si

Range Filter Scanner MT5 is a scanner indicator for MetaTrader 5. One panel shows the latest range-filter signal on many symbols and timeframes, how many bars ago it came, and whether the next timeframe to the right agrees. It sends an alert when a new signal appears. It places no orders. It runs the same range-filter engine as the free Range Filter Signals indicator, for a whole list of charts at once, on closed bars only. Standalone: everything is built in. You do not need to buy or install an
Sequential Scanner MT5 is a panel indicator for MetaTrader 5 that runs the 9-13 sequential count on many symbols and timeframes at once. Each cell shows a fresh 9 or 13, a count one bar from completing, or a countdown in progress. Otherwise it shows the latest 9 or 13 and how many bars ago it came. It counts closed bars only. A cell never changes after its bar has closed. It places no trades. Standalone: Everything is built in. You do not need to buy or install any other product named on this pa

SMC Session Scanner MT5 is a panel indicator for MetaTrader 5 that watches many symbols and timeframes for smart-money structure and session levels. For each symbol and timeframe it shows one of these: a fresh break of structure (BOS), a change of character (CHoCH), or a fresh liquidity sweep. It also shows price inside a live order block or fair value gap. Otherwise it shows the latest break and how long ago it was. A Session column shows the session now. It also shows today's first close beyon

AMDX Po3 Quarterly Theory Ict Tjmas is an institutional MetaTrader 5 indicator combining Quarterly Theory (AMDX Cycles) , Power of Three (PO3: Accumulation, Manipulation, Distribution) , and the Configurable Target HTF Candle & Auto Zoom-Out Switcher (M15 / M30 / H1 / H4 / D1) in one streamlined overlay. Built 100% natively in MQL5 with zero lag for Index Futures/CFDs (US100/NQ, US500/ES, US30/YM), Gold (XAUUSD), and Forex. KEY INSTITUTIONAL MODULES INCLUDED (v1.10): 1. QUARTERLY THEORY (AMDX CY

MQLTeam Smoothed Candles は、細かく上下する値動きより読みやすいローソク足を MetaTrader 5 のチャートに描きます。元の価格足は隠せますし、下に残すこともできます。短い往復の代わりに、上昇と下降が続く区間として見えます。 各足の終値は、そのバーの 実際の終値 のままです。価格は作り替えず、静かになるのは値幅だけです。Heikin Ashi ではなく、上位足をまとめたものでもありません。同じ相場を、より分かりやすく描きます。 UpSignal と DownSignal は 新しい区間の始まり を示します。区間の端で明確に終値し、矢印の方向に逆らうヒゲがない、最初の滑らかな足です。価格フィルタは区間の最初の矢印を優先します。同じ方向の後の矢印は、前より有利な価格のときだけ残ります。まだ確定していない足には薄い矢印が出ることがあります。確定後に残るか、条件を満たさなければ消えます。 設定はチャート上のパネルで変え、 TradingView に近い操作です。 主な機能 読みやすいローソク足。 上昇と下降の区間で表示します。元の価格足を隠す設定は初期状態で有効で

MMXM Market Maker Stdv Ict Tjmas is an institutional MetaTrader 5 indicator engineered for Inner Circle Trader (ICT) and Smart Money Concepts (SMC) traders. It automatically identifies Market Maker Buy Models (MMBM) and Market Maker Sell Models (MMSM), Smart Money Reversals (SMR), Original Consolidation (OC) liquidity targets, and algorithmic Standard Deviation (STDV) Fibonacci projections. KEY INSTITUTIONAL FEATURES: 1. Automated Market Maker Buy & Sell Models (MMBM / MMSM) Automatically detect

TrendMark
Тренд на графике: ADX, Efficiency Ratio и выход цены из коридора. Панель показывает режим — тренд или боковик — и сторону: лонг, шорт или ждать.
Тренд включается, если сработало хотя бы одно: ADX выше порога, ER выше порога или цена вышла из коридора последних часов. Пока тренд уже есть, он держится на более мягких порогах. Сторона берётся из +DI и −DI: плюс сильнее — лонг, иначе шорт. В боковике сигнала нет.
Зелёная стрелка — вход в лонг, красная — в шорт. Стрелка ставится на закр

Dynamic Candle Projection MT5 Advanced Statistical Volatility Levels & Multi-Timeframe Projection Engine Dynamic Candle Projection is an advanced technical indicator for MetaTrader 5 designed to map price movement projections with high precision based on historical statistical analysis. It dynamically calculates average candle ranges and price distances to plot Support, Resistance, Take Profit, and Stop Loss levels, as well as non-repainting entry signals ( Entry Sniper ). Key Features:

そのインジケーターは履歴上で勝率81%。本当にそのトレードを取れたでしょうか? バージョン 1.10:パネルに新しい成績カーブ 大きな R 成績カーブ:色付きはコスト後、グレーはコスト前。コストの影響が一目で分かります。 最大ドローダウン区間を網掛け、黄色の線でアウトオブサンプルの開始を表示。 合計、最大DD、取引数、期間をチャート上に表示。 TravaRisco Signal Checker Pro は、あらゆる MT5 矢印インジケーターを誠実に検証します。無料版 TravaRisco Signal Checker の完全版で、本当の優位性ときれいなチャートを見分けるツールを備えています。 Pro 版の追加機能 シグナル遅延の補正。 多くのインジケーター(Fractals、ピボット、スイング矢印)は値動きの数本後に矢印を表示します。リアルタイム検査で遅延を測定し、使うべき値を表示します。 アウトオブサンプル検証付き SL/TP 最適化。 古い履歴で25通りを検証し、最良の組み合わせを未使用の新しい期間で再検証。失敗すれば「運だった」と表示します。 マルチタイムフレーム :M5、M1

Alpha Trading Analyst M15 Overview: An advanced market analysis tool designed specifically for the 15-minute (M15) timeframe. Instead of automated trading, it analyzes real-time price movements, EMA levels, and market momentum to display clear, actionable trading signals directly on the chart. Key Features: Probability Percentage Indicator: Real-time dynamic calculation showing buy and sell probability percentages based on current market strength. EMA Level Tracking: Continuously monitors ke

Sniper Spike Detector は、合成指数向けに作られたスキャルピング用インジケーターです。Deriv のすべての Boom・Crash 指数と、Weltrade の PainX・GainX に対応しています。確定したローソク足にのみ買い・売りの矢印を表示するため、シグナルが出た後に動いたり消えたりすることはありません。Boom と GainX では買いのみ、Crash と PainX では売りのみを表示するので、スパイクの方向と逆のトレードが表示されることはありません。さらに、各シグナルのエントリー、テイクプロフィット、ストップロスを描画し、チャート上の勝率を自動で集計するため、取引する前にそのペアでの成績を確認できます。1分足チャート向けに設計されています。 ユーザーガイド | お問い合わせ
このインジケーターをご購入いただくと、 Sniper Trend が 無料 で付属します。内蔵されており、チャートに自動で読み込まれるため、別途ダウンロードやインストールは不要です。
Sniper Spike Detector の特長 リペイントしません。シグナルはローソク足

Gold Volatility Levels answers the questions every gold trader asks before an entry: how far can price realistically move today, where is a sensible stop, and is the current spread worth it? What you get on the chart: ATR risk ruler. Choose the ATR timeframe and period; stop-distance multipliers and reward multiples (R) are drawn for both directions, updating with the current market. Average Daily Range. Mean or median of completed days, with projected upper/lower ADR levels and how much of toda

USER MANUAL: TDI OPTIMIZED BY MARSU (MT5) 1. Introduction: TDI Optimized by Marsu is a super indicator developed specifically for the MetaTrader 5 (MT5) platform. Upgraded from the classic Traders Dynamic Index (TDI) system, this version brings a fresh perspective with its excellent noise signal removal capabilities, direct optimization on Japanese candlesticks (lighter and smoother), and especially its Auto Timeframe system that automatically adapts to all trading styles. The indicator pr

SD Zones MTF Dashboard is a chart-analysis tool for MetaTrader 5 that automatically marks supply and demand zones and shows the trend of four timeframes in a compact on-chart panel. WHAT IT DOES - Detects supply and demand zones from confirmed swing pivots. - Keeps only zones that were followed by a real impulse move (measured in ATR), so weak levels are filtered out. - Extends active zones to the right and removes them once price closes beyond them (optionally shows broken zones as outlines). -

Nexum Veritas: market structure, zones, liquidity and a price projection tool on your MT5 chart. Nexum Veritas draws the Smart Money Concepts structure of the market from one consistent pivot chain that never repaints , shows the zones, levels and liquidity that SMC traders read, and lets you sketch the path you expect on the chart. Optionally it marks four classic SMC setups as a learning aid. It is a tool to read the market and plan your own trades, not a signal service. MARKET STRUCTURE Pivot

NexusFlow MTF Pro — The Ultimate Multi-Timeframe Power for MetaTrader 5 Tired of trading on the M5 or M15 timeframe only to realize too late that the H1 or H4 trend was completely against your entry? Lost count of how many times you had to open multiple windows, constantly switch charts, or clutter your screen with confusing indicators just to align the market direction? NexusFlow MTF Pro was engineered specifically to eliminate this operational friction and elevate your flow and trend analysis.

MSB Pro SMC Gold は、Smart Money Concepts の主要ツールをチャート上に描画し、新しいバーごとに更新します。XAUUSD(ゴールド)向けに設計・検証されており、すべての銘柄と時間足で動作します。
すべての計算は確定したバーのみで行われます。一度描画されたシグナル、BOS/CHoCH、Order Block、FVG は、後のバーで削除されたり描き直されたりしません。スイングポイントは、スイングを使うすべてのツールと同様に、右側の確認バーが確定した時点で確定します。
マーケットストラクチャー - 左右の確認本数を調整できるスイング高値・安値(HH / HL / LH / LL ラベル付き) - BOS(継続)と CHoCH(性質の変化)のラインとラベル - ブレイク判定は終値(初期設定)またはヒゲ - 現在のトレンド:上昇 / 下降
ゾーン - Order Block:ストラクチャーがブレイクされるたびに作成されます。高さは ATR で制限されるため、長いヒゲのバーで過大なゾーンが作られることはありません。初めてタッチされると「(m)」が付き、

Mavin SMC Pro is a Smart Money Concepts indicator for MetaTrader 5 designed to help traders analyze market structure and price action. Features include: Major and minor market structure Break of Structure (BOS) and Change of Character (CHoCH) Order Blocks (OB) Fair Value Gaps (FVG) Liquidity levels Strict BUY and SELL signals H4, H1 and M15 directional bias dashboard The indicator provides visual analysis tools to support your own trading decisions. It does not guarantee profitable results. Alwa

THV Key SRs and TrendLines MT5
Automatically Identify Key Swing Highs, Swing Lows, Support, Resistance, and Trendlines on MetaTrader 5. THV Key SR and Trend Line MT5 is a technical analysis indicator designed to help traders identify important market swing points and visualize potential support and resistance levels. The indicator detects Key Highs and Key Lows using a configurable Pivot setting, draws optional support and resistance lines, and connects recent swing points with upper and lower

Swing Range High Low — 4-Level Market Structure & Range Automatic swing highs/lows with confirmed level lines and a price range channel. Clean structure, no repaint option, alerts and push. Full description Swing Range High Low is a chart indicator that marks confirmed swing pivots and turns them into four readable price levels: the last confirmed Swing High, the last confirmed Swing Low, and the upper/lower boundaries of the working range. What it draws Element Meaning Red arrow Confirmed Sw
Chart Pattern Navigator MT5 Overview Chart Pattern Navigator MT5 is a technical analysis indicator designed to automatically detect, classify and visualize classic chart patterns directly on your MetaTrader 5 charts. It helps traders identify potential market structures, monitor pattern development and evaluate possible trading scenarios without having to draw every formation manually. The indicator combines pattern recognition, configurable breakout and retest logic, projected entry levels, st

Market State Reader reads the chart the way a price action trader does and writes the result on the chart in plain words: is this a trend or a trading range, who is in control (bulls or bears), did the last breakout follow through or fail, where is the gap, where is the measured-move target, and what is worth looking for on the next bar. It works on closed bars only, so nothing repaints. It was built for intraday index trading (DAX, US500, Nasdaq) on M5, but it runs on any symbol and timeframe.

SVP Session Volume Profile HD for MT5 SVP Session Volume Profile HD is a session-based volume profile indicator for MetaTrader 5, styled after TradingView’s “Session Volume Profile HD”. It shows where volume traded during each session, so you can see the price levels the market accepted and rejected. How it works For each session, the indicator loads high-resolution data (M1 by default) and spreads each bar’s volume across its price range. The result is a detailed histogram, with up and down vol

Gf Macd Ma Cross Divergence Product Description Gf Macd Ma Cross Divergence is a technical analysis indicator designed to help traders identify potential buy and sell opportunities in the financial markets. It combines three popular trading tools: MACD, Moving Average (MA) Cross, and Divergence to help traders understand market momentum, spot possible trend changes, and identify potential entry points. Key Features MACD Signals: Helps traders assess market momentum and identify potential bullish

VWAP Sessions: Session-Anchored VWAP for MetaTrader 5 VWAP Sessions plots a separate volume-weighted average price for each major trading session, directly on your chart. Each VWAP starts fresh when its session opens and ends when the session closes, so you see where each session’s average traded price sits rather than one continuous line that blends everything together. What it does Plots up to 3 independent session VWAP lines at once Defaults to Asia, London and New York, with every start and

Multi-timeframe high-resistance liquidity-zone identification — combining a union of multiple methods + multi-timeframe confluence + strength scoring to mark the key levels where price is most likely to reverse after sweeping liquidity . 01 Purpose & Positioning A liquidity-zone visualization indicator built for domestic futures (MT5/CTP) and forex (MT4/MT5), helping traders quickly lock onto: Genuine High-Resistance Zones Scores "multi-timeframe confluence + volume participation/a

このインジケーターの用途 MetaTrader 5 のチャート上に、あなたのトレード結果を表示するパネルを表示します。データは口座の取引履歴から取得され、取引は行いません。次の問いに答えます: 今日、昨日、一昨日、今月、今年、いくら稼いだか、または失ったか? どの通貨ペアでプラスになっていて、どの通貨ペアでマイナスになっているか? どの時間帯(ブローカーのサーバー時間)に取引が利益を生み、どの時間帯に損失を生むか? 最大ドローダウンはいくらだったか? 多くの通貨ペアで同時に EA(エキスパートアドバイザー)を使って取引する場合に特に便利です。1 つの画面で、どの通貨ペアが機能していて、どの通貨ペアが口座を押し下げているかが分かります。 パネルに表示される内容 メインテーブル。 各通貨ペアごとに:取引数(Deals)、純利益(Net、手数料とスワップを含む)、勝率(Win %)、プロフィットファクター(PF、利益を損失で割ったもの。1 より大きければ良好。「inf」は損失がまったくないことを意味します)、現在のスプレッド。 合計。 TOTAL 行と、Today、Yesterday、2 d

Quantum Trade Signals — Advanced Trading Indicator All-in-One Professional Trading Indicator! Quantum Trade Signals combines multiple trading strategies, Smart Money Concepts (SMC), and advanced technical analysis to identify potential trading opportunities. Key Features: Advanced BUY & SELL Signals Intelligent Signal Scoring System Multiple Trading Strategies BOS, CHoCH & Liquidity Sweeps Trend & Market Structure Analysis Breakout & Retest Detection Suggested Stop Loss & Ta

LONDON SWEEP iFVG INDICATOR
MT5 Trading Indicator Trade the London Liquidity Sweep. Catch the Inversion. Target the Next Move. The London Sweep iFVG Indicator is an advanced MetaTrader 5 trading tool designed to help traders identify potential reversal opportunities during the London trading session using liquidity sweeps, Fair Value Gaps (FVGs), and inverse Fair Value Gap (iFVG) confirmation. Instead of relying on random entries or chasing candles after a strong move, the indicator follows

Level 3 Sweep Indicator Stop buying the first bounce. Trade the second fake-out. Most traders enter right after liquidity is taken, then watch price dip again and stop them out. 3rd Level Sweep waits for the move that comes after the trap. It scans for the sequence where smart money clears the early entrants before the real move starts.
The 6-step sequence it looks for External liquidity sweep: old highs or lows get taken. Higher-timeframe FVG delivery: price reacts from an M15, M30 or H1 fair

Liquidity Sweep Reclaim Atlas Liquidity Sweep Reclaim Atlas is a MetaTrader 5 price action indicator that identifies potential liquidity sweeps around confirmed swing highs and swing lows. It highlights candles that move beyond an established swing level and close back inside it, helping traders examine breakout rejection and price reclaim behavior on their charts. The indicator also offers optional follow-through confirmation, configurable volatility and wick filters, active swing reference lev
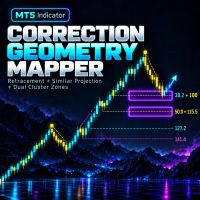
TOOLFORGE CORRECTION GEOMETRY MAPPER — MT5 インジケーター リトレースメントを描画。類似調整を投影。重複ゾーンを可視化。
ToolForge Correction Geometry Mapper は、MetaTrader 5 用の裁量分析インジケーターです。トレーダーが指定したフィボナッチ・リトレースメントと、過去に選択した参考調整の投影を組み合わせます。有効なリトレースメント水準と有効な Similar 投影水準が設定した許容範囲内で近接すると、その重なりを紫色の分析ゾーンとして表示します。これは追加の確認を探すための範囲であり、自動売買シグナルではありません。
動作の仕組み
1. RETRACEMENT:チャート上で値動きのインパルスを指定します。初期設定で有効な水準は 38.2% と 50.0% です。61.8% は任意で有効化できますが、初期状態では無効です。 2. SIMILAR:過去の参考調整と新しい調整の開始地点を指定します。初期設定の投影水準は 100%、115.5%、127.2%、141.4% です。161.8% は任

ATS Round Number Cascade Stats は、お使いのブローカーの価格履歴を使い、ご自身のシンボルで価格がキリ番(ラウンドナンバー)を通過した後にどう動いたかを測定します。結果はチャートの隅のパネルに表示され、レベルはチャート上に線で描かれます。 多くのトレーダーはキリ番を反応しやすい価格帯として注目しています。このインジケーターは、それが意味を持つとは仮定しません。通過のたびに何が起きたかを数え、ランダムに選んだレベルと比較します。 測定内容 直前の 3 時間に価格が反対側で少なくとも 1 ATR 離れていて、その後通過していない状態での、キリ番レベルの最初の通過。このようなレベルを "armed" と呼びます。 ATR は Average True Range の略で、15 分足 1 本の典型的な大きさです。すべての距離をこの単位で表すため、異なるシンボルを比較できます。 通過から 15 分、30 分、60 分後の価格の位置(通過方向で測定)。 価格が逆方向に 1 ATR 動く前に、通過方向へ 1 ATR 動いた頻度。 ランダムなレベルについての同じ数値:レベル

A Chart-style Long/Short Position tool for MT5. Drag entry, take profit and stop loss directly on the chart, see the risk/reward ratio and the lot size calculated from your risk % instantly. Green TP zone, red SL zone, clean English labels, and a round on-chart button to show or hide the tool. Purely visual - it never opens, modifies or closes orders. Plan trades on MetaTrader 5 visually, directly on the chart. Place the box, drag the levels, and read the price, RR and position size at a glance.

Model S/R + Rotation + Sessions One overlay. Three engines. No repaint Indicator A professional analytical indicator that combines historical Support/Resistance with strength scoring , a rotation trend channel with live angle readout , and a session engine with countdown monitor — all rendered natively on the MT5 chart with zero external dependencies. What It Does Engine Output S/R Engine Auto-detected historical bands, colour-coded (RES/SUP), tagged xN touches and strength % (0–100). Strongest

Вот профессиональный перевод описания индикатора на английский язык, полностью оформленный и готовый для публикации на площадке MQL5 Market : ADX-Trend Pro MTF — Professional Trend Indicator for MetaTrader 5 ADX-Trend Pro is a modern, high-tech tool for comprehensive market analysis designed to identify strong, sustainable trends and filter out market noise (flat ranges). The indicator combines classic moving average analysis, a powerful ADX/DI trend strength filter, and dynamic ATR-based volati

Neuron Chart is a complete charting workspace for MetaTrader 5 from Neuron Systems. It turns the standard chart into a modern, web-style workspace: a top toolbar, a drawing toolbar on the left, a panel bar on the right, indicator panes inside the chart, price alerts, bar replay, a watchlist, a screener, the economic calendar and more, all on the chart you already use. It is an indicator for chart analysis only: it draws on the chart, it does not place, modify or close trades, it does not send or

HD Candels Chart – Ultra-Light MT5 Chart Controller HD Candels Chart is a lightweight MetaTrader 5 indicator designed to let traders switch chart styles and customize their chart appearance instantly with simple on-chart buttons. Key Features Line Chart Toggle: Quickly switch to Line Chart mode and toggle between Parrot Green and Black line colors. HD Chart Mode: Apply a professional TradingView-inspired dark slate theme with teal bullish candles, coral bearish candles, and a clean chart backgro

See at a glance where you are in the trading day. QuantEdge Sessions & Levels draws the Asia, London and New York sessions, the levels every trader watches, and the breakouts of the Asian range - with arrows that never repaint.
Sessions done right - Asia, London and New York boxes from their high to their low, with the size in pips - Each session is set in the local time of its city (Tokyo, London, New York): summer and winter time changes are handled automatically, including the weeks when Eur

MV Support & Resistance (SNR) Indicator MT5 The Support & Resistance (SNR) Indicator helps traders identify important price levels where the market may experience a price reversal, rejection, or breakout. Support and resistance levels are useful for understanding market structure, identifying potential entry opportunities, and planning trading strategies. Understanding Support & Resistance Green Line – Resistance Resistance is a price level where selling pressure may increase, potentially cau

Pattern Oracle is an all-in-one chart pattern engine for MetaTrader. It scans three zigzag levels at once, finds more than 30 harmonic, chart, continuation and reversal patterns, scores every setup and draws a complete trade plan with entry, stop-loss and two take-profit levels. A built-in teaching mode explains every pattern right on the chart. Pivots are only used once they are confirmed and every decision is made on a closed bar, so signals do not repaint . Patterns detected Reversal : Double

Quantum Edge is a machine-learning trend and signal indicator for MetaTrader. It combines a Lorentzian-distance k-nearest-neighbours classifier, a rational-quadratic kernel regression cloud and a multi-timeframe trend filter into one clean chart tool, then turns the result into clear, tiered BUY and SELL setups with ready-made stop-loss and three take-profit levels. Every signal is calculated on closed bars only . Once a label appears on the chart it stays exactly where it is: no repainting, no

LQ NEWS SCANNER — GOLD IMPACT & HISTORICAL EDGE Understand the news. Read the reaction. Discover the edge. Economic releases can create some of the most volatile moments in the Gold market. But knowing when the news is released is only part of the picture. Understanding its potential implications and examining how Gold has reacted to similar events can provide valuable context for your trading decisions. LQ News Scanner brings economic news monitoring, fundamental interpretation and historical

Ultimate Gold Scalper Ultimate Gold Scalper is a MetaTrader 5 indicator designed to present structured short-term XAUUSD trading setups directly on the M1 and M5 chart. It combines multi-timeframe market filtering with clear entry, stop-loss, and take-profit visualization. If the indicator does not appear on your chart, simply right click anywhere on the MT5 chart screen and select Refresh
Key Features BUY and SELL setup detection Clearly marked Entry, Stop Loss, and Take Profit levels Fixed 1:

How many CRT opportunities are missed while you are watching another chart or timeframe? The Candle Range Theory Indicator monitors three configurable timeframes simultaneously and brings qualifying bullish and bearish CRT setups directly to your current chart. Spend less time switching between charts and more time evaluating structured trading opportunities.

Crypto_Forex MT5用インジケーター「 Major_Trend_Histogram 」、リペイント機能なし。 - Major_Trend_Histogramインジケーターは、非常に大きなトレンドを捉えるために設計されています。 - インジケーターは2色で表示可能:ピンクは弱気トレンド、緑は強気トレンド(色は変更可能)。 - トレンドの初期段階を検知します。標準的なMAよりもはるかに効率的です。 - Major_Trend_Histogramは、プライスアクション、VSA、その他のインジケーターなど、他の取引手法と組み合わせることができます。 - インジケーターにはモバイルとPCの両方でアラートが利用できます。 Click here to see high quality Trading Robots and Indicators! これは、このMQL5ウェブサイトでのみ提供されるオリジナル製品です。

Mega MNFM MT5
Mega MNFM brings ten technical readings, a seven-timeframe trend map, regional session clocks and account-deal statistics into one MetaTrader 5 dashboard.
Technical dashboard RSI, MACD histogram, Stochastic, EMA trend, ADX, Bollinger Bands, an asset technical Fear & Greed proxy, an indicative synthetic dollar basket, ATR rank and OBV flow. Readings use completed candles. The timeframe map covers M1, M5, M15, M30, H1, H4 and D1. The dashboard includes a directional summary, trend

️ UTS Prime Zones — The Ultimate Multi-Timeframe Support & Resistance Engine UTS Prime Zones is an advanced, institutional-grade indicator that automatically maps out the most critical Support and Resistance zones across two different timeframes simultaneously . Stop drawing lines by hand. Stop guessing where the market will reverse. UTS Prime Zones uses a sophisticated fractal and ATR-based algorithm to identify high-probability "zones" (areas, not just single lines) where price is highly l

THV Camarilla Pivot MT5 – Reversal, Breakout & Target Levels
Overview THV Camarilla Pivot MT5 is a technical indicator that automatically calculates and displays Camarilla Pivot levels on your MetaTrader 5 chart. Based on the previous candle of the selected timeframe, the indicator plots eight key levels: H3, H4, H5, H6, L3, L4, L5, and L6. These levels help traders identify potential reversal zones, breakout areas, and price targets. The indicator also provides customizable line colors, styles

Crypto_Forex MT5用インジケーター「 MFI Speed 」(リペイント機能なし) - このインジケーターの計算は物理学の方程式に基づいています。MFI SpeedはMFI自体の1階微分です。 - Money_Flow_Index (MFI)は、価格と出来高データを用いて売られ過ぎと買われ過ぎのゾーンを特定するテクニカルオシレーターです。 - MFI Speedは、主要トレンドの方向へのモメンタムエントリーをスキャルピングするのに適しています。 - 適切なトレンドインジケーター(例えば、標準EMA(画像参照)など)と組み合わせて使用してください。 - MFI Speedインジケーターは、MFI自体がどれだけ速く方向転換するかを示します。非常に敏感です。 - MFI Speedインジケーターの値が0未満の場合、速度は負です。値が0より大きい場合、速度は正です。 - インジケーターにはモバイルとPCのアラートが組み込まれています。 高品質のトレーディングロボットとインジケーターをご覧になるにはここをクリックしてください! これは、このMQL5ウェブサイトでのみ提供される

THV SMC Plus MT5 – Smart Money Concepts & Multi-Timeframe Analysis
Overview THV SMC Plus MT5 is a comprehensive Smart Money Concepts (SMC) indicator designed to help traders analyze market structure, identify potential liquidity zones, and recognize high-probability trading setups directly on MetaTrader 5. The indicator combines multiple price-action and institutional trading concepts into one customizable tool, including Break of Structure (BOS), Change of Character (CHoCH), Order Blocks (OB)

Inversion FVG は、フェアバリューギャップ(3本のローソク足による不均衡)を検出し、そのギャップが機能しなくなった瞬間を狙うインジケーターです。ローソク足の実体がギャップを越えて終値を付けると、ギャップは「反転」し、サポートまたはレジスタンスになります。価格が再テストして反発(拒否)されると、矢印とともにエントリー、ストップロス、TP1、TP2 の水準が表示されます。
仕組み 1. 強気または弱気の FVG を検出し、通常のゾーンとして描画します。 2. ローソク足の実体がゾーンを越えて終値を付けると、ゾーンが反転します。 3. 最初の再テストと拒否の終値 = シグナル矢印(青の上向き = 買い、赤の下向き = 売り)。 4. ストップはゾーンの外側に ATR の余裕を加えて置きます。TP1 と TP2 は R の倍数(初期値 1R と 2R)です。
機能 - 確定した足のみで判定:矢印は再描画されず、足が確定した後に動きません。 - エントリー、SL、TP1、TP2 のラインは価格が到達した時点で止まります。 - 50%(CE)ライン、情報パネル、有効ゾーン数の表示

Elliott Wave Auto Count は、エリオット波動を「基本度数とその上の3つの度数」の計4階層で同時に自動カウントする MT5 用インジケーターです。『エリオット波動入門』(Frost & Prechter)のルールとガイドラインに沿って波を数え、現在の波について価格×時間の目安ゾーンと否定ラインも表示します。
しくみ 1. スイング:ATR(100) を基準にした5本のジグザグを使います。上の度数ほど大きな値幅で転換を認識します。いちばん細かいジグザグは表示せず、各波の内部の波数を数えるためだけに使います。 2. パターンの当てはめ:度数ごとに、最近の転換点をインパルス、ダイアゴナル(リーディング/エンディング)、ジグザグ、フラット(レギュラー/エクスパンデッド/ランニング)、トライアングル(収縮/バリア/ランニング/拡大)、ダブルジグザグ、ダブルスリー、トリプルスリー、最新の波の「進行中」パターンに分けます。 3. 絶対ルールは必ず守ります:「2波は1波の始点を割らない」「3波は最短にならない」「インパルスの4波は1波に重ならない」などに反するカウントは採用

Zone Risk Planner turns support and resistance zones into a complete trade plan: where to enter, where to place the stop loss (SL), where the take profit (TP) goes and how many lots match your risk. It also shows the risk of your whole account, the market regime on several timeframes and a multi-symbol scanner, all in one indicator.
It is a planning and risk-management tool. It does not give buy or sell signals and it does not open, modify or close trades.
Support and resistance zones
- Calcu

Dow Structure MTF は、ダウ理論のトレンド判定を5つの時間足で同時に行う MT5 用インジケーターです。日本で一般的な「押し安値・戻り高値」の考え方で、各時間足が上昇・下降・レンジのどれか、どの価格を抜けると転換するか、現在値がそこからどれだけ離れているかを表示します。判定は確定した足だけで行うため、確定した判定が後から変わること(リペイント)はありません。
表示されるもの ・5つの時間足の表(初期値 M15・H1・H4・D1・W1、変更可):方向、押し安値/戻り高値、直近の確定足の終値からの距離(FX は pips、GOLD・指数などは価格差)と、その時間足の ATR(14) の何倍か ・詳細表(コンパクト表示オフ):直近の転換が何本前か、その根拠、まだ確定していないスイングの候補(確定待ち) ・水平線:チャートの時間足と、上位の時間足(初期値は近い順に3つ)の押し安値・戻り高値 ・転換の根拠ラベル(例:「↓ 押し安値 158.102 を終値で割った」) ・スイング高値・安値の HH/HL/LH/LL ラベル ・チャートの文字・表・アラートは日本語/英語を切り

Fibo Price Time Zones は、フィボナッチの価格の目安と時間の目安を掛け合わせ、チャート上に箱(価格×時間のゾーン)として描く MT5 用インジケーターです。「どの価格帯を、いつごろ意識するか」を整理できます。複数の波や上位の時間足の箱が重なる場所は、3段階で強調します。起点の波は確定したスイングだけで決めるため、確定した箱は後から動きません(条件は下の「ご注意」をご覧ください)。
描くもの ・価格の目安:戻り 38.2/50/61.8/78.6%、伸び 100/127.2/161.8%(それぞれオン/オフ可。初期値は 78.6% と 127.2% がオフ) ・時間の目安:起点の波の本数 × 0.382/0.618/1/1.618 本先(初期値は 0.382 がオフ) ・箱:価格の目安 ± ATR(14) の幅 × 時間の目安 ± 数本の幅 ・重なり:チャートの時間足と上位の時間足(初期値は自動で2段上)の箱が、価格・時間とも重なる場所を3段階で強調 ・見やすい初期表示:直近の波と、重なりのある箱だけ。全部表示・重なりのみ・直近の波だけにも切り替え可 ・伸びの

Gold Compass Lite is a premier multi-timeframe trend and signal system engineered specifically for XAUUSD (Gold) on the M15 chart . It acts as a comprehensive diagnostic dashboard, synchronizing momentum while shielding your capital. ️ THE UNFAIR ADVANTAGE Unlike 99% of indicators that print delayed arrows based on simple moving averages, Gold Compass Lite features an advanced, data-driven Fair Value Gap (FVG) probability model tested on over 20,000 historical gaps. It automatically calculates

AURUM Line Alerts [SNAP] [Please leave a review if you find the indicator useful and how we can improve it further] Description AURUM Line Alerts gives you four horizontal price alert lines that place themselves on the levels where price has repeatedly turned. Instead of drawing lines by hand and setting alerts one by one, attach the indicator and the lines appear on the strongest aligned tops and bottoms: two above price and two below. Drag any line to a new price at any time, and its alert re-

Stoch Zone Pro は、 単なる一般的なオシレーターではなく、 チャート上に直接表示される完全な分析ステーションです。 従来の平均回帰(ミーン・リバージョン)のメカニズムを採用しつつ、 その最大の問題点である「強いトレンド相場における大量のだまし(フォルスシグナル)」を解決しました。 内蔵された独自の Advanced Trend Filter (高度なトレンドフィルター)アルゴリズムにより、 インジケーターは隠れた相場のモメンタムを継続的に分析します。 価格の反転が主要なトレンドと完全に同調している場合にのみ、 シグナルを受信できます。 主なメリット: トレンドインパルスフィルター (Pulse Filter): 内部(バックグラウンド)で機能するスマートな数学的コアが、 トレンドに逆らうシグナルを厳格にブロックします。 相場が急落している場合、 インジケーターは売られすぎゾーンからの抜け出しを無視し、 「落ちてくるナイフ」を掴むのを防ぎ、 ストップロスを守ります。 インタラクティブなコントロールパネル: チャート上で直接、 ワンクリックで期間の変更、 取引ゾーンの拡大・縮

EN
LumenSMC draws Smart Money Concepts zones, structure and teaching drawings where you click. It does not find zones by itself, does not trade and gives no signals.
What you can build
- SMC zones: Order Block (bullish/bearish), Order Block with sweep, Fair Value Gap with a 50% CE line, Liquidity and EQH/EQL.
- Structure: Swing (HH/HL/LH/LL), BOS/CHoCH, Premium/Discount with a 50% line, Fibonacci, R:R box.
- Drawing: line, rectangle, triangle, ellipse.
- Patterns: zigzag, Head and Shoul

Gold Xauusd Structure Compass Mt5 is a MetaTrader 5 indicator designed for discretionary gold trading analysis. It identifies sweep-and-reclaim and trend-pullback setups on XAUUSD, combining closed-candle confirmation, completed context candles and volatility filters. The indicator brings setup markers, market context and reference stop-loss and take-profit levels into one chart interface. It supports manual decision-making and does not open or manage trades. Two setup models The sweep-and-recla

Time Average Lines(時間平均線)は、足の「本数」ではなく「時間」で平均する4本の線を表示する MT5 用インジケーターです。時間足を切り替えても、同じ時間の長さで平均を見られます。中心となる③は、過去の同じ時刻に「その日の始値からどれだけ動いていたか」を平均した線で、今日の残りの時刻は、その平均をつないだ点線(道筋)で表示します。道筋は過去の平均をまとめたもので、予測ではありません。
4本の線 ・① 時間MA:直近N分(初期値60分)の間に始まった足の終値の平均。1分足でも15分足でも「直近60分」の平均です ・② TWAP:区切りの時刻からの各足の(始値+高値+安値+終値)÷4 の平均。区切りは 日(初期値)/週/東京 09:00/ロンドン 08:00/ニューヨーク 08:00。ロンドン・ニューヨークは英国・米国の夏時間を反映します ・③ 同時刻平均:その日の始値 + 過去N回(初期値20回)の同じ時刻の「終値 − その日の始値」の平均。日中足だけで表示します ・④ 時間EMA:経過した時間で重みが半分になる指数平均(初期値 半減期30分)。週末などで時間が

QPC OSCILLATOR | INSTITUTIONAL TARGET AND VOLATILITY ENGINE
Precision Quantitative Trading System with Real-Time Dynamic Target Projections (ENTRY, SL, TP1, TP2, TP3)
OVERVIEW
QPC OSCILLATOR is a professional institutional-grade quantitative indicator engineered for MetaTrader 5. Built for discerning traders who demand mathematical precision over emotional guesswork, QPC Oscillator dynamically identifies structural market turning points, high-probability momentum breakouts, and trend exhaus

Multi MA Ribbon Crossover and Pullback This indicator draws nine exponential moving averages as one ribbon on the price chart. Every line is coloured by its own slope, so the ribbon shows at a glance which part of the trend is still rising and which part has already turned. On top of the ribbon it marks two kinds of signals: a crossover of the fastest line with the main line, and a pullback to the main line inside an established trend. All signals are confirmed on closed bars only. How The Ribbo

Auto Trendline Channel MTF(自動トレンドライン・チャネル MTF)は、確定した高値・安値(スイング)から、トレンドライン・チャネル・水平線を自動で引く MT5 用インジケーターです。線ごとにタッチ回数、終値での抜け、ヒゲ抜け、リテストを記録し、チャートの時間足と上位2つの時間足について、上下で一番近い線までの距離とダウ理論の向きを表で表示します。 タッチ回数や抜けの記録は、過去のチャート上で起きたことを数えたものです。今後その線で止まる・抜けるといったことを示すものではありません。
主な機能 ・トレンドライン:上下それぞれ2本まで(タッチ回数の多い順) ・チャネル:上下それぞれ1位の線に、平行な線を1本 ・水平線:直近300本の高値・安値をまとめた水準を、価格の上下それぞれ3本まで ・抜けの記録:終値での抜けは×印、リテストは印。抜けた線は破線で残します ・マルチタイムフレームの表:チャートの時間足+自動で上位2つ(例:15分足なら30分足・1時間足)。上下の一番近い線、距離(FX は pips)、タッチ回数、ダウの向き ・アラート:トレンドライン・

This indicator automatically detects and visualizes Fair Value Gaps (FVGs) from a user-selected timeframe directly on your MetaTrader 5 chart. It plots color-coded rectangles to highlight unmitigated bullish and bearish gaps, dynamically shrinking or removing these zones in real-time as ongoing price action fills them. Crucially, it allows you to project higher timeframe gaps onto lower timeframe charts—such as viewing a 1-hour FVG on a 5-minute chart or a 4-hour FVG on a 1-minute chart—making i

MNFM Gold Conditions MT5
A read-only Gold/USD technical context indicator. It combines completed H1 and M15 candle readings with live spread information in one chart panel. It does not execute trades or estimate a probability of profit.
Dashboard - H1 direction from close versus EMA50, EMA50 versus EMA200, EMA50 slope and directional movement (+DI/-DI). - H1 ADX14 strength and whether the reading is rising or falling. - M15 momentum: three-bar close change normalized by ATR14, confirmed by RSI

This indicator automatically identifies and highlights the market's opening range by drawing a dynamic visual box around the highest and lowest prices formed during the initial minutes of the trading session, complete with a built-in alert system that notifies traders the moment price crosses these boundaries. Relying specifically on the 15-minute Opening Range Breakout (ORB) is a highly effective strategy because the first 15 minutes of the trading day absorb the chaotic influx of overnight ins

Market Structure は、後から決して変わらないルールで、あらゆるチャートのスイング、ブレイク、オーダーブロックを描き出し、4 つの時間足の方向が一致しているかをひと目でお知らせします。 信頼できるストラクチャー スイングの高値・安値をお好みの左右バー数で確定し、HH、HL、LH、LL、さらにオプションの許容幅付きで EQH/EQL とラベル表示 BOS(トレンド方向へのブレイク)と CHoCH(トレンドに逆らう最初のブレイク)を、ローソク足の終値またはヒゲで判定 リペイントなし:すべて確定したローソク足で判断し、スイングは確定バーの後に表示され、移動したり消えたりすることはありません。実際の XAUUSD 履歴で検証済み:1,200 本のバーで 763,711 回のバッファ比較を行い、変化は 0 件 ストラクチャーエンジンはユニットテスト済み(51 項目のチェック) ライフサイクルを持つオーダーブロック 各ブレイクから生成される需要ブロックと供給ブロック 価格がブロック内に戻ると色が薄くなり(ミティゲート済み)、ローソク足がブロックを抜けて確定すると削除されます 片側あた
MetaTraderマーケットはトレーダーのための自動売買ロボットやテクニカル指標を備えており、 ターミナルから直接利用することができます。
MQL5.community支払いシステムはMetaTraderサービス上のトランザクションのためにMQL5.comサイトに登録したすべてのユーザーに利用可能です。WebMoney、PayPal または銀行カードを使っての入金や出金が可能です。

取引の機会を逃しています。
- 無料取引アプリ
- 8千を超えるシグナルをコピー
- 金融ニュースで金融マーケットを探索