Konstantin Chechnev
Konstantin Chechnev
4.2 (5)
  • Информация
7+ лет
опыт работы
18
продуктов
47
демо-версий
0
работ
0
сигналов
0
подписчиков
Software engineer в Eqorex RnD Studio
💻 01 / РАЗРАБОТКА ДЛЯ METATRADER
────────────────────────

Разрабатываю решения любой сложности — от индикаторов, торговых панелей и утилит до многоуровневых аналитических систем, советников, оптимизаторов и специализированных инструментов для исследования рынка.

Если торговую или аналитическую идею можно формализовать, её можно превратить в полноценный инструмент для MetaTrader.


⚙️ 02 / ЧТО МОГУ РЕАЛИЗОВАТЬ
────────────────────────

• автоматизацию торговых алгоритмов и стратегий;
• индикаторы и системы анализа рыночных данных;
• обработку тиков, ценовых потоков и статистики;
• оптимизацию и проверку торговых параметров;
• сложные интерфейсы, панели управления и визуализацию данных;
• нестандартную торговую и аналитическую логику под конкретную задачу.


🧩 03 / ОТ ИДЕИ ДО ГОТОВОГО ПРОДУКТА
────────────────────────

Работаю с проектом целиком — от идеи и математической логики до архитектуры, программной реализации, интерфейса, оптимизации производительности, тестирования и готового рабочего продукта.

Для меня хороший инструмент — это не просто работающий код. Он должен быть быстрым, понятным, стабильным, удобным в использовании и точно решать задачу, ради которой создавался.


🧭 04 / ОПЫТ — БОЛЕЕ 7 ЛЕТ
────────────────────────

Более 7 лет занимаюсь разработкой для MetaTrader и финансовых рынков.

За это время прошёл путь от небольших торговых алгоритмов до сложных исследовательских и аналитических систем.


💬 05 / ЕСТЬ ИДЕЯ ИЛИ ЗАДАЧА?
────────────────────────

Не обязательно заранее превращать идею в большое техническое задание.

Напишите мне в личные сообщения MQL5 и опишите задачу своими словами. Я помогу оценить её реализуемость, предложу оптимальный вариант реализации без лишних функций и заранее обозначу объём работ, сроки и бюджет.

Небольшие задачи стараюсь выполнять максимально оперативно. Сложные проекты разбиваю на понятные этапы и веду лично — от первого обсуждения идеи до готового результата.

На всех этапах вы общаетесь непосредственно с разработчиком, поэтому важные детали не теряются между обсуждением и реализацией.
Konstantin Chechnev
Konstantin Chechnev
🎚️ One sensitivity cannot describe every scale of market movement.

PulseScope Signal uses three independent contours with different sensitivities. Each contour analyzes impulse behavior at its own scale and follows its formation, development and weakening.

The three streams are not simply averaged. They are combined through proprietary multi-stage agreement, confirmation and adaptive-threshold logic.

PulseScope Studio therefore optimizes the parameters of the complete analytical architecture—not one coefficient from a standard indicator.

Different scales. Independent processing. One coordinated decision framework.

👉 PulseScope Studio:

https://www.mql5.com/ru/market/product/185833
Konstantin Chechnev
Konstantin Chechnev
⏳ Long optimization runs should not become all-or-nothing jobs.

Terminals are restarted. Workstations need maintenance. Some searches simply take longer on weaker hardware.

With Resume enabled, PulseScope Studio can continue an optimization after the terminal is restarted. The option is designed for long runs where preserving continuity matters more than pretending interruptions never happen.

🔒 Keep the workflow recoverable.
▶️ Return to the run.
🧭 Continue the search instead of rebuilding it from zero.

Serious analytical tools should be designed for real operating conditions—not perfect laboratory uptime.

👉 PulseScope Studio:

https://www.mql5.com/ru/market/product/185833
Konstantin Chechnev
Konstantin Chechnev
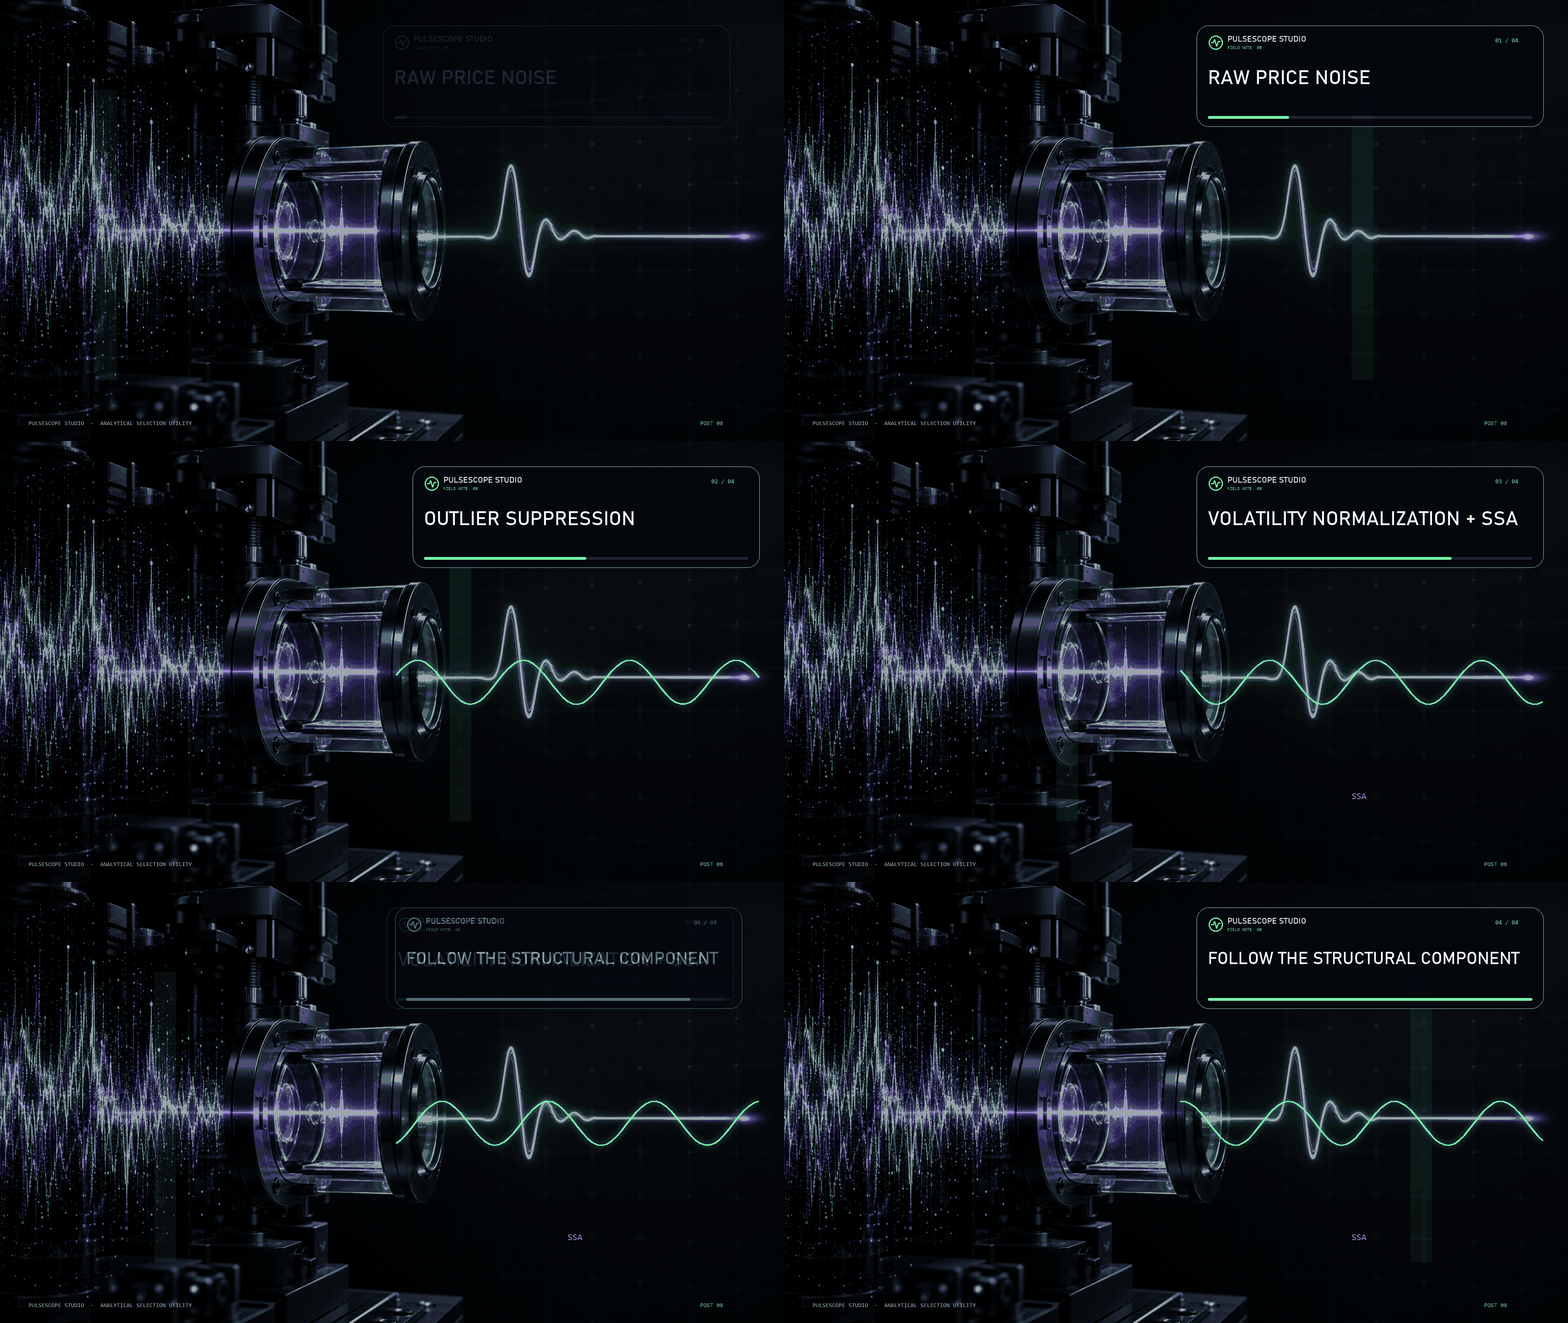
〰️ A sharp move can be information—or just an outlier. Treating both the same is an expensive analytical mistake.

Inside each PulseScope Signal contour, the price series passes through a dedicated processing chain that includes:
🧹 outlier suppression;
🧭 an estimate of fractal market structure;
⚖️ impulse normalization relative to current volatility;
🔬 SSA analysis and reconstruction of the price increments.

The objective is to separate a structural component of movement from random fluctuations before the multi-stage signal logic evaluates it.

PulseScope Studio optimizes this analytical architecture as a system—not as a cosmetic line on a chart.

👉 PulseScope Studio:

https://www.mql5.com/ru/market/product/185833
Konstantin Chechnev
Konstantin Chechnev
🌦️ Markets do not keep one rhythm forever. Volatility changes. Tempo changes. The structure of movement changes.

A configuration found on an older segment does not automatically remain suitable for a newer one. PulseScope Studio makes recalibration a controlled workflow:
📅 refresh the evaluation range;
🧬 launch a new adaptive search cycle;
🛰️ let parallel agents assess candidates;
🚫 filter weak and repeated directions as results accumulate.

The output is a newly selected set for the current symbol, timeframe and data context—not a promise about the future, but a disciplined way to respond when the market changes.

👉 PulseScope Studio:

https://www.mql5.com/ru/market/product/185833
Konstantin Chechnev
Konstantin Chechnev
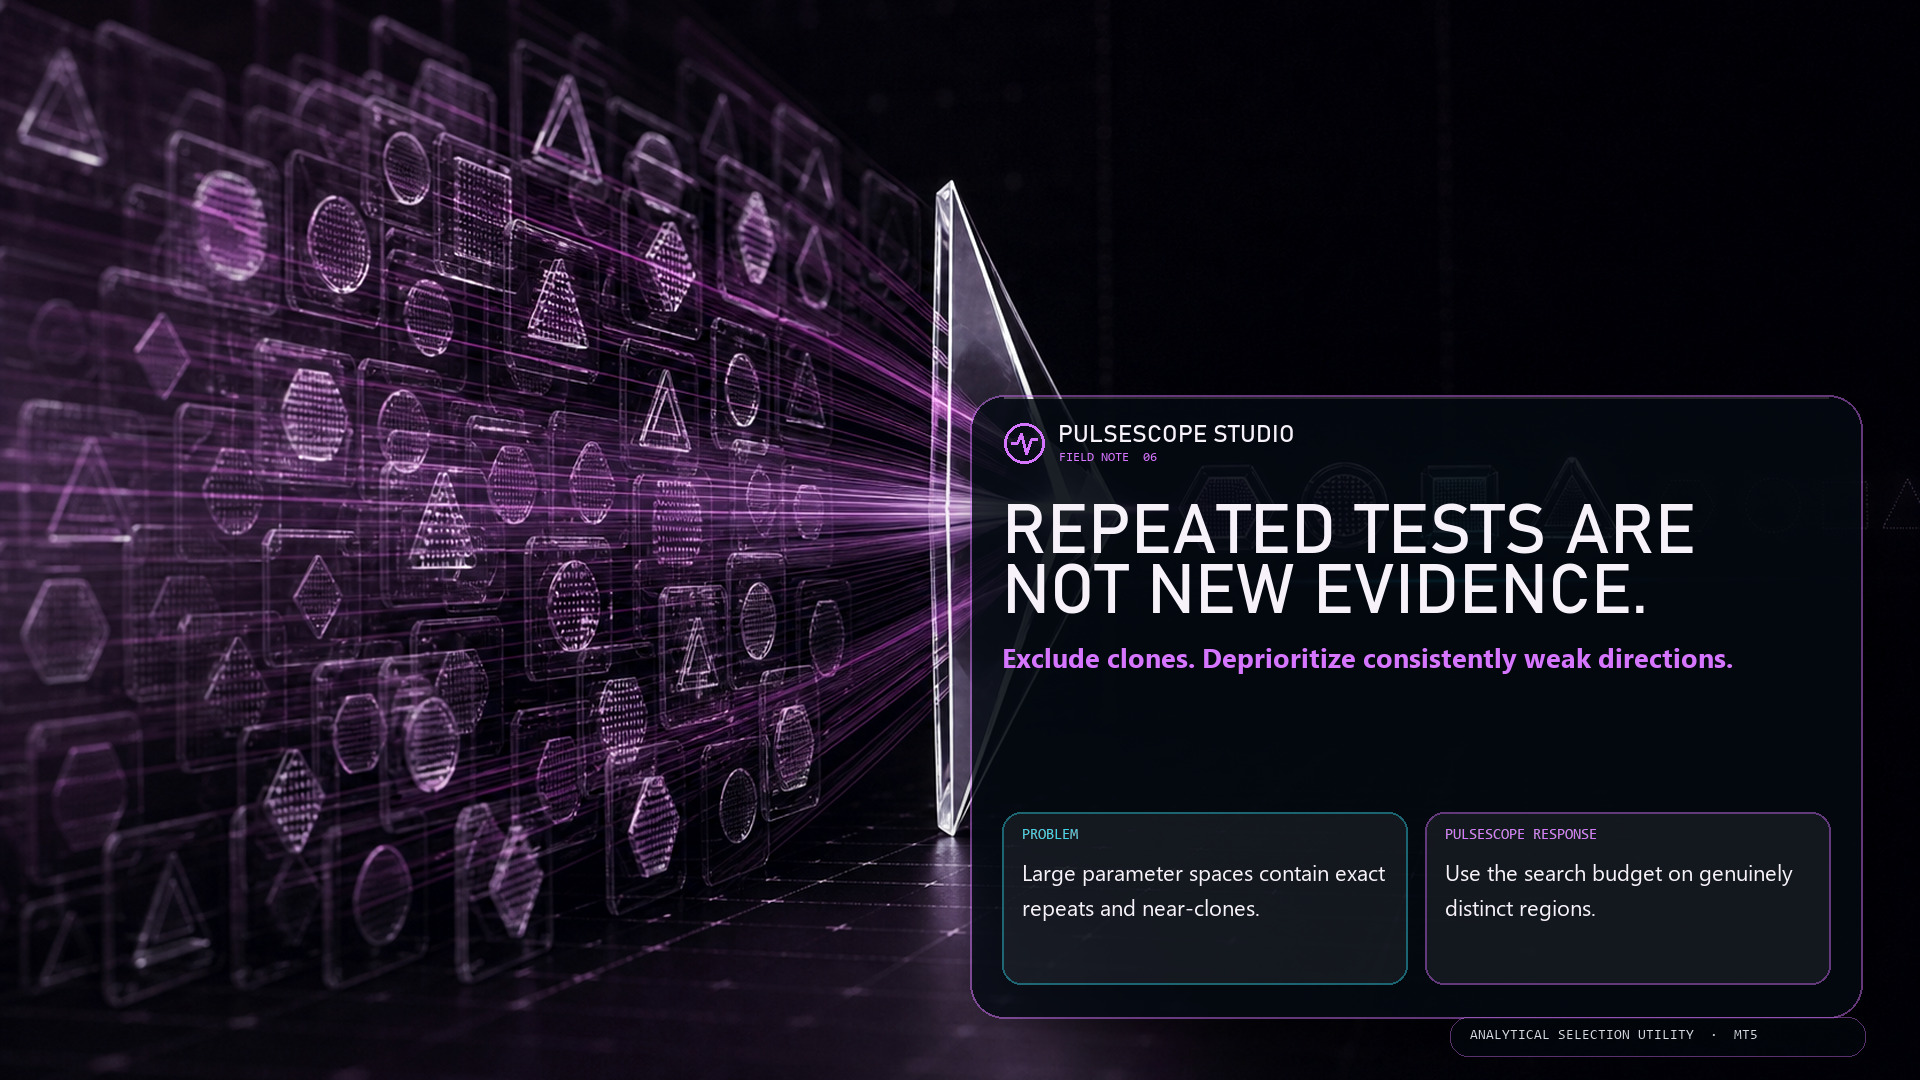
♻️ A larger search is not always a more informative search.

Parameter space can be crowded with exact repeats and nearly identical configurations. Testing the same neighborhood again may consume time without adding meaningful evidence.

PulseScope Studio keeps track of what has already been evaluated:
🚫 exact and near-duplicate variants are excluded;
📉 values that repeatedly lead to weak results lose priority;
🧭 exploration is redirected toward more distinct regions.

The objective is not to inflate the pass counter. It is to make each new evaluation contribute something new to the selection process.

👉 PulseScope Studio:

https://www.mql5.com/ru/market/product/185833
Konstantin Chechnev
Konstantin Chechnev
🛰️ A good search can still be slowed by a simple bottleneck: evaluating every candidate one after another.

PulseScope Studio can distribute evaluations across parallel agents running on separate charts. While candidates are being checked, the main dashboard coordinates status, progress and results in one workflow.

⚡ More evaluations can move at the same time.
🧭 The search logic remains centralized.
📊 Progress stays visible.

Parallelism is not magic—actual speed depends on the terminal, processor and selected workload. But it removes the one-chart-at-a-time limitation from the design.

👉 PulseScope Studio:

https://www.mql5.com/ru/market/product/185833
Konstantin Chechnev
Konstantin Chechnev
⚙️ Brute force treats every coordinate as equally interesting. The market rarely rewards that assumption.

PulseScope Studio uses adaptive genetic search instead of exhaustive sequential scanning:
🧬 stronger configurations survive into the next generation;
🔀 their parameters are recombined;
🧭 dynamic mutation redirects exploration into new areas;
🎯 directions that repeatedly remain weak lose priority.

The search does not restart blindly with every combination. It changes its focus as evidence accumulates.

👉 PulseScope Studio:

https://www.mql5.com/ru/market/product/185833
Konstantin Chechnev
Konstantin Chechnev
📉 A perfect backtest can be one lucky coordinate.

If performance disappears after a small parameter change—or on data that never participated in selection—you may have found a spike, not a stable regime.

PulseScope Studio adds two reality checks:
🧭 it explores neighboring configurations to look for a broader stable region;
🛡️ it recalculates promising candidates from scratch on an independent control period.

This does not predict the future. It helps stop one convenient historical fragment from earning more trust than it deserves.

👉 PulseScope Studio:

https://www.mql5.com/ru/market/product/185833
Konstantin Chechnev
Konstantin Chechnev
🚀 PulseScope Studio is now available on MQL5 Market

Finding an impressive historical result is easy.
Understanding whether it deserves your trust is much harder.

PulseScope Studio is not built to chase one “perfect” number. It is designed for a complete configuration selection workflow:

🧬 Adaptive genetic search
⚡ Parallel calculation agents
🛡 Separate validation on a control period
🚫 Filtering of weak and duplicate directions
📊 Results history and favorite configurations
📈 Direct launch of the built-in PulseScope Signal on a chart

Two operating modes are supported:

🔹 Classic Trading
🔹 Binary Options

The Studio also includes 13 interface languages and built-in parameter explanations, so every important setting is explained directly inside the application.

From parameter search to a validated and reproducible configuration.

👉 PulseScope Studio:

https://www.mql5.com/ru/market/product/185833
Konstantin Chechnev Выставил продукт

PulseScope Studio — автоматический оптимизатор торгового индикатора для MetaTrader 5. Он ищет устойчивые параметры, отсеивает случайные исторические максимумы, проверяет кандидатов на отдельном контрольном участке и позволяет сразу запустить выбранную конфигурацию на графике. Рынок чаще всего обманывает именно там, где результат выглядит особенно убедительно. Отделить закономерность от случайного совпадения — вот настоящая задача.   PulseScope Studio — полноценная среда оптимизации

Konstantin Chechnev Выставил продукт

Иногда хочется просто на минутку выдохнуть: пока график “дышит”, можно отвлечься и размять внимание — не уходя из терминала. ARKAVELLE рисуется прямо на чарте: это маленькая аркада для спокойного перерыва между идеями и сделками. Правила простые • Цель: отбивать мяч платформой и разбивать кирпичи. • Управление: стрелки ← / → или мышь (движение внутри панели). Ловите падающие бонусы — они меняют темп и добавляют веселья: • Expand — расширяет платформу на время. • Slow — замедляет мячи на время

Konstantin Chechnev
Konstantin Chechnev


https://www.mql5.com/ru/market/product/134522

🚀 **TickFlow update — version 1.4**
Now it does more, with greater accuracy and convenience — so you can spot quickly where the market is “hot” and where it’s in a comfort zone.

🔥 **What TickFlow can do now:

* clearly shows the **buyer/seller balance** and the **delta** in a readable format — the direction and strength of activity are visible instantly;
* adds a compact **info panel** right on the chart with key statistics and tick history for recent bars — everything you need within reach;
* smart **cluster grouping** and improved tick processing — makes it easier to find volume concentration zones and likely areas of interest;
* improved detection and visualization of **support/resistance levels** — levels are now more precise and informative;
* built-in **alerts/notifications** for important levels — so you won’t miss critical moments;
* more useful settings and neatly organized parameters — you can flexibly adapt the tool to your strategy;
* optimized calculations and cleaner presentation of numbers (delta formatting, percentages, etc.) — reading the data is simpler and more pleasant.

💡 **Why the indicator is useful:

* fewer guesses, more facts: you can see who dominates ticks, where volume is concentrated, and where the market feels uneasy;
* faster decision-making — essential information is now compact and easy to read;
* the tool fits both fast scalping and position trading — everything on a single chart;
* tidy visual cues cut analysis time and reduce trading stress.

✨ **Who will like it: traders using volume/tick analysis, those looking for extra confirmation for entries/exits, and anyone who likes a compact panel with quick stats.

📌 **Update now** — if you’re already using TickFlow, version 1.4 delivers a richer, more convenient market view.

https://www.mql5.com/ru/market/product/134522
Konstantin Chechnev
Konstantin Chechnev
Version 3.0

https://www.mql5.com/en/market/product/156185

The indicator’s auto-tuning has been brought back, but in an updated form — with improved logic, more stable behavior, and expanded control options. The mechanism for automatically adapting internal coefficients has also been refined and improved.

After “version 2”, where sensitivity parameters were adjusted manually, the model has been switched back to automatic adaptation. The redesigned algorithm now:

analyzes the length of winning/losing signal series more effectively;

increases the “strictness” of filters in proportion to the number of losing trades and the depth of the drawdown (including for traders using grid strategies outside of binary options);

speeds up or slows down its reaction depending on statistics;

includes protection against excessive parameter swings so that the model does not “overreact”;

uses a separate Base Speed parameter, which defines the initial character of the indicator (fast/reactive or smoother/more filtered) even before auto-adaptation kicks in, with a normalized range so that values stay within reasonable limits on any timeframe.

This produces a clear, controllable effect — the model actually feels more “alive” and responsive to the market, rather than mechanical.

Additionally, the extremum-filter algorithms have been improved.

Manual tuning proved useful in tests, but on real data it required constant user attention: adjusting to volatility, market “noisiness”, trend phase, and impulse strength. Auto-adaptation and the Base Speed parameter remove this burden and allow the model to react on its own to changes in market structure, instead of working with fixed coefficients.
Konstantin Chechnev
Konstantin Chechnev
🔵 Migration to version 2.0.

https://www.mql5.com/en/market/product/156185

📊 The main changes are under the hood: the trend/flat, impulse, and extreme filters have been updated, which makes the behavior of the arrows more stable in different market regimes. Entries now pass through a stricter combination of filters.

✅ Improved signal engine and filtering system. Many small adjustments that overall have a positive impact on signal quality.
✅ Sensitivity is now controlled by three linked parameters, Sens 1–3.
✅ The statistics panel has been redesigned: we now display information only for the current trading instrument, which reduces the load on the terminal.
✅ Removed drawing of arrows on past history. Signals are now generated only in real time, taking into account impulses and price behavior. This makes the signals more honest and realistic.

👇 Try it now:

https://www.mql5.com/en/market/product/156185
Konstantin Chechnev Выставил продукт
Отзывов: 1
39.99 USD

Индикатор сигналов для бинарных опционов, который также эффективно применяется на форексе и других рынках. Подходит для краткосрочной сеточной торговли на M1–M5 и включает сигналы поэтапного наращивания позиций. Индикатор использует двухуровневую адаптацию: базовый профиль скорости (настройка “быстрый/плавный” с самого старта) и автоадаптацию по результатам сделок , которая подстраивает фильтры под текущий рынок, учитывая серии выигрышных и убыточных сигналов. Модель ищет на графике короткие

Konstantin Chechnev
Konstantin Chechnev
In the previous post I talked about market phases — trend, flat, impulse.
There’s another quiet problem that eats money and time:

during the day you’re away from the screen — a good trend is missed

you open the terminal in the evening — half of the move is already gone

you scroll through symbols: one is just noise, on another the “train has left”, on the third it’s unclear whether it’s worth touching at all

And every time it’s the same: lots of charts, very few clear decisions.

🧩 Solution: don’t try to see everything — filter the best

Things get much easier when you have a tool that:

collects statistics of its own signals across different symbols

shows where the model actually performs well, and where the market just doesn’t fit it

helps you see on which symbols trends are “alive” right now, and where it’s nothing but chop

In my own toolkit, this role is covered by Adaptive NeuroMatrix Trend (MT5):
it doesn’t just draw phases (trend / flat / impulse), it also keeps a numeric history — by instruments and by time. In essence, it helps quickly answer:

“On which pairs/instruments does this approach make sense today, and which ones are better to skip?”

💡 Benefit for the trader

This approach gives several tangible advantages:

fewer pointless trades on “favorite but dead” instruments

focus only on the symbols where your logic actually works

a clear reason why you picked these specific 3–5 instruments out of the whole list

stats not in a notebook and not “from memory”, but right inside the indicator

If you want to see how such filtering looks in practice, you can run Adaptive NeuroMatrix Trend (MT5) in the tester on your own instrument list:

Adaptive NeuroMatrix Trend (MT5)
https://www.mql5.com/ru/market/product/155563
Konstantin Chechnev
Konstantin Chechnev
Indicator: Adaptive NeuroMatrix Trend (MT5)
https://www.mql5.com/ru/market/product/155563
Have you ever seen a “perfect” indicator in the tester and a totally different story on a live chart?
Most of the time it’s because of repainting – signals look great on history, but in real time they change after the fact 😤

Adaptive NeuroMatrix Trend was built specifically to avoid that. It’s a price-action based trend indicator that works **only on bar close**, so what you see in real time is exactly what will stay on the chart 💹

What it helps you see:
🔵 when buyers dominate (bullish phase)
🔴 when sellers dominate (bearish phase)
⚪ when the market is basically flat and better to stay out or take profit
🟡🟠 impulse zones that may lead to a reversal or at least to a pause in the current move

Inside, it combines smoothing, volatility and statistics to cut out random noise and leave a clean, readable structure of trend / flat / impulse ✅

You can tune its behavior to match your style:
⏱ adjust reaction speed vs. smoothness
🎯 make entries more conservative or more aggressive
🚫 suppress random spikes and noisy bars
🧠 enable a predictive layer that helps to catch trend phase shifts a bit earlier

Possible uses in a trading plan:
🧭 trend filter for your existing strategies and EAs
🔎 quick scan of symbols to see where a real move is happening right now
📌 spotting exit and re-entry areas after strong impulses

If you’re tired of indicators that “know the future” only on history and want a clearer view of who’s in control – buyers, sellers or nobody – take a look at Adaptive NeuroMatrix Trend, run it in the Strategy Tester on your own symbols and timeframes, and see how it behaves in your approach 📉📊

Page of the indicator:
https://www.mql5.com/ru/market/product/155563