AUREX Harmonic Pattern Detector
- Индикаторы
- Версия: 1.56
- Активации: 5

Harmonic Pattern Scanner — Gartley, Bat, Butterfly, Crab (Auto XABCD Detection)
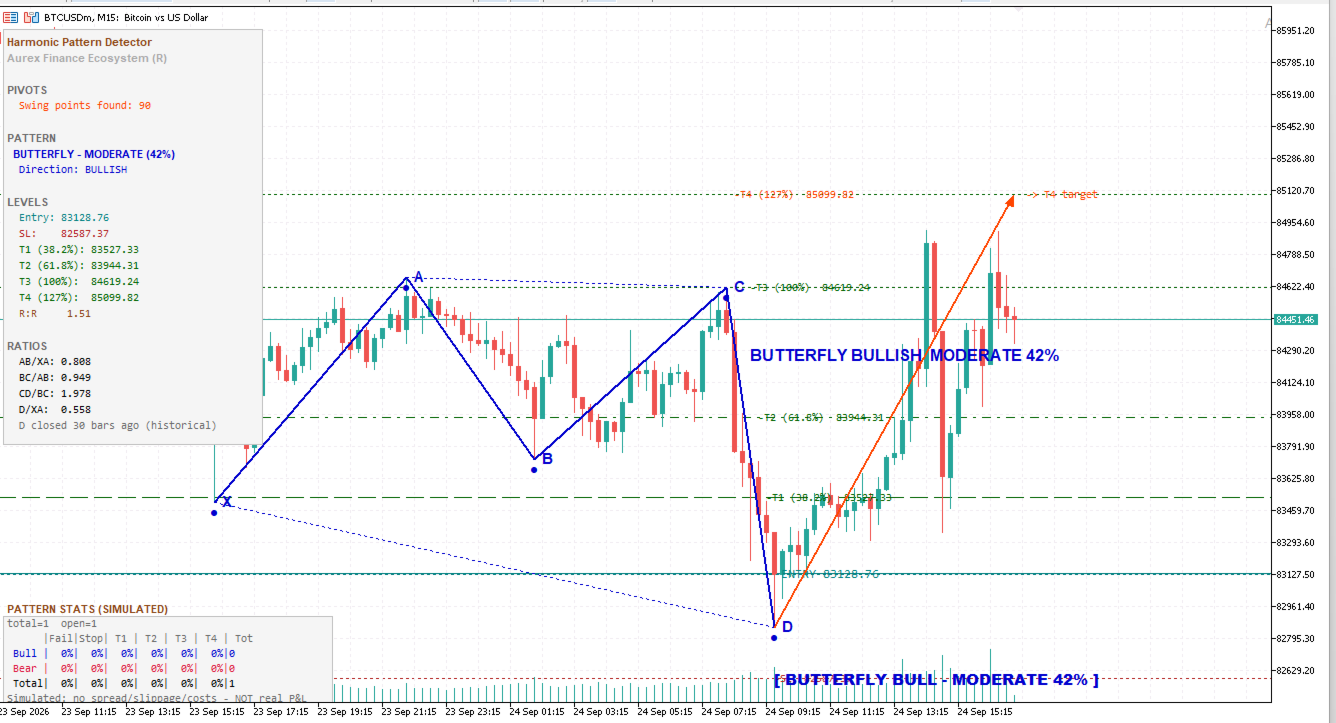
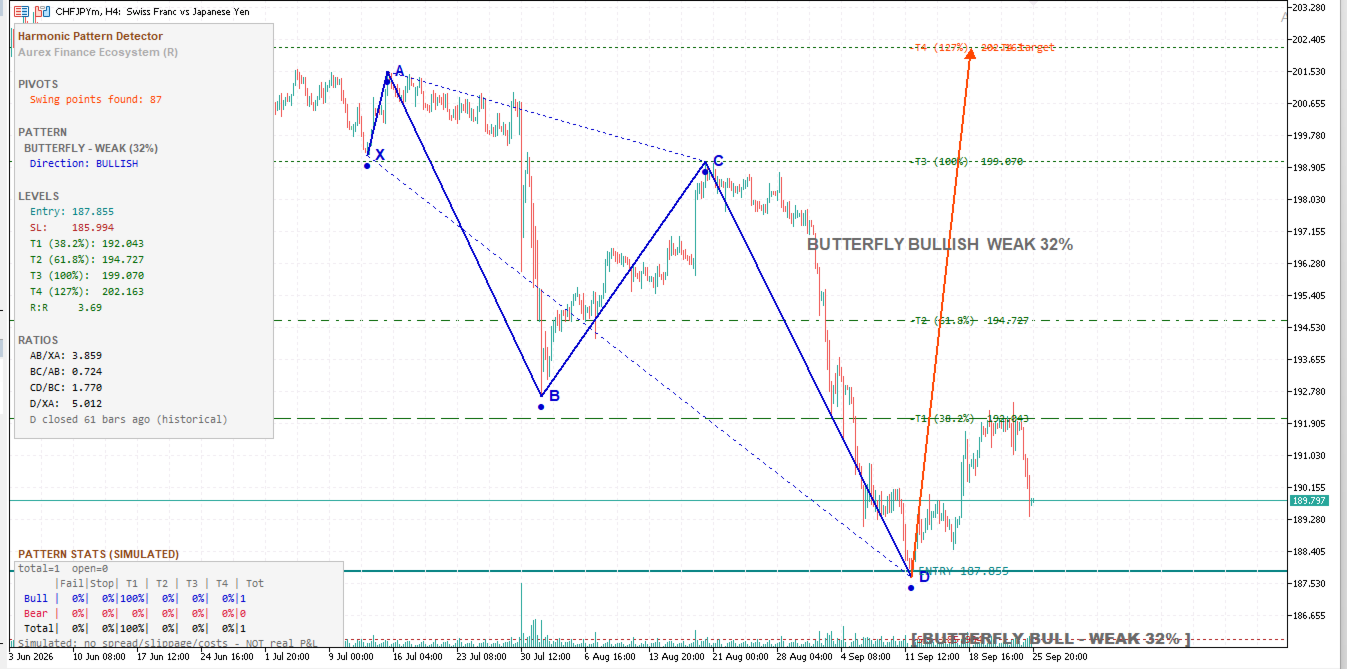
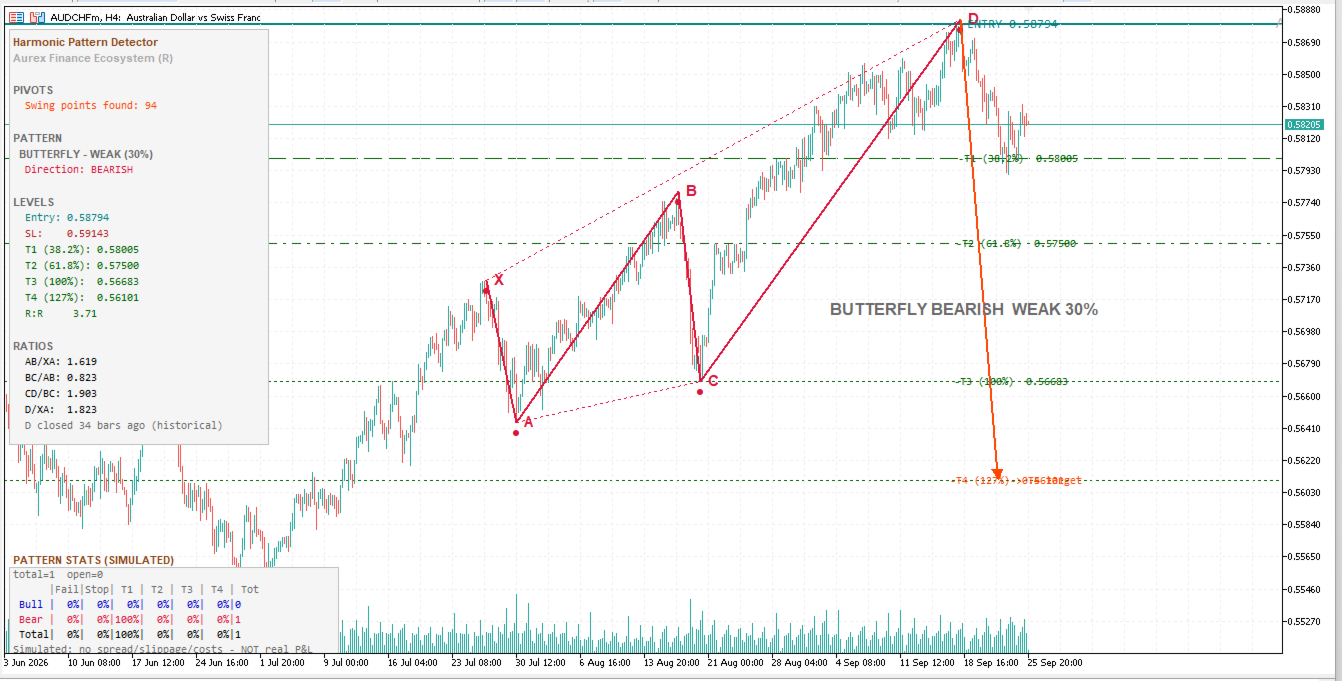
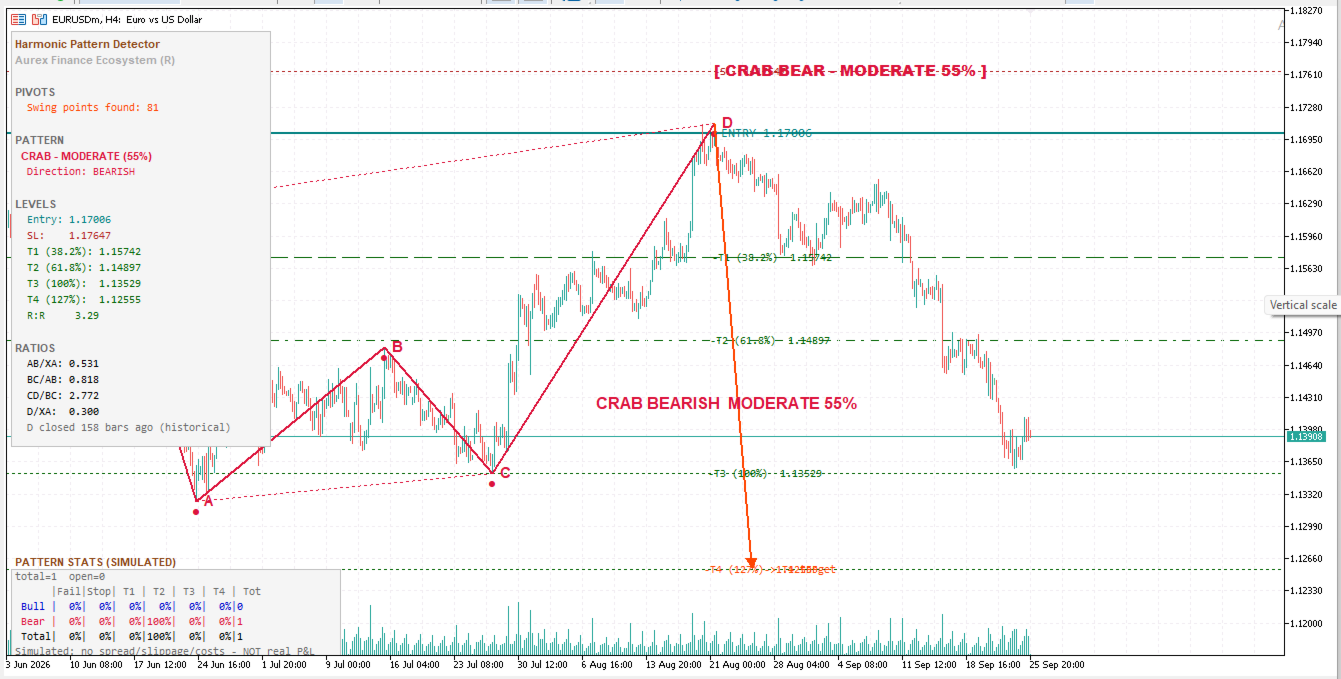
Stop manually plotting Fibonacci retracements on every swing. This indicator scans your chart in real time, identifies X-A-B-C-D structures, and tells you exactly which harmonic pattern is forming — Gartley, Bat, Butterfly, or Crab — with entry, stop loss, and four take-profit targets calculated automatically.
What it does
- Detects confirmed harmonic patterns the moment a D-point swing closes, and previews forming patterns while the CD leg is still developing
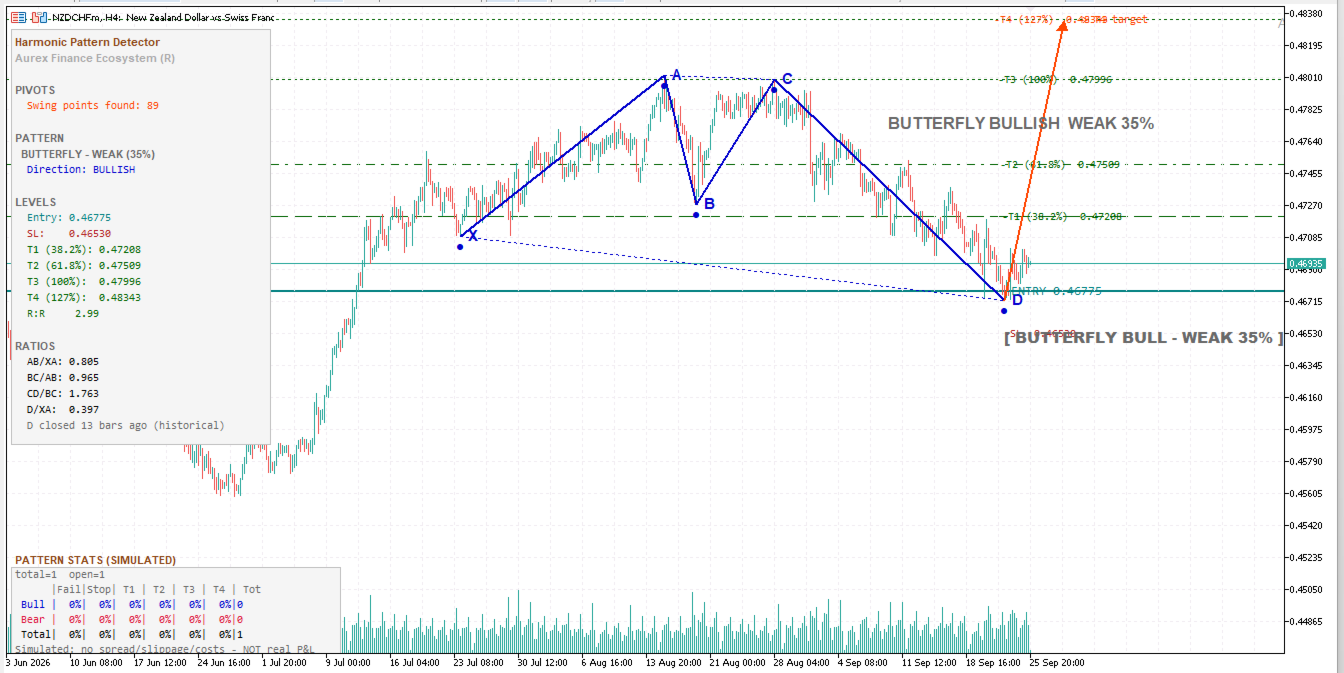
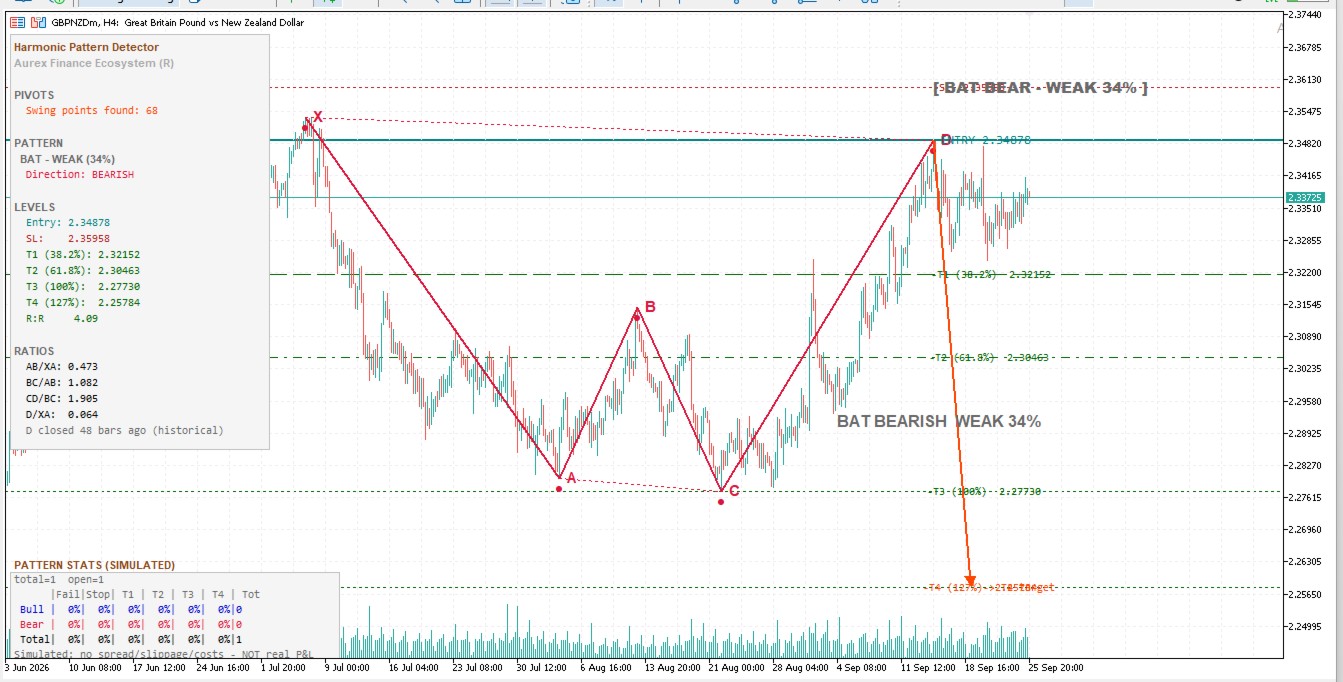
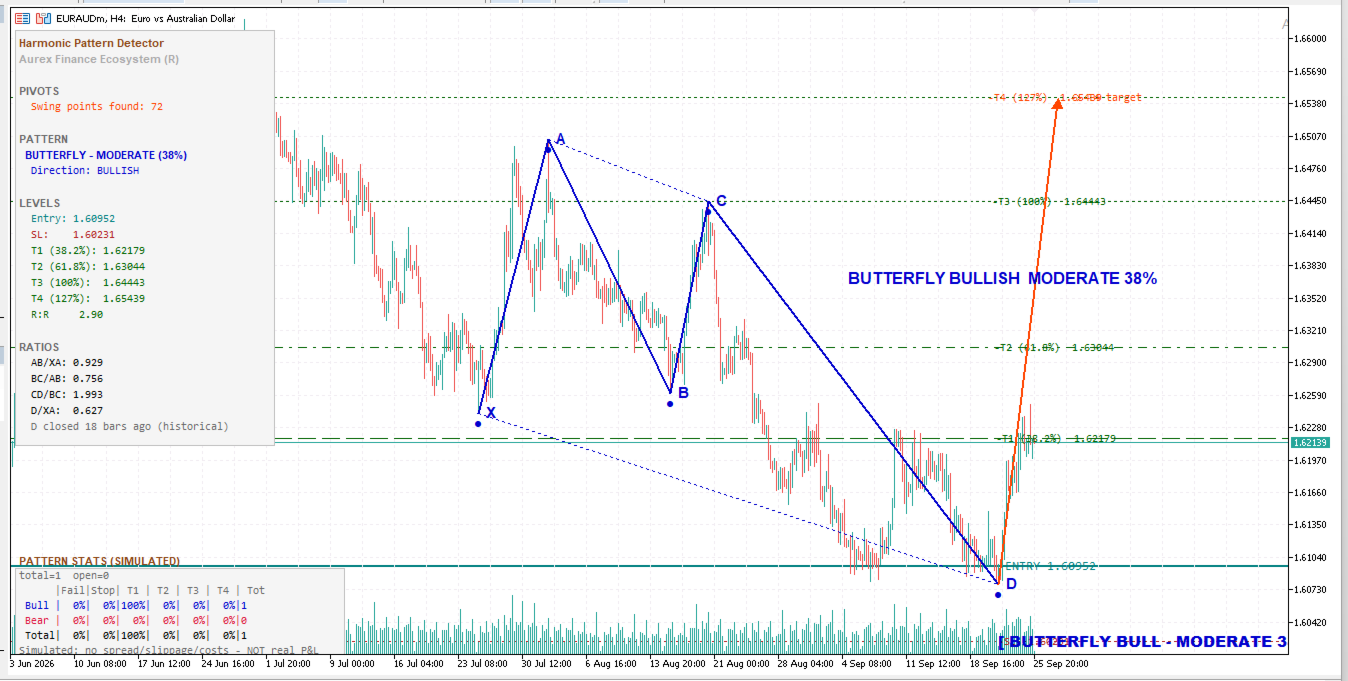
- Draws the full X-A-B-C-D structure on your chart with labeled swing points and pattern-ratio annotations (AB/XA, BC/AB, CD/BC, AD/XA)
- Calculates entry, stop loss, and four Fibonacci-extension targets (38.2%, 61.8%, 100%, 127%) for every valid pattern
- Runs a live, bar-by-bar simulated performance panel showing how patterns detected on this chart have historically played out — win rate by target level, split bullish vs. bearish
- Anti-repaint entry logic: entries are anchored to the open of the candle after the pattern confirms, not a live/floating price, so what you see backtested is what you'd have actually gotten filled
Why this one is different
Most harmonic scanners either go silent when a pattern isn't a textbook-perfect fit, or quietly show you a shaky pattern as if it were a sure thing. This one doesn't do either. Every detected pattern is scored for ratio quality and labeled honestly — Strong, Moderate, or Weak — so you always know how clean the fit actually is before you consider it. Low-quality fits still display for context, but the indicator won't hand you a full entry/SL/target plan for a pattern that doesn't deserve one.
Built for discretionary traders who want structure, not signals
This is a decision-support tool, not an auto-trading system. It does the pattern math and risk-level calculation for you; you still apply your own judgment on confluence, higher-timeframe context, and trade selection.
Note: the performance panel is a simulated historical readout with no spread, slippage, or commission modeled — it is not live trading P&L. Past pattern outcomes on this chart do not guarantee future results.