AUREX Harmonic Pattern Detector

Harmonic Pattern Scanner — Gartley, Bat, Butterfly, Crab (Auto XABCD Detection)

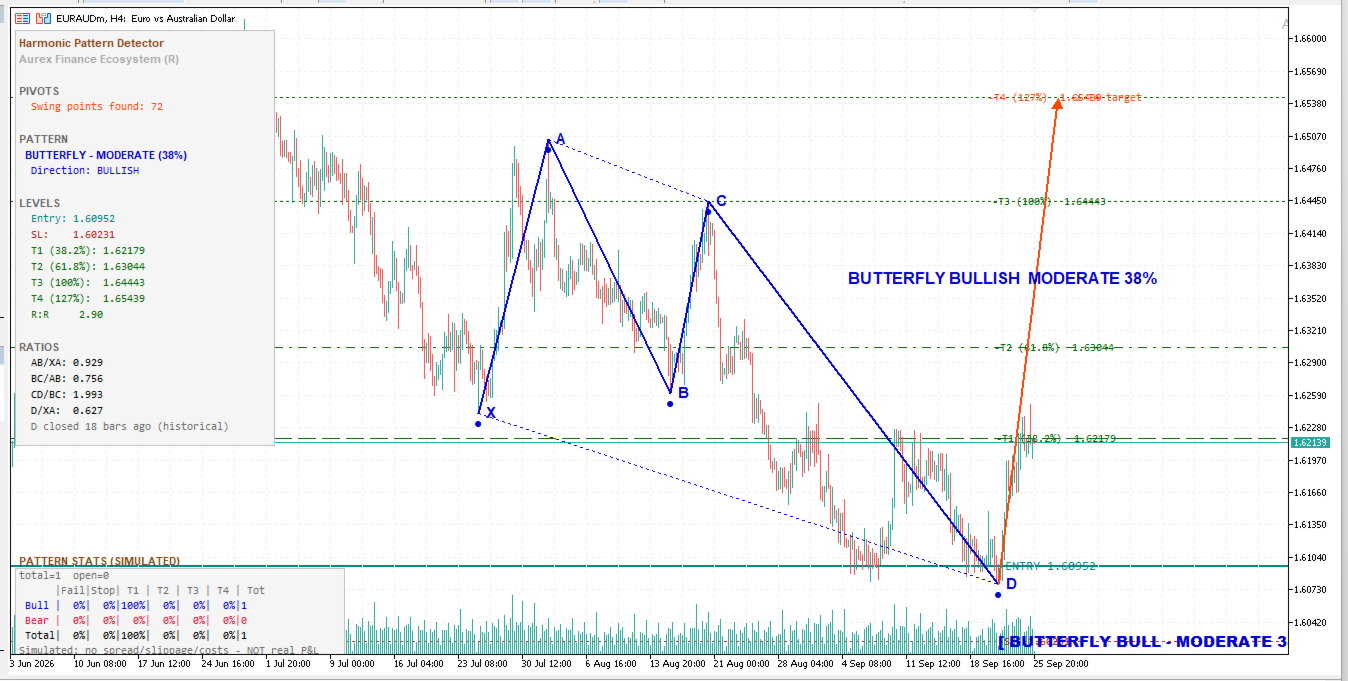
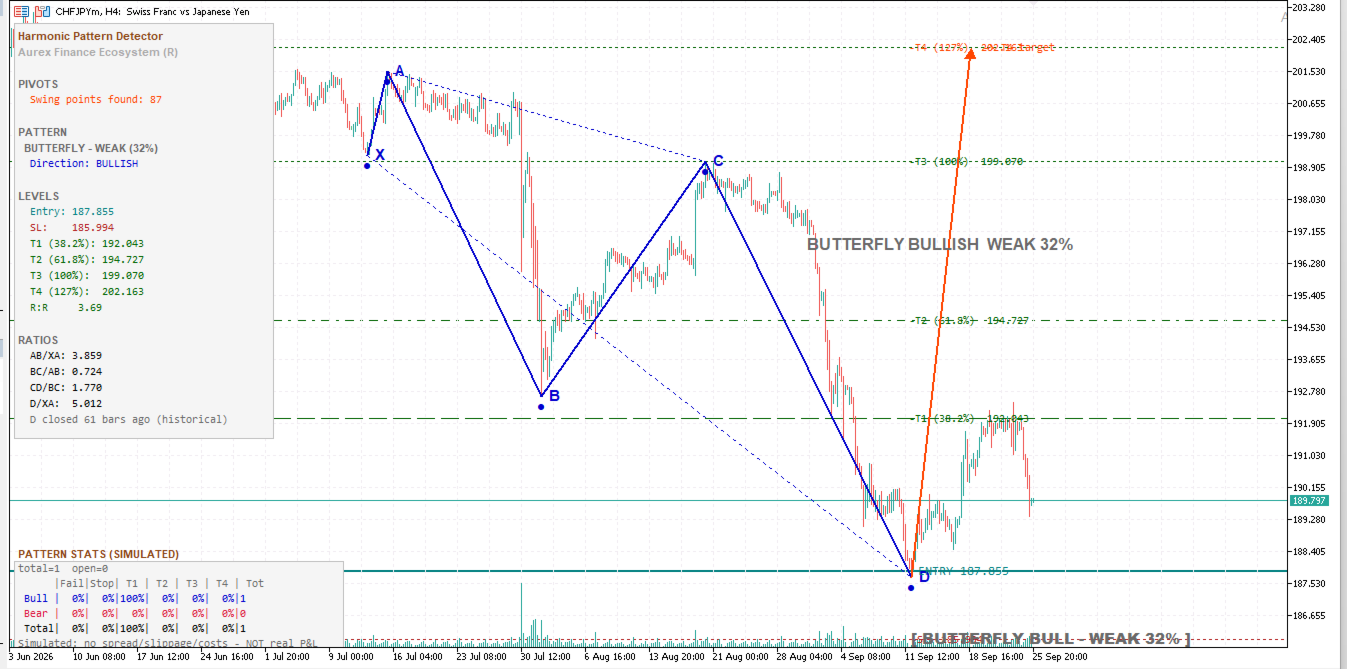
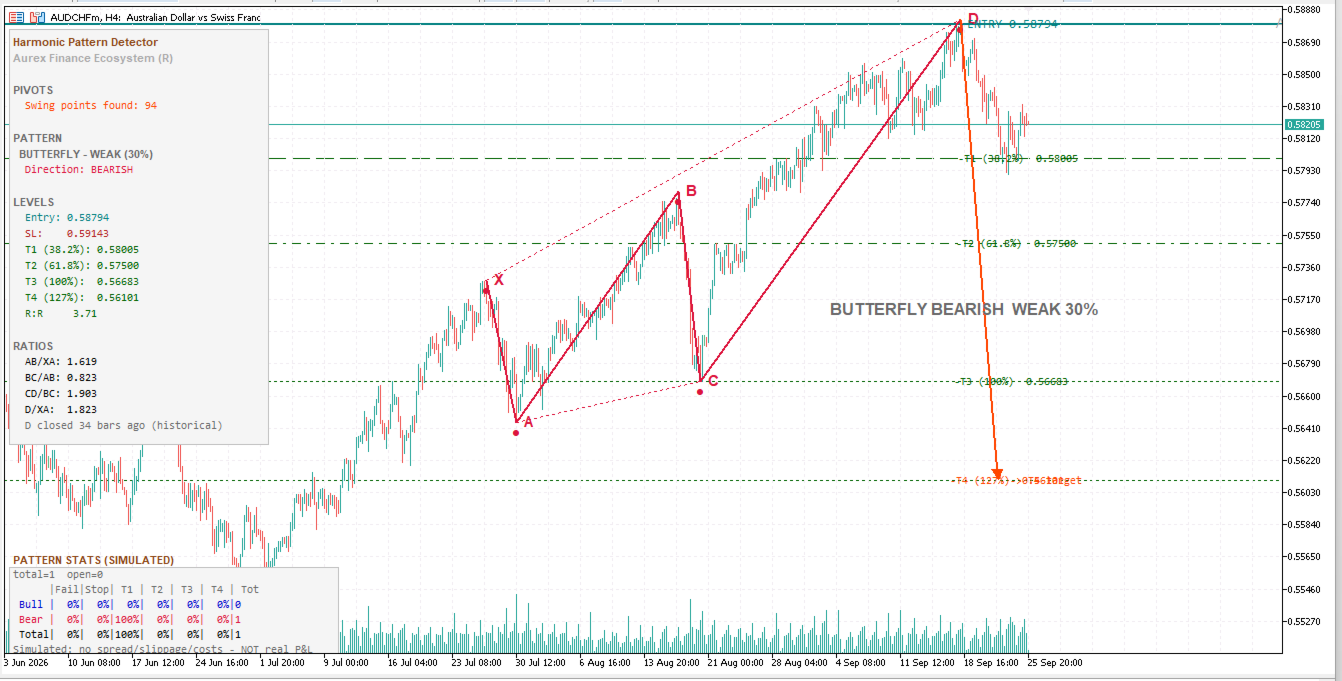
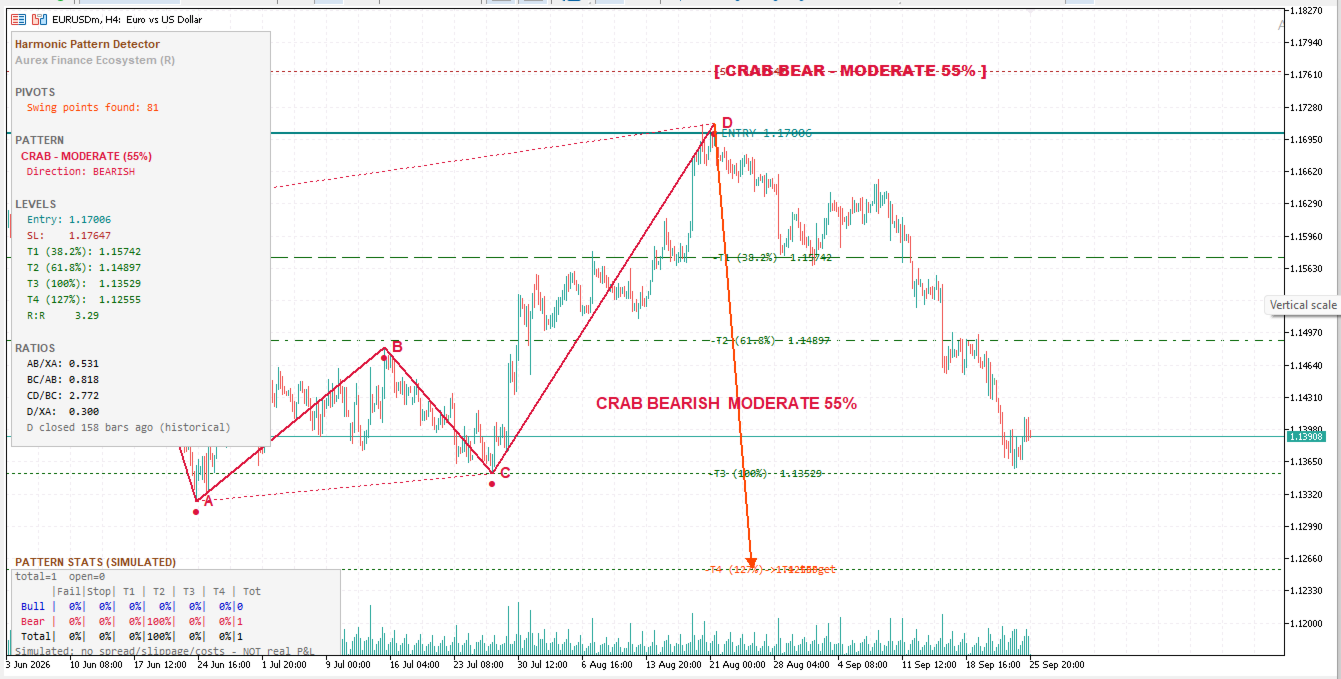
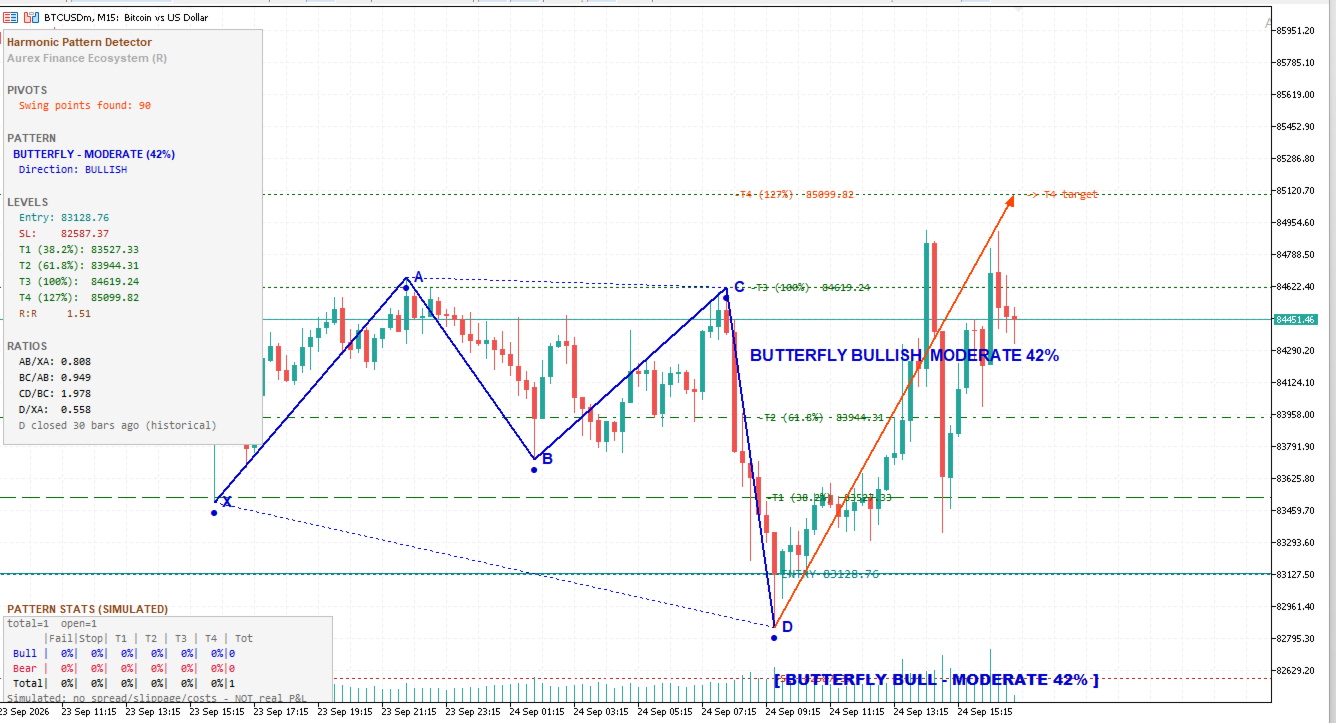
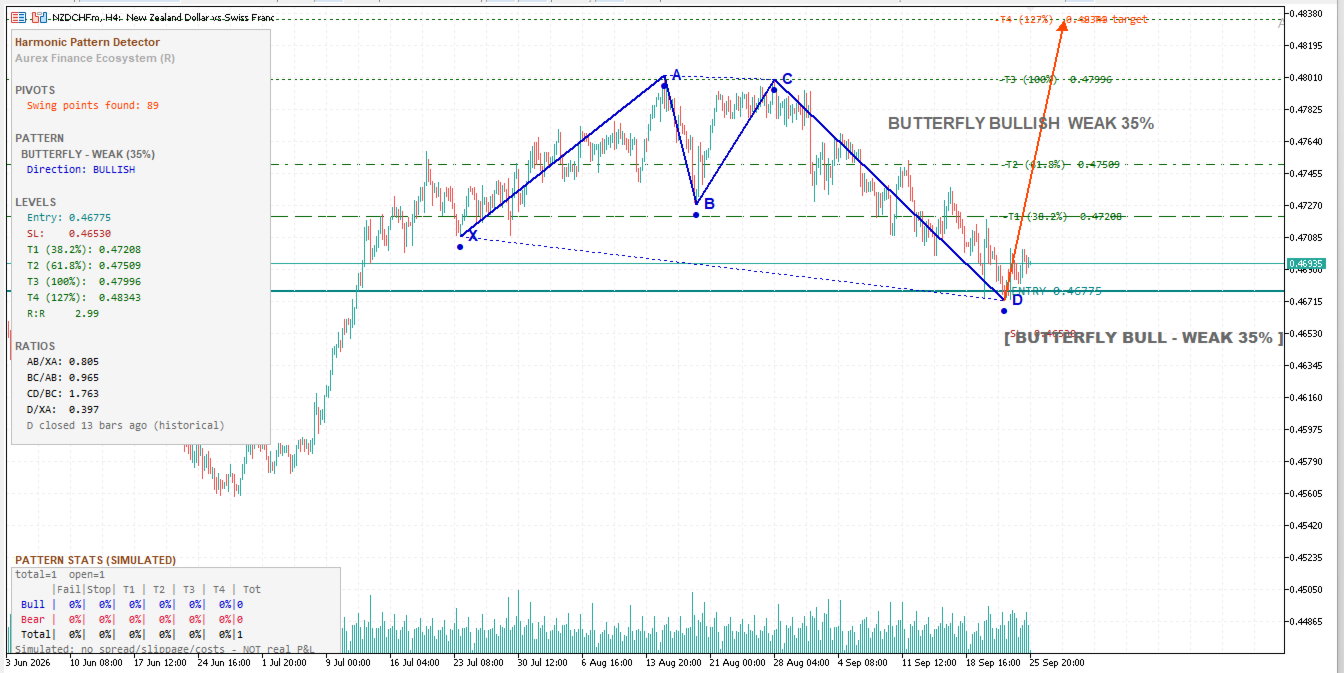
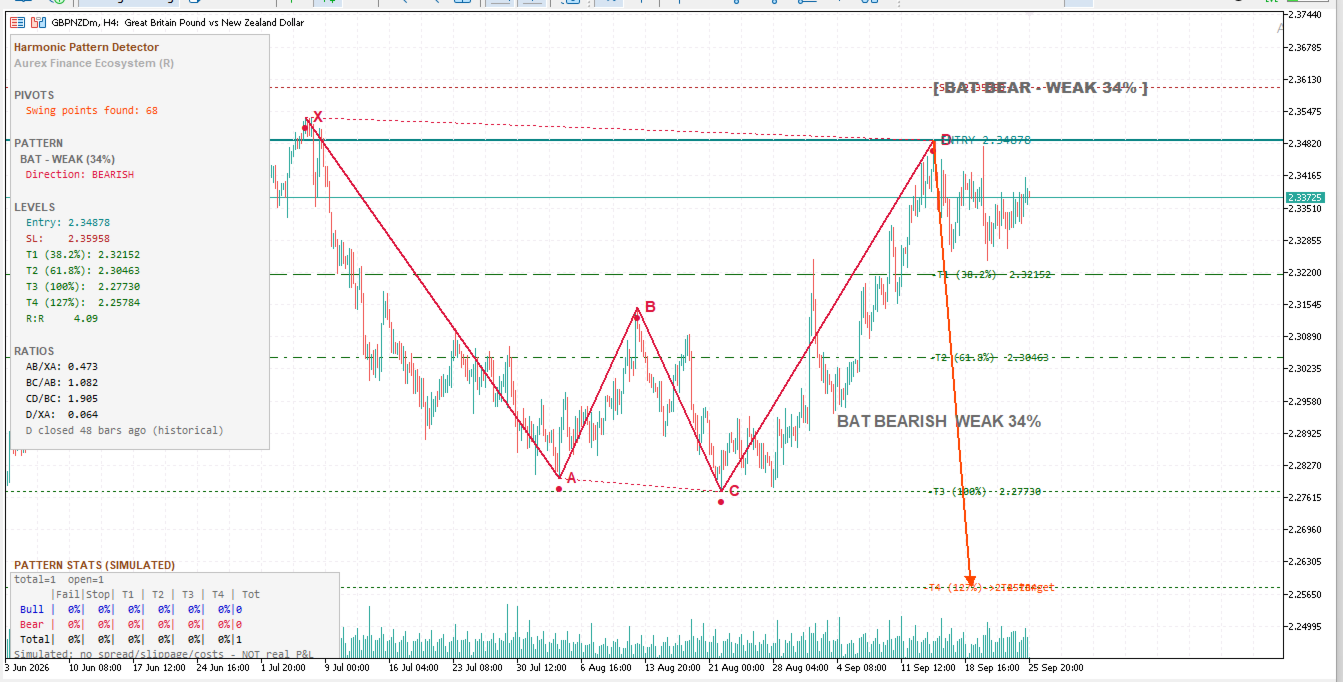
Stop manually plotting Fibonacci retracements on every swing. This indicator scans your chart in real time, identifies X-A-B-C-D structures, and tells you exactly which harmonic pattern is forming — Gartley, Bat, Butterfly, or Crab — with entry, stop loss, and four take-profit targets calculated automatically.

What it does

  • Detects confirmed harmonic patterns the moment a D-point swing closes, and previews forming patterns while the CD leg is still developing
  • Draws the full X-A-B-C-D structure on your chart with labeled swing points and pattern-ratio annotations (AB/XA, BC/AB, CD/BC, AD/XA)
  • Calculates entry, stop loss, and four Fibonacci-extension targets (38.2%, 61.8%, 100%, 127%) for every valid pattern
  • Runs a live, bar-by-bar simulated performance panel showing how patterns detected on this chart have historically played out — win rate by target level, split bullish vs. bearish
  • Anti-repaint entry logic: entries are anchored to the open of the candle after the pattern confirms, not a live/floating price, so what you see backtested is what you'd have actually gotten filled

Why this one is different

Most harmonic scanners either go silent when a pattern isn't a textbook-perfect fit, or quietly show you a shaky pattern as if it were a sure thing. This one doesn't do either. Every detected pattern is scored for ratio quality and labeled honestly — Strong, Moderate, or Weak — so you always know how clean the fit actually is before you consider it. Low-quality fits still display for context, but the indicator won't hand you a full entry/SL/target plan for a pattern that doesn't deserve one.

Built for discretionary traders who want structure, not signals

This is a decision-support tool, not an auto-trading system. It does the pattern math and risk-level calculation for you; you still apply your own judgment on confluence, higher-timeframe context, and trade selection.

Note: the performance panel is a simulated historical readout with no spread, slippage, or commission modeled — it is not live trading P&L. Past pattern outcomes on this chart do not guarantee future results.
Produtos recomendados
Este é sem dúvida o indicador de reconhecimento automático de formação de preço harmônico mais completo que você pode encontrar para a MetaTrader Platform. Ele detecta 19 padrões diferentes, leva as projeções de Fibonacci tão a sério quanto você, exibe a Zona de Reversão Potencial (PRZ) e encontra níveis adequados de stop loss e take-profit. [ Guia de instalação | Guia de atualização | Solução de problemas | FAQ | Todos os produtos ] Detecta 19 formações harmônicas de preços diferentes Traça
Monster Harmonics Indicator is a harmonic pattern indicator. It recognizes Gartley, Bat, Crab, Butterfly, Cypher, White Swan, Black Swan, Shark and AB=CD patterns. Projected patterns that are not yet completed are recognized, too. Monster even shows the PRZ (Potential Reversal Zone). Users can add their own user defined patterns to Monster. Besides the current pattern, Monster also shows all patterns in the symbols history. Monster will provide alerts for developing patterns. Introduced by H.M.
RSI Divergence Risk Target Signals RSI Divergence Risk Target Signals is a MetaTrader 5 indicator that detects confirmed bullish and bearish RSI divergence and combines the signals with optional trend filters, ATR-based Stop Loss levels, three Take Profit targets, alerts and an internal trade statistics dashboard. The indicator compares confirmed RSI pivot structure with corresponding price highs and lows. It is designed to help traders identify momentum divergence while providing a structure
Overview Harmonic Patterns MT5 is a technical analysis indicator designed for the MetaTrader 5 platform. It identifies and displays harmonic price patterns, such as Butterfly, Cypher, Crab, Bat, Shark, and Gartley, in both bullish and bearish directions. The indicator calculates key price levels, including entry, stop loss, and three take-profit levels, to assist traders in analyzing market movements. Visual elements and customizable alerts enhance usability on the chart. Features Detects six ha
RM Divergence Pro
Mohammadreza Mahdi Mavaddat
5 (1)
RM Divergence Pro - Indicador de Divergência e Incapacidade RSI: É um indicador de divergência RSI não repintado com base na estrutura do mercado. Ele detecta divergência regular, divergência oculta, incapacidade e divergência potencial usando oscilações RSI confirmadas, comportamento de preços e filtros estruturais. Visão geral: RM Divergence Pro é uma ferramenta de divergência baseada em RSI focada na lógica estrutural. Ele usa máximos e mínimos confirmados de oscilação do RSI junto com o comp
The   Fibonacci Confluence Toolkit   is a technical analysis tool designed to help traders identify potential price reversal zones by combining key market signals and patterns. It highlights areas of interest where significant price action or reactions are anticipated, automatically applies Fibonacci retracement levels to outline potential pullback zones, and detects engulfing candle patterns. Its unique strength lies in its reliance solely on price patterns, eliminating the need for user-define
Matreshka
Dimitr Trifonov
5 (2)
Matreshka self-testing and self-optimizing indicator: 1. Is an interpretation of the Elliott Wave Analysis Theory. 2. Based on the principle of the indicator type ZigZag, and the waves are based on the principle of interpretation of the theory of DeMark. 3. Filters waves in length and height. 4. Draws up to six levels of ZigZag at the same time, tracking waves of different orders. 5. Marks Pulsed and Recoil Waves. 6. Draws arrows to open positions 7. Draws three channels. 8. Notes support and re
Harmonic patterns with an honest track record. The indicator finds Gartley, Bat, Alt Bat, Butterfly, Crab, Deep Crab, Shark, Cypher, 5-0 and AB=CD patterns on your chart and on dozens of symbols and timeframes at once, draws the XABCD shape with its Potential Reversal Zone (PRZ) and Fibonacci ratios, gives entry, stop loss and three targets, and shows how often each pattern actually worked on each symbol: PRZ hold rate, TP1 and TP2 hit rate and average result in R , measured with exactly the sam
Gartley Projections D
Oleksandr Medviediev
3 (2)
The indicator identifies the harmonic patterns (XABCD) according to developments of H.M.Gartley ( "Profits in the Stock Market" , 1935г). It projects D-point as a point in the perspective projection (specify ProjectionD_Mode = true in the settings). Does not redraw. When a bar of the working timeframe closes, if the identified pattern point has not moved during Patterns_Fractal_Bars bars, an arrow appears on the chart (in the direction of the expected price movement). From this moment on, the ar
The indicator detects and displays М. Gartley's Butterfly pattern. The pattern is plotted by the extreme values of the ZigZag indicator (included in the resources, no need to install). After detecting the pattern, the indicator notifies of that by the pop-up window, a mobile notification and an email. The pattern and wave parameters are displayed on the screenshots. The default parameters are used for demonstration purposes only in order to increase the amount of detected patterns. Parameters z
Usdjpy Trend Follower
Marcos Ramon Aparicio Pelaez
Negocie USDJPY automaticamente com um robô MetaTrader 5 robusto e testado. O Momentum Master H1 utiliza uma estratégia de alta probabilidade apenas de longo prazo baseada em entradas dinâmicas baseadas em Poder de Touro e ATR. As principais características incluem: Testado ao longo do tempo: Testado de forma retroativa a partir de 2019-2025 nos gráficos do primeiro semestre. Entradas de precisão: Negociações longas desencadeadas por retrocessos de curto prazo e sinais de tendência confirmados.
Introduction to X3 Chart Pattern Scanner X3 Cherart Pattern Scanner is the non-repainting and non-lagging indicator detecting X3 chart patterns including Harmonic pattern, Elliott Wave pattern, X3 patterns, and Japanese Candlestick patterns. Historical patterns match with signal patterns. Hence, you can readily develop the solid trading strategy in your chart. More importantly, this superb pattern scanner can detect the optimal pattern of its kind. In addition, you can switch on and off individu
MercariaPattern1-2-3 відстежує рух ціни, знаходить трьоххвильові структури 1-2-3 та підсвічує момент, коли сценарій підтверджується пробоєм ключового рівня. MercariaPattern1-2-3 tracks price movement, detects three-leg 1-2-3 structures and highlights the moment when the scenario is confirmed by a key level breakout. Індикатор збирає локальні свінги в компактну фігуру 0–1–2–3 , чекає підтвердженого пробою та будує стрілку входу з готовими рівнями SL/TP. The indicator combines local swings into a
Harmonic Pattern Structure Harmonic Pattern Structure é um indicador profissional para MetaTrader 5 que detecta automaticamente padrões harmônicos clássicos utilizando validação rigorosa de ratios de Fibonacci e estrutura XABCD. Projetado para traders que buscam precisão, clareza visual e padronização, o indicador identifica zonas de reversão com base em geometria de preço, ajudando na tomada de decisão de forma objetiva e consistente. PADRÕES HARMÔNICOS DETECTADOS Gartley (222) Butterfly
Place Elliott Waves, automatic rule check and project targets – right in your MT5 chart Elliott Wave indicator for MetaTrader 5: place impulses and corrections. As soon as the points are set, the tool automatically checks whether the count complies with the Elliott Wave ruleset and calculates the Fibonacci targets. Elliott Wave Architect Pro MT5 brings the analysis into the same chart you trade from. The count is placed, the tool immediately checks the rule compliance and calculates the targets.
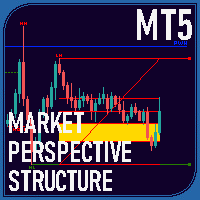
Overview The Market Perspective Structure Indicator is a comprehensive MetaTrader indicator designed to provide traders with a detailed analysis of market structure across multiple timeframes. It identifies and visualizes key price action elements, including swing highs and lows, Break of Structure (BOS), Change of Character (CHOCH), internal structures, equal highs/lows, premium/discount levels, previous levels from higher timeframes, and trading session zones. With extensive customization opt
Harmonic Pattern Hunter
Shingidzano Lesetedi
5 (1)
Harmonic Pattern Hunter Harmonic Pattern Hunter is a technical indicator for MetaTrader 5 that automatically identifies and draws high-probability harmonic patterns directly on the chart. It is designed to assist traders who use harmonic analysis as part of their trading methodology. How It Works The indicator scans historical and live price data for completed XABCD harmonic structures using Fibonacci ratio validation. When a valid pattern is detected, it draws the full pattern geometry, marks t
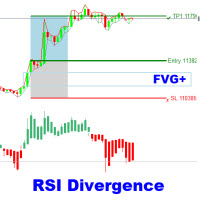
The RSI Divergence + FVG Signal indicator combines Relative Strength Index (RSI) Divergence with Fair Value Gap (FVG) detection to generate high-probability buy and sell signals based on both momentum shifts and institutional imbalance zones. Core Features: RSI Divergence Detection : Identifies both regular and hidden bullish/bearish divergences between price and RSI. Divergences indicate potential trend reversals or continuation. FVG Zone Recognition : Detects Fair Value Gaps (imbalances caused
SophieSMC One is a premium Smart Money Concepts indicator designed specifically for XAUUSD (Gold) traders who want a cleaner, more structured and institutional approach to the market. Built around real market structure concepts, SophieSMC One combines multiple Smart Money Concepts tools into one powerful and visually clean trading system for MetaTrader 5. FEATURES: • BOS & CHoCH market structure detection • Fair Value Gap (FVG) identification • Liquidity sweep visualization • Order Block recog
The Optimized MACD Divergence indicator is a powerful tool designed to identify potential trading opportunities by detecting divergences between price action and the MACD indicator. It combines classic divergence analysis with candlestick pattern recognition and volume filtering to provide more accurate and reliable signals. How it Works The indicator operates on the following principles: MACD Calculation:   It calculates the MACD indicator using user-defined parameters for fast EMA, slow EMA,
Zone Structure Scanner Panel for MT5 Find better setups faster — without scanning charts for hours. The Zone Structure Scanner Panel for MT5 helps you automatically scan multiple symbols, detect key weekly and daily support/resistance zones, read market structure, highlight confluence, and flag H4 rejection-confirmed setups from one powerful panel. Instead of jumping from chart to chart, you get ranked opportunities in one place so you can focus on the setups that matter most. Why it stands
Multi Timeframe Smc Bias Finder Trading in alignment with higher timeframe structure is one of the most consistently profitable habits a trader can build. The difficulty has always been execution: switching between timeframes, manually reading structure, and keeping track of whether the Daily, 4-Hour and 1-Hour are all pointing in the same direction before committing to a position. Multi Timeframe Smc Bias Finder resolves that entirely. Three tools in one indicator: A live multi-timeframe bias d
Enhanced Elliott Wave Pro – Advanced Market Structure & Wave Analysis   Enhanced Elliott Wave Pro is a lightweight, institutional-grade MT5 indicator that eliminates chart clutter by detecting and displaying only the current, active market structure: the 1-2-3-4-5 Impulse wave and the subsequent A-B-C Correction.   Built with classic Prechter wave rules and ATR-adaptive pivot detection, it delivers clean, real-time wave counts without bogging down your terminal.   ――――――――――――――――――――――――――――
PatternScope — Multi-Pattern Recognition for MT5 PatternScope is a multi-pattern recognition indicator for MetaTrader 5. It scans price action for classic chart patterns, confirms breakouts, and draws clear   Entry, Stop Loss and Take Profit   levels. A compact dashboard shows the latest pattern, bias and Risk:Reward. Patterns:   Double Top/Bottom, Triple Top/Bottom, Head and Shoulders (and inverted), Bullish & Bearish Flag, Pennant, Rising & Falling Wedge, Triangle, Rectangle, Cup and Handle —
Wolfe Wave Scanner MT5
Reza Aghajanpour
5 (8)
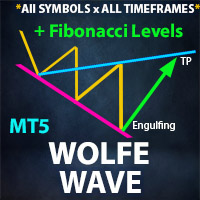
**  All Symbols  x  All Timeframes  scan just by pressing scanner button ** *** Contact me  to send you instruction and add you in "Wolfe Wave Scanner group" for sharing or seeing experiences with other users. - Big Update: 2026/10/24 + FREE   Trading Utility MT5 Introduction: A Wolfe Wave is created with five-wave patterns in price. It shows supply and demand and a fight towards a balance price. T hese waves of price actions can help traders identify the boundaries of   the trend . Also  It h
ATrend
Zaha Feiz
4.63 (19)
ATREND: Como Funciona e Como Usá-lo #### Como Funciona O indicador "ATREND" para a plataforma MT5 é projetado para fornecer aos traders sinais robustos de compra e venda, utilizando uma combinação de metodologias de análise técnica. Este indicador aproveita principalmente o Intervalo Verdadeiro Médio (ATR) para medir a volatilidade, juntamente com algoritmos de detecção de tendências para identificar possíveis movimentos de mercado. Deixe uma mensagem após a compra e receba um brinde especial.
Noize Absorption Index - is the manual trading system that measures the difference of pressure between bears forces and bulls forces. Green line - is a noize free index that showing curent situation. Zero value of index shows totally choppy/flat market.Values above zero level shows how powerfull bullish wave is and values below zero measures bearish forces.Up arrow appears on bearish market when it's ready to reverse, dn arrow appears on weak bullish market, as a result of reverse expectation.
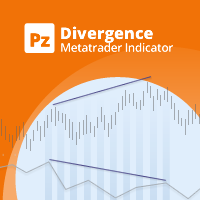
Difícil de encontrar e com pouca frequência, as divergências são um dos cenários de negociação mais confiáveis. Este indicador localiza e verifica automaticamente divergências ocultas e regulares usando seu oscilador favorito. [ Guia de instalação | Guia de atualização | Solução de problemas | FAQ | Todos os produtos ] Fácil de trocar Encontra divergências regulares e ocultas Suporta muitos osciladores conhecidos Implementa sinais de negociação baseados em fugas Exibe níveis adequados de sto
O nível Premium é um indicador único com mais de 80% de precisão nas previsões corretas! Este indicador foi testado pelos melhores Especialistas em Negociação por mais de dois meses! O indicador do autor você não encontrará em nenhum outro lugar! A partir das imagens você pode ver por si mesmo a precisão desta ferramenta! 1 é ótimo para negociar opções binárias com um tempo de expiração de 1 vela. 2 funciona em todos os pares de moedas, ações, commodities, criptomoedas Instruções: Assim
Price Magnet — Price Density and Attraction Levels Indicator Price Magnet is a professional analytical tool designed to identify key support and resistance levels based on statistical Price Density. The indicator analyzes a specified historical period and detects price levels where the market spent the most time. These zones act as “magnets,” attracting price action or forming a structural base for potential reversals. Unlike traditional Volume Profile tools, Price Magnet focuses on price-time d
Os compradores deste produto também adquirem
Boba Analysis Suite
Trade Ready Solutions LLC
5 (2)
Boba Analysis Suite O Boba Analysis Suite é um indicador de análise para o MetaTrader 5. Reúne a estrutura do mercado, as zonas de preço relevantes e o contexto geral do mercado numa única visualização do gráfico. Desenvolvido a partir da experiência prática como trader e formador de traders, apoia um processo de análise estruturado: avaliar a direção do mercado, identificar níveis importantes e analisar vários períodos gráficos em conjunto. Análise em contexto O significado de cada sinal depend
Neuro Poseidon MT5
Daria Rezueva
4.68 (53)
Neuro Poseidon is a new indicator by Daria Rezueva. It combines precise trading signals with adaptive TP/SL levels - creating best possible trades as a result! Message me and get  Neuro Poseidon Assistant  as a gift to automize your trading process! What makes it stand out? 1. Proven profitability on all assets and timeframes 2. Only confirmed BUY and SELL signals present on the chart 3. Adaptive TP & SL levels generated by the software for each trade 4. Easy to understand - suitable for al
Azimuth Pro
Ottaviano De Cicco
5 (7)
Azimuth Pro V2: Estrutura Fractal Sintética e Entradas Confirmadas para MT5 Visão geral Azimuth Pro é um indicador de estrutura swing multinível da Merkava Labs . Quatro camadas de swing aninhadas, VWAP ancorado em swings, detecção de padrões ABC, filtragem estrutural de três timeframes e entradas confirmadas em barra fechada — um gráfico, um fluxo de trabalho dos micro-swings aos macro-ciclos. Este não é um produto de sinais cegos. É um fluxo de trabalho baseado em estrutura para traders que v
ARIPoint
Temirlan Kdyrkhan
1 (4)
ARIPoint is a powerful trading companion designed to generate high-probability entry signals with dynamic TP/SL/DP levels based on volatility. Built-in performance tracking shows win/loss stats, PP1/PP2 hits, and success rates all updated live. Key Features: Buy/Sell signals with adaptive volatility bands Real-time TP/SL/DP levels based on ATR Built-in MA Filter with optional ATR/StdDev volatility Performance stats panel (Success, Profit/Loss, PP1/PP2) Alerts via popup, sound, push, or email Cu
O UZFX {SSS} Scalping Smart Signals v5.0 MT5 é um indicador de negociação de alto desempenho, sem repintura, concebido para scalpers, day traders e swing traders que exigem sinais precisos e em tempo real em mercados em rápida evolução. Desenvolvido pela (UZFX-LABS), este indicador combina a análise da ação do preço, a confirmação de tendências e a filtragem inteligente para gerar sinais de compra e venda de alta probabilidade, sinais de alerta e oportunidades de continuação de tendências em tod
CGE Trading Suite
Carl Gustav Johan Ekstrom
5 (3)
Institutional-Grade Analytics for MT5 The full analytical edge of a professional trading desk, built into your MT5 chart. A full guided tour walks you through every feature step by step. Standard retail platforms lack the depth required for professional market analysis. The CGE Trading Suite bridges this gap, transforming MetaTrader 5 into a comprehensive workspace. By integrating 18 proprietary modules into a single, unified chart interface, the suite eliminates fragmented analysis. It provide
Zain Gold Scalping
Ahmed Gamal Abdel Nasser Mohamed
A complete price-action analysis tool built around dual independent entry logic, each confirmed against a volatility band, combined with a configurable set of nine optional confirmation filters that let you shape exactly how conservative or aggressive the tool's signals behave. Core Strategy Two independent entry setups, each triggering only when price moves outside a dynamic volatility band — giving two distinct ways to spot potential reversal points, which can be used together or separately.
OmniSync Projection
Antonio-alin Teculescu
5 (1)
Chronos Fractal Engine is an innovative price projection indicator for MetaTrader 5, designed to transform your technical analysis by intelligently identifying and projecting historical price patterns. Built upon an advanced correlation algorithm and the fractal principles of the market, this powerful tool visualizes potential future price movements, giving you a unique edge in your trading decisions. What is Chronos Fractal Engine? At its core, the Chronos Fractal Engine employs a sophisticat
Orderflow Big Trade Revele a pressão oculta dentro das velas com mapas de calor de Delta estimado Você está perdendo a atividade crítica que acontece dentro das velas padrão? O Orderflow Big Trade utiliza algoritmos avançados de ponderação por amplitude de preço e fechamento para estimar a pressão de compra e venda em níveis de preço agrupados. Em vez de depender apenas do volume bruto, ele transforma a dinâmica do price action em um mapa visual claro de Delta — ajudando você a identificar in
OrderFlow Absorption – Indicador Profissional de Delta e Sinais de Absorção para MT5 Desbloqueie o poder da verdadeira análise de fluxo de ordens com o OrderFlow Absorption – o indicador definitivo de histograma de delta e sinais de absorção para MetaTrader 5. Desenvolvido para traders que desejam enxergar o que realmente acontece por trás de cada movimento de preço, esta ferramenta revela pressões ocultas de compra/venda e eventos de absorção que movimentam o mercado. Recursos Visualização do H
Gem SIGNAL
Shengzu Zhong
5 (1)
GEM Signal Pro GEM Signal Pro é um indicador seguidor de tendência para MetaTrader 5, desenvolvido para traders que desejam sinais mais claros, setups mais estruturados e uma gestão de risco mais prática diretamente no gráfico. Em vez de mostrar apenas uma seta simples, o GEM Signal Pro ajuda a apresentar a ideia completa da operação de forma mais clara e fácil de entender. Quando as condições são confirmadas, o indicador pode mostrar o preço de entrada, o stop loss e os alvos de take profit no
RelicusRoad Pro MT5
Relicus LLC
4.96 (25)
Pare de chutar suas operações. Saiba quando entrar, onde sair e para que lado o mercado está pendendo, tudo em um único gráfico. O RelicusRoad Pro reúne quase vinte ferramentas em um só indicador, e você liga apenas as que combinam com o seu jeito de operar. Entradas claras. Saídas claras. Um plano em cada gráfico. Parece familiar? Você compra, e o preço vira contra você um minuto depois. Você fecha cedo demais e depois vê o movimento continuar sem você. Cinco indicadores no gráfico, cinco respo
TrendMaestro5
Stefano Frisetti
note: this indicator is for METATRADER4, if you want the version for METATRADER5 this is the link:  https://www.mql5.com/it/market/product/108106 TRENDMAESTRO ver 2.5 TRENDMAESTRO recognizes a new TREND from the start, he never makes mistakes. The certainty of identifying a new TREND is priceless. DESCRIPTION TRENDMAESTRO identifies a new TREND in the bud, this indicator examines the volatility, volumes and momentum to identify the moment in which there is an explosion of one or more of these da
Olá, traders! A maioria dos traders de retalho depende de scripts web lentos. Para operar com verdadeira rentabilidade, é necessário um framework institucionalizado. O indicador Astro AI não é uma sobreposição gráfica padrão. Trata-se de uma rede neural compilada contendo dois agentes que são executados diretamente no seu terminal. Eis a tecnologia específica por trás do sistema: 1. Agente 1: Analista (Rede Neural Gráfica - GNN) Os mercados não são barras de preço isoladas; são redes de dad
Have you ever wondered why most systems are not effective in live trading? My answer is that it's all the fault of the so-called "Smart Money" or the institutional ones,, they constantly create spikes first up then down and vice versa to screw all the retail investors by tearing away their capital, confusing them and making the markets move randomly without any rules. But in all this there is a famous strategy, which in 2009 won the world championship, exploiting and rowing against the instituti
Quantum Momentum Guard (QMG) Breakout and Momentum Indicator for MetaTrader 5 Overview Quantum Momentum Guard (QMG) is a technical indicator for MetaTrader 5 designed to identify potential breakout opportunities by combining momentum analysis, breakout conditions, and mathematical validation. The indicator evaluates market conditions to generate directional signals when its configured criteria are met. It is designed primarily for XAUUSD (Gold) and can also be used on other financial instruments
Title:FX-AIEA Supply and Demand Zone Indicator (MT5) — Technical Overview Version: 2.51 | Platform: MetaTrader 5 Introduction Supply and demand zones are considered a core manifestation of institutional order flow, providing a more direct reflection of buying and selling pressure than traditional support/resistance levels. This indicator attempts to automate the identification of high-probability supply and demand zones using an adaptive ZigZag algorithm, reducing the subjectivity and time asso
Naked Forex Kangaroo Tail Pro Indicator Kangaroo Tail Pro Indicator is a pattern recognition indicator for Forex, Stocks, Indices, Futures, Commodities and Cryptos. The Kangaroo Tail is a multi-bar pattern. The Kangaroo Tail pattern is very effective and is very simple to trade. The strategy that comes with the Kangaroo Tail is based on price action. The indicator does what it was designed for: displaying Kangaroo Tail patterns.     Don't expect to follow the up and down arrows and make mone
ORB Seeker MT5
Marcela Goncalves De Oliveira
Preço especial para limitar a disponibilidade e manter a escassez do produto! Apenas $599! Após a compra, entre em contato comigo para receber o EA ORB Seeker bônus e os arquivos de configuração otimizados personalizados. Faça sessões de tratamento eficazes com confiança! O ORB Seeker MT5 é um indicador profissional de Ruptura da Faixa de Abertura (ORB) desenvolvido para traders que buscam precisão, simplicidade, flexibilidade e uma estrutura de gráfico clara. Ele traça automaticamente a faixa
Zain Gold ScalpingV5
Ahmed Gamal Abdel Nasser Mohamed
Zain Gold Scalping V5 is a technical analysis indicator for MetaTrader 5 designed for Forex and Gold markets. It provides chart-based market information, trend analysis, signal conditions, and an on-screen dashboard to help traders analyze price movement across multiple timeframes. Main Features The indicator supports multiple timeframes, including M1, M5, M15, M30, H1 and higher timeframes. It can be used with Gold (XAUUSD), Forex currency pairs, indices and other supported instruments. The in
IQ FX Gann Levels a precision trading indicator based on W.D. Gann’s square root methods . It plots real-time, non-repainting support and resistance levels to help traders confidently spot intraday and scalping opportunities with high accuracy. William Delbert Gann (W.D. Gann) was an exceptional market analyst, whose trading technique was based on a complex blend of mathematics, geometry, astrology, and ancient mathematics which proved to be extremely accurate. We don't offer free or bonus indic
—— 进入本指标前,请谨记:『 不易,变易 』。拔开数理统计的枝叶,变化是不变的定理才是本指标的由来和内涵思想。本指标只应指明变化到不变之间的契机。 本指标——阴阳线指标(YiiYnn)由一条粗蓝色实线和一条细烟绿色虚线构成,粗实线叫阳线(Ynn),作为主线,细虚线叫阴线(Yii),作为辅线。本指标不同DeMarks去搜索哪个周期的最高最低,也不同Stoch那样告诉你超买超卖超过后缩小再等超买超卖直至资金的尽头。本指标是分析价格减速动态均值线的(偏)相关性及自相关性,并采用标准差的方法进行滤波以求趋势示意更明朗。所以,本指标有以下特性: 指标依据波浪理论,有二阶线性插值模拟组合多条均线(开收高低)构建波浪动力并分析它们各自相关性,所以将对趋势有很好的 预测性 ——与MACD、ATR等相比。它并非只让我们看到趋势的尾巴,请参考最后一张示例图; 指标采用简单的方差进行差相过滤,在兼顾计算性能的同时让盘整阶段的指示更明朗; 阳线与阴线之间是偏相关差相,具有阴消阳长相互激励、抵消的特点,因此命名; 本指标中判定的趋势与常人所称『趋势』不同,本指标中的趋势包括: 上涨、下跌和横盘 。不要忽略横盘
The indicator is designed to close positions on the market in time. For example: to take profits ahead of schedule if the price has not reached TakeProfit, and the market is turning around. The indicator analyzes the momentum, not the trend. He does not give any information about the trend. The indicator is well suited for finding divergence. The Ershov 38 Parrots indicator dynamically adjusts to the market and detects price movement impulses of medium and high amplitude. It almost does not rea
First time on MetaTrader, introducing IQ Star Lines, an original Vedic Astrology Based Intraday Trading Indicator. We don't offer free or bonus indicators in exchange of reviews from you. You won't need any free products with this indicator to make it work. ;) Enjoy! Welcome to the new and updated  IQ Star Lines , the ultimate fusion of ancient planetary cycles and modern quantitative trading, published for the first time on Metatrader. This is an indicator built by the developer, who has spent
Spike Fakeout Detector
Brighton Mufaro Mudzingwa
PainX 400 FAKEOUT DETECTOR MT5 Custom Indicator  ·  Sell-Side Bias  ·  Scalping  ·  RSI(6) Filtered   OVERVIEW   The Spike Fakeout Detector is a non repaint precision technical indicator built exclusively for Crash / PainX synthetic indices on the platform. It is engineered around one of the most consistent and exploitable patterns on this instrument — the false breakout above resistance followed by a sharp price drop. Crash/PainX is a growing index that produces a significant price drop appr
AriX
Temirlan Kdyrkhan
1 (4)
AriX Indicator for MT5 A powerful trend-following and signal-evaluation tool AriX is a custom MT5 indicator that combines Moving Averages and ATR-based risk/reward logic to generate clear buy/sell signals. It visualizes dynamic SL/TP levels, evaluates past trade outcomes, and displays win/loss statistics in a clean on-chart panel. Key features include: Buy/Sell signals based on MA crossovers ATR-based SL/TP1/TP2/TP3 levels with visual lines and labels Signal outcome tracking with real-time stat
Meravith Scanner
Ivan Stefanov
5 (3)
O MERAVITH SCANNER é um indicador profissional de mercados financeiros para MetaTrader 5 que consolida várias ferramentas analíticas em um único sistema integrado. Ele realiza todos os cálculos automaticamente usando uma metodologia proprietária de preço médio ponderado por volume (VWAP), eliminando completamente a interpretação subjetiva. O indicador funciona em todas as classes de ativos (Forex, Ações, Índices, Commodities, Criptomoedas) e em todos os prazos, de M1 a Mensal. O princípio fundam
Boom & Crash & PainX & GainX Ultimate Spike Detector Trade Spikes With Confidence — Not Guesswork Catching spikes should be one of the most profitable strategies in synthetic markets. But for most traders, it becomes one of the most frustrating. You enter too early… price goes against you. You wait for a spike… it never comes. You finally catch one… but don’t know whether to hold or close. You make profit… then give it all back because there’s no exit plan. This is exactly the problem the Ultim
Presenting one-of-a-kind Gann Indicator for XAUUSD IQ Gold Gann Levels is a non-repainting, precision tool designed exclusively for XAUUSD intraday trading. It uses W.D. Gann’s square root method to plot real-time support and resistance levels, helping traders spot high-probability entries with confidence and clarity. William Delbert Gann (W.D. Gann) was an exceptional market analyst whose trading technique was based on a complex blend of mathematics, geometry, astrology, and ancient calculation
Mais do autor
Liquidity Swings - Unmitigated Zones [Aurex] This indicator identifies the most recent unmitigated pivot high and pivot low on your chart, then draws a visible zone around each level until price closes through it. How it works: Detects swing highs and lows using a configurable fractal lookback period Draws a zone box from the wick or full candle range at each pivot The level line stays solid while the zone is active and switches to dashed once price closes through it Tracks how many times price
FREE
Strong Liquidity Zones A professional non-repainting liquidity mapping indicator that detects and scores high-probability imbalance zones and stop-pool zones on the chart. The indicator identifies two core types of liquidity areas: • Imbalance Zones – price gaps (similar to Fair Value Gaps) that act as magnets • Stop-Pool Zones – areas around confirmed swing highs/lows where stop orders typically cluster Each zone receives a dynamic 0–10 score based on volume pressure, zone size, number of tests
FREE
Wyckoff Architectural Range Wyckoff Architectural Range is an automatic range-detection indicator built around Wyckoff market theory. It scans price action for valid consolidation ranges, then maps the range into a clear premium/discount structure so you can instantly see where price sits relative to fair value. What it does: Auto range detection — automatically identifies valid consolidation ranges based on volatility (ATR), so you don't have to draw them manually. Premium & Discount zones — sp
FREE
Most Elliott Wave tools just draw lines. This one validates every pattern against the 3 cardinal rules — or rejects it. Elliott Wave analysis is one of the most powerful — and most difficult — methods in technical trading. Most indicators fake it. They draw zigzag lines and call them waves without checking a single Elliott Wave rule. Elliott Wave Detector Pro is different. It was built from the ground up to detect, validate, and project Elliott Wave patterns the way a professional analyst would
Fibonacci Projection Volume Delta Profile Combine Fibonacci-based price projections with volume delta analysis to see where buying and selling pressure concentrates across key retracement zones. This indicator automatically detects swing highs and lows, plots retracement levels, and projects forward price targets using Fibonacci extensions — while overlaying a volume delta profile that shows the balance of bullish vs. bearish volume within each Fibonacci band. Use it to spot high-probability rev
FREE
AUREX STRONG GRADIENT CHANNEL — Linear Regression Channel, Sloped Volume Profile & Order Flow Stop trading price in isolation. Aurex Strong Gradient Channel fuses a statistically-fitted trend channel with a full volume profile and live order-flow read, then scores contrarian setups at the edges of the range — all in one indicator, one panel, one glance.  What it doe     Linear Regression Channel — a statistically fitted channel (not a fixed-lookback high/low box) that adapts its slope to the rea
FREE
MOST INDICATORS SHOW YOU ONE THING — PRICE OR VOLUME. THIS SHOWS YOU BOTH, TOGETHER. SMC Volume Profile Regression Channel builds a statistically-fitted price channel (linear or polynomial regression) around your chart, then overlays real-time volume pressure and a right-side volume distribution profile — so you can see structure and participation in a single view instead of switching between tools. WHAT IT DOES — Plots a regression channel (linear or quadratic curve fit) with adjustable standar
FREE
Aurex Market Structure - CHoCH/BOS (Fractal) A structure-detection indicator that identifies swing highs/lows using a symmetric fractal filter, then flags Break of Structure (BOS) and Change of Character (CHoCH) events when confirmed closes cross those swing levels. Detection method Swing points are located using a fractal window of configurable length: a high is registered when it is the local extreme across the surrounding bars on both sides, and the same logic applies inversely for lows. Once
FREE
Aurex Resistance & Support Dynamic PRO An adaptive support/resistance zone indicator built on swing-pivot detection, ATR-scaled zone sizing, volume validation, and an automated mitigation protocol that removes zones once they've been invalidated. Zone detection Zones are anchored to confirmed swing highs and swing lows (symmetric pivot window, default length 10). Each zone's thickness is derived from a 50-period ATR rather than a fixed pip/point value, so zone width automatically adapts to the c
FREE
Most traders lose not because of bad strategy — but because they never review their trades. Aurex Trade Journal fixes that automatically. Drop this EA on any chart and it silently logs every closed trade to a structured CSV file. Open it in Excel or Google Sheets and your edge becomes visible within minutes. What it logs Entry & exit price, direction, lot size Stop loss & take profit levels Trade duration (minutes) Profit in $ and % of account balance R:R ratio (calculated automatically) Win / l
FREE
What if you could see the future by studying the past? Every market pattern has happened before. Analogue Matcher finds it — automatically. Using advanced Pearson Correlation and Linear Regression analysis, Analogue Matcher scans thousands of historical bars to find the price pattern that most closely matches what the market is doing right now — then projects it forward as a visual price path on your chart. No guessing, no manual chart comparison. Pure mathematical pattern recognition. How it wo
Most breakout tools draw random lines. This one finds real channels. Price moves in channels, wedges, triangles, flags, and pennants. Every major breakout starts inside one of these patterns. Breakout Pattern Setup automatically detects converging price channels using a boundary-fit algorithm — the same mathematical approach professional analysts use manually — and alerts you the moment price breaks out with strength. No manual drawing, no guessing. Pure mathematical channel detection. How it wo
Aurex Fibonacci OTE Zone Smart Market Structure • Fibonacci OTE • CHoCH • Dynamic Swing Tracking Aurex Fibonacci OTE Zone is a professional MT5 chart indicator designed to help traders identify market structure, swing movements, Change of Character (CHoCH), and Fibonacci Optimal Entry (OTE) zones directly on the chart. Instead of manually drawing Fibonacci levels after every market move, the indicator automatically tracks the evolving market structure and updates the relevant Fibonacci levels as
Trend Market — Smart Money Concepts (SMC) Indicator with Order Blocks, FVG & Auto TP System Trend Market is a complete Smart Money Concepts toolkit built to help you read institutional price behavior with clarity — market structure, liquidity zones, and precise risk-based profit targets, all in one indicator.  The Strategy This indicator is built around real Smart Money Concepts (SMC) trading logic: Market Structure Detection (BOS / CHoCH) — Using fractal-based swing analysis, the indicator auto
Filtro:
Sem comentários
Responder ao comentário