Argus Indicator

  • Индикаторы
  • Yevhen Hladchenko
    Yevhen Hladchenko
    Я трейдер-дискретчик, ставший разработчиком торговых систем.
    Несколько лет я торговал вручную - изучал price action, управление риском и психологию исполнения на собственном опыте. И пришёл к одному выводу: стабильность даёт процесс, а не эмоции.
  • Версия: 2.0
  • Активации: 5
The package consists of two MetaTrader 5 indicator files that are normally placed together on the chart:
  • TudasInstantAnalysis.mq5 — the "top" indicator, drawn over price on the main chart.
  • TudasDownCombined.mq5 — the "bottom" indicator, an independent subwindow below the chart.
The logic has been calibrated, and continues to be calibrated, against real XAUUSD data.


Part 1 — Top Indicator: TudasInstantAnalysis.mq5


1.1 EMA Ribbon — moving-average ribbon

Trend "by eye" on candles is easy to confuse with a pullback: you end up trading against the move right when a local correction looks like a reversal.
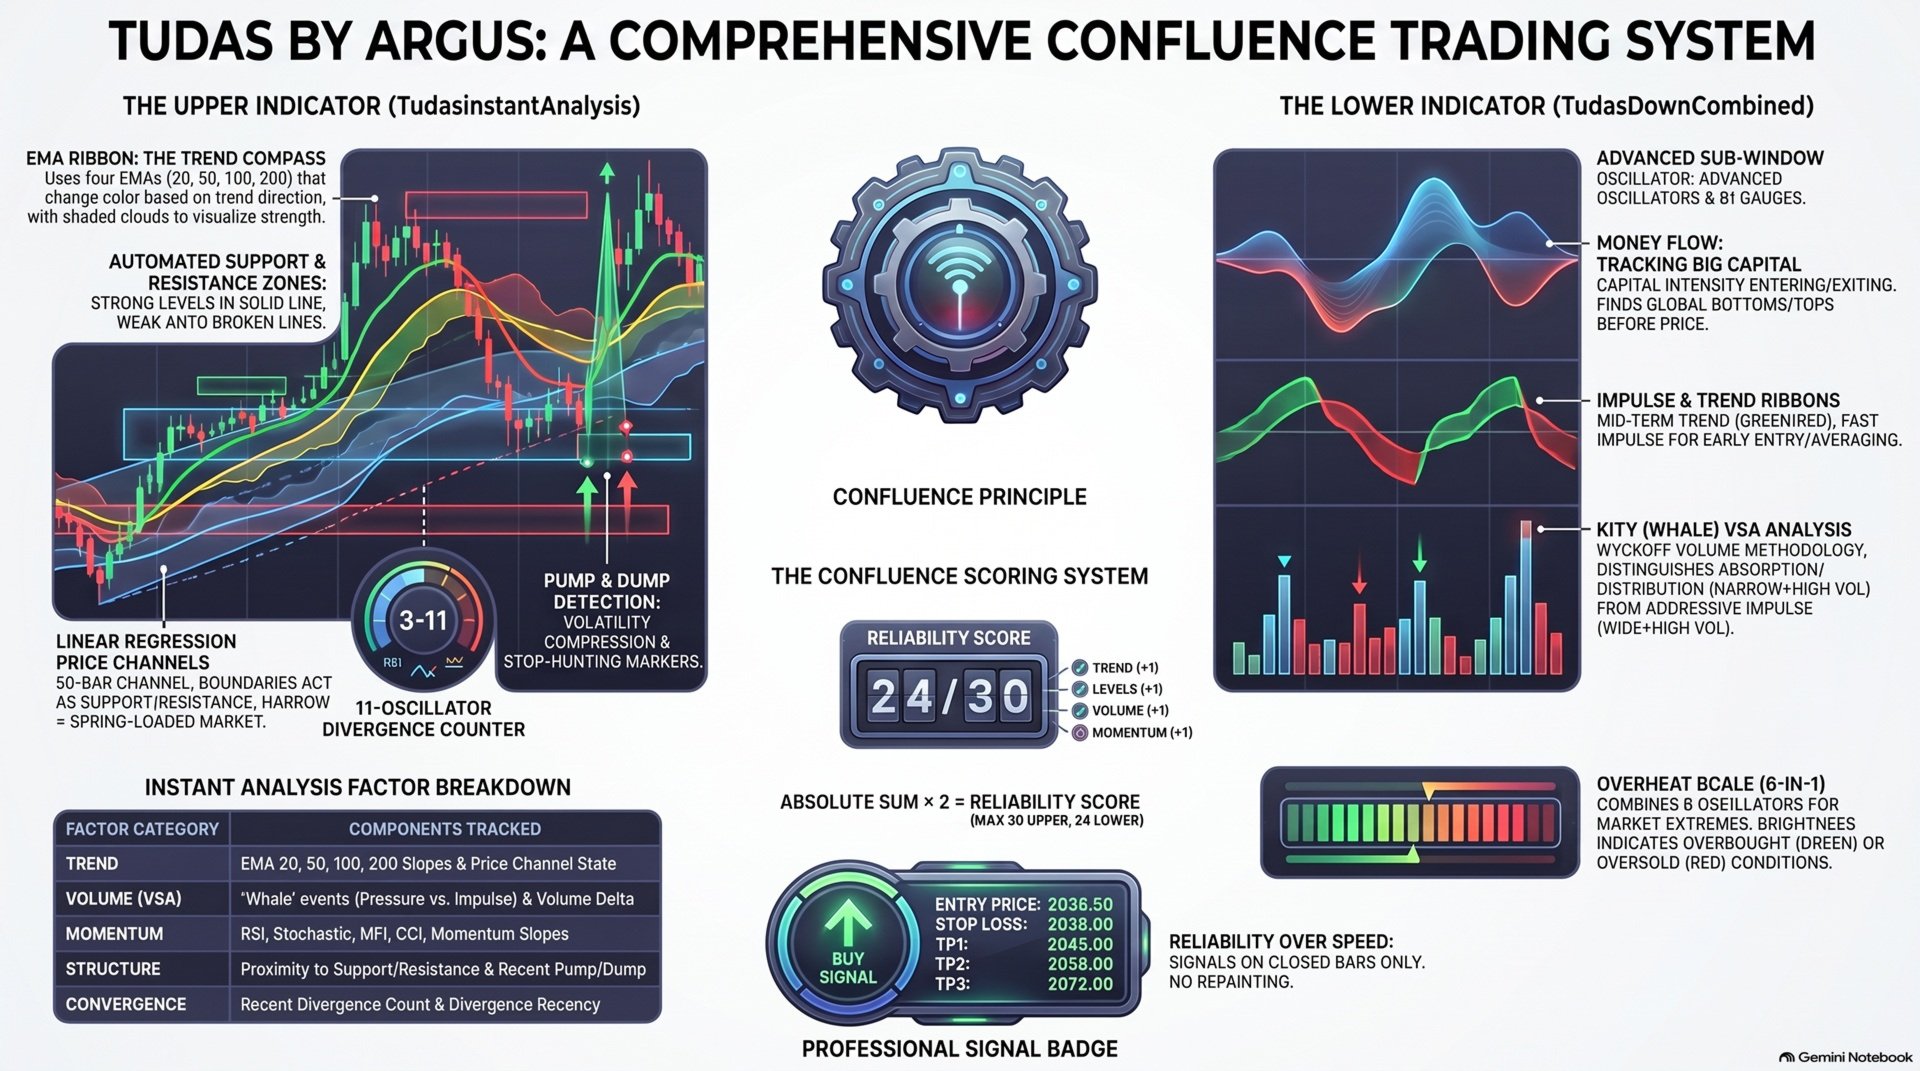
The ribbon removes that subjectivity: four EMAs (20, 50, 100, 200) are colored automatically based on their direction.
  • Green — the line is rising (slope faster than InpFlatATR ×ATR per bar).
  • Red — falling.
  • Yellow — sideways, slope within the threshold.
  • Line thickness increases with the period: EMA20 is the thinnest, EMA200 the thickest.
  • Semi-transparent clouds fill the space between neighboring lines: green when the upper EMA sits above the lower one, red when it's the other way around

How to read trend strength: the 4 lines fan out to the same side and the clouds share the same color — a strong, stable trend. The lines weave together and flip color often — the market is sideways, better to skip signals.
Simple idea: price pulls back to a green EMA — wait for a buy signal from another module in the package (mirror for red). Works best with the trend or in a flat market; against the trend, take short targets only or skip the signal.
1.2 Price Channel(PriceChannel)
An entry "out of thin air", with no relation to structure — it's unclear exactly where you went wrong if the trade didn't work out.
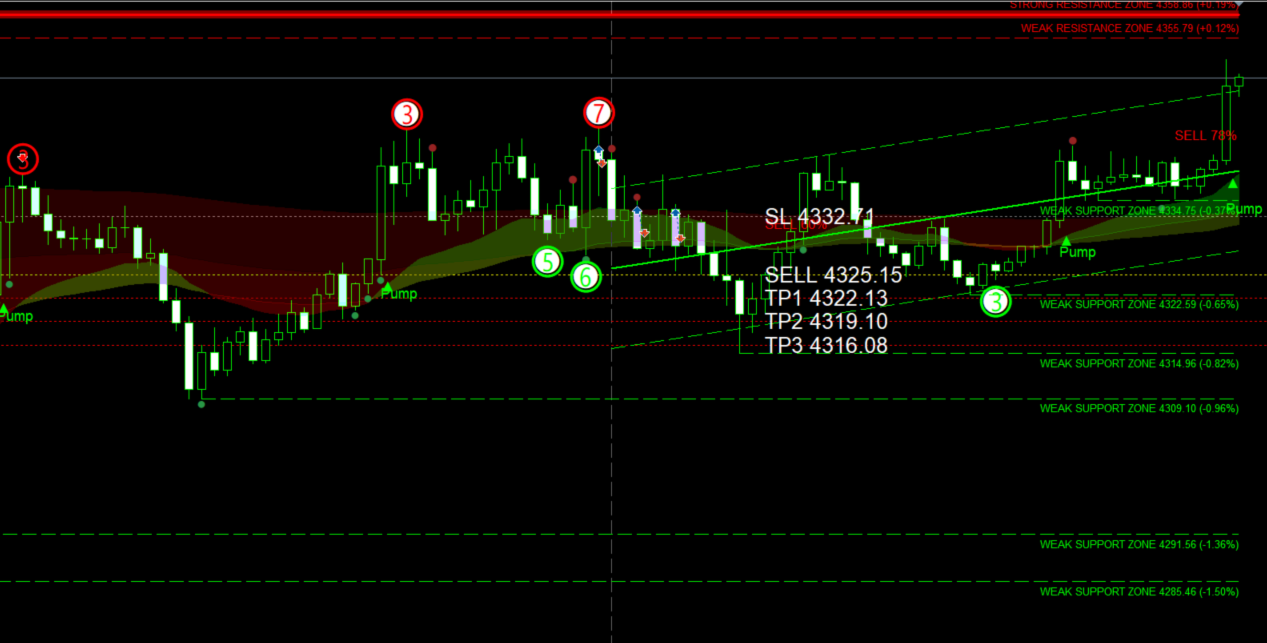
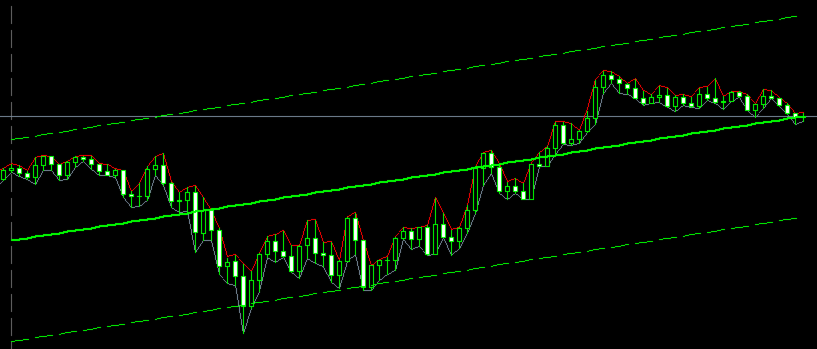
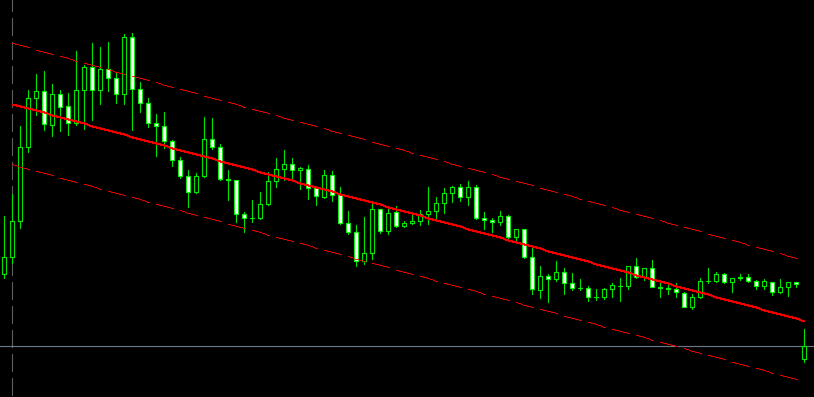
The linear-regression channel over the last InpLength bars (50 by default) gives an entry from the edge, not from nowhere: three lines — mean (solid) + upper/lower (dashed), width = ± InpMult ×standard deviation.

  • Green (BULL) / Red (BEAR) / Yellow (FLAT) — based on the regression slope, normalized and compared against the InpThreshold threshold.
  • Label in the chart corner: PriceChannel: BULL/BEAR/FLAT slope X.XX .
  • Wide channel = high volatility/strong trend. Narrow channel = calm before an impulse — the market "coiling like a spring".


How to read it: the channel edges act as support/resistance; after a breakout, the middle line usually switches roles. The channel's direction filters out false signals against the trend.
Simple idea: price at the green lower edge — wait for Buy; at the red upper edge — wait for Sell. Against the channel's direction, signals are weaker.

1.3 Support/Resistance Zones 

Hand-drawn levels — different ones today, different ones tomorrow, and stops pile up right where you drew yesterday's line.
The indicator finds levels on its own, from confirmed swing pivots over the last SRZ_InpLookback bars (5000 by default), and updates them without trader intervention.
  • Green — support, red — resistance.
  • Weak zone — thin dashed line (1 touch). Strong zone — thick solid line + rectangular fill ( InpStrongTouches =2+ touches) — the key levels to watch first. Label next to the line: STRONG/WEAK RESISTANCE/SUPPORT ZONE price (±% of current) .
  • Broken zones aren't deleted — they remain as a dotted line with the historical memory of the level, not just "the level disappeared".
  • Nearby price touches (radius broken price label — a InpTouchPts ) merge into a single zone instead of duplicating — the touch counter grows, the zone stays one.

How to read it: price moves from level to level. Open a position from a strong level, and place the target before reaching the next strong level, not right on it. Bounce or breakout: Bounce — in a sideways/weak trend: find the nearest strongest level, wait for the bounce to start, trade in its direction. Breakout — in a strong trend: wait for the level to break + a retest of the same level from the other side, trade in the breakout's direction.
Advanced idea: you don't need to wait for every module to agree at once — 2–3 factors (level + channel edge + EMA turn) already give a noticeably more reliable entry point than a level alone.

1.4 Pressure Dots + Pump/Dump + Divergences (TudasCandleSignals)

Candles say a lot, but it's hard to track every tick — you miss half the clues, and the ones you do notice get interpreted a little differently each time.
Big-player pressure — colored dots next to the candle's wick:
  1. Dot at the low, green — buying pressure.
  2. Dot at the high, red — selling pressure.
  3. Dot size = pressure strength (close offset from the bar's center, reinforced by anomalous volume). Weak signals (below Pressure_MinStrength ) aren't drawn.
  • Pump (green label with an up arrow) — volatility compression + volume increase on the breakout bar + a close above the compression range. A zone where big players were quietly building a position — an impulse is brewing.
  • Dump (red label with a down arrow) — a recent high pierced followed by a weak close — a classic retail stop-hunt, a strong sell signal.

Divergence counter — one of the strongest phenomena in technical analysis: price marks a new extreme, but the oscillator doesn't — the move is losing strength underneath. Calculated across 11 oscillators at once (RSI, MACD, Stochastic, AO, CCI, Momentum, OBV, ADX, MFI, ROC, WPR):
  • Red arrow up — bearish divergence, green down — bullish.
  • Number in the circle — how many oscillators confirmed the divergence (minimum InpMinCount =3, maximum 11).
  • Filled circle — also confirmed by money flow (OBV/MFI diverged too) — a reinforced signal.
  • False divergences, after which no real move followed ( InpProveBars bars), remove themselves retroactively.
Simple idea: bullish divergence at the bottom — wait for Buy; bearish at the top — wait for Sell. The higher the number in the circle, the stronger the signal.

1.5 "Instant Technical Analysis" Panel

Everything described above is manual work: looking at 5 different layers and weighing what they say together yourself. The panel does this automatically.
15 factors, reliability scale 0–30

№ 

Factor


Source


1–4
EMA20/50/100/200 trend
slope of the EMA Ribbon lines
5 Price channel
PriceChannel state
6 "Whale" event (VSA)
narrow bar+anomalous volume+close at the edge = pressure; wide bar+anomalous volume = impulse
7 Volume delta
volume on bullish bars minus bearish bars
8-12 RSI/Stochastic/MFI/CCI/Momentum
rising/falling over recent bars
13 Latest divergence
if more recent than AN_DivRecencyBars bars
14 Position next to an S/R zone
closer to support or resistance
15 Latest Pump/Dump
if more recent than AN_PumpDumpRecencyBars bars

  • Each factor contributes +1 (buy side), −1 (sell side), or 0. The sum determines direction, reliability = |sum|×2, max 30 — but the more factors that ACTUALLY line up at the same time, the higher and more reliable that number is, and vice versa: 2–3 points means almost nothing lined up, the signal isn't worth attention. The signal fires when reliability ≥ AN_MinScoreToFire (a threshold calibrated against the real score distribution — the theoretical max of 30 is nearly unreachable), no more than once every AN_CooldownBars bars, and only on an already-closed bar — reliability matters more than how fast it appears. What appears on the chart when it fires:
  • BUY/SELL XX% badge next to the entry.
  • Analysis panel: sections "1) Trend / 2) Levels / 3) Entry Confirmation" — each factor with a colored dot (green = favors buy, red = favors sell, yellow = neutral), then Reliability: N/30 points , entry/SL/TP, risk/reward ratio, and a live line below that updates every bar: the current floating result while the position is "open", and after closing, the final outcome by stop or by take.
  • Entry level and SL — in large white text, so they don't get lost on the chart.
  • TP1/TP2/TP3 — from the nearest S/R zones in the trade's direction, but never closer than the stop (minimum 1R/2R/3R) — the risk/reward ratio is protected at the calculation level, not just visually.
  • Touch counter at the bottom left — how many times TP1/TP2/TP3/SL were actually reached across every signal fired during the session

Part 2 — Bottom Indicator: TudasDownCombined.mq5

2.1 Money Flow

Price is rising, but money is actually leaving the asset — you can't see this in the candles, and the move dies right after you enter, because there's no real buyer behind it.
Money Flow shows the intensity of capital entering and leaving the asset, before this shows up in price, not after. The line is smoothed through a cascade of EMAs to strip out small-player noise and show the direction the big players are setting.
  • Flow rising — money coming in — bullish signal.
  • Flow falling — money leaving — bearish signal.
  • Green zone (near 100%) — market top. Red zone (near 0%) — market bottom.
  • Single label in the corner: Flow: NN% .

Simple idea: price leaves the red zone (bottom) and flow starts rising — wait for Buy. Leaving the green zone (top) with flow falling — wait for Sell. Works best with the flow's direction — shorting against a rising flow of big players is risky, that kind of counter-signal is best filtered out.


2.2 Trend Ribbon

The wave just started, or is it already ending — by eye these two states are almost indistinguishable.
The ribbon is colored by direction: green — rising wave, red — falling wave. A color change at the wave's turn is a possible reversal signal.


Advanced idea (three-wave combo): determine the overall trend with Money Flow → confirm with an Impulse turn → enter on the ribbon/analysis-panel signal → results tend to be more precise on higher timeframes.


2.3 Impulse

There's movement on the chart, but no force behind it — the trade reverses right after you enter, because there was no real volume behind the impulse.
Impulse is the fastest, least smoothed layer in the package: the wave changes color by direction (green = bullish mood, red = bearish), wave size = current strength of buyers/sellers, dots at peaks/troughs = turning points.

Three uses:
  1. Entry — in an uptrend, the best entries are green dots on a green wave.
  2. Averaging in — the same colored dot again, in the same direction — you can add to the position with the trend.
  3. Taking profit — an opposite-colored dot appears — signal to close the position.

Being the fastest layer, it's not enough on its own — by default it's used as an early warning, with reliability confirmed by Money Flow/the Ribbon/the analysis panel. Works best with an already established trend.

2.4 Whales (VSA)

A big player is quietly building a position while retail jumps in right at the peak.

The module analyzes bar volume and range (honest disclaimer: forex/CFD brokers don't provide data on individual trade sizes — this is volume analysis under the Wyckoff methodology, not a literal "whale detector")

  • Pressure (narrow bar + anomalous volume + close at the edge) = absorption/distribution — a phase where a big player is accumulating or unloading a position.
  • Impulse trades (wide bar + anomalous volume) = an aggressive trade already opened by a big player.
  • The wave doesn't cut off instantly — it holds and decays smoothly, forming a shaped mountain, not an isolated flash.
  • Text labels right on the chart: "R↑/R↓" (reversal — absorption at the bottom/distribution at the top) and "I↑/I↓" (impulse — trend continuation) — green for buy, red for sell.
  • A readiness dot on the main chart — appears when several consecutive events cluster in the same direction ( Kity_ReadinessPersistEvents , 3 by default) — a signal that the accumulation/distribution phase is about to end.

Simple idea: knowing where a big player opens and closes positions means trading alongside the strongest market participants, not against them.

Advanced idea: identify the market phase from the pressure → confirm the big player's strength with impulse trades and the readiness dot → enter with the trend on the signal.

2.5 Overheat Scale

Two typical mistakes: entering after the move already happened, and entering right as the impulse starts fading.
The scale combines 6 oscillators at once (RSI, StochRSI, Stochastic, MFI, CCI, Momentum) into a single compact strip — one unified "sensor" for market overheating, instead of watching six charts at once.
  • Green — overbought (buy-side strength). Red — oversold (sell-side strength). Grey — neutral.
  • Segment brightness = degree of overheating (how far the move has gone).
  • Runs with hysteresis (doesn't switch off instantly at the smallest pullback — there's a separate zone-exit level, so it doesn't flicker every bar).
  • Labels on the right update every tick: RSI (62%), etc
Entry rule: open the trade when overheating first appears, close as the scale starts to fade.
"Buy the green" — enter on green overheating, exit as it fades. "Sell the red" — mirror for red. The more of the 6 oscillators that overheat at the same time, the more reliable the signal.

Part 3 — General Principles

  1. Reliability matters more than speed. Every marker and both panels are calculated only on already-closed bars — a signal may appear a bar later, but it never "changes its mind" afterward.
  2. The more factors that line up at the same time, the stronger the signal — this principle holds at every level of the package: from a single divergence, to all six Overheat Scale oscillators, to the final analysis panel.
  3. Best used with the trend or in a flat market, on higher timeframes. Against the trend, signals are weaker — short targets only, or skip them.
  4. Thresholds and weights are calibration hypotheses, obtained through testing on real data, not dogma — they're tuned to the specific instrument/timeframe via debug mode ( ..._Debug=true ), which prints the real signal distribution to the journal.
  5. Simple strategy — wait for the corresponding layer's Buy/Sell signal and enter. Advanced strategy — don't wait for every module to agree at once; 2–3 matching factors already give a noticeably more reliable entry point than any one alone
Рекомендуем также
The package consists of two MetaTrader 5 indicator files that are normally placed together on the chart: TudasInstantAnalysis.mq5   — the "top" indicator, drawn over price on the main chart. TudasDownCombined.mq5   — the "bottom" indicator, an independent subwindow below the chart. The logic has been calibrated, and continues to be calibrated, against real XAUUSD data. Part 1 — Top Indicator:   TudasInstantAnalysis.mq5 1.1 EMA Ribbon — moving-average ribbon Trend "by eye" on candles is easy t
Индикатор строит текущие котировки, которые можно сравнить с историческими и на этом основании сделать прогноз ценового движения. Индикатор имеет текстовое поле для быстрой навигации к нужной дате. Параметры : Symbol - выбор символа, который будет отображать индикатор; SymbolPeriod - выбор периода, с которого индикатор будет брать данные; IndicatorColor - цвет индикатора; Inverse - true переворачивает котировки, false - исходный вид; Далее идут настройки текстового поля, в которое можно ввес
CyberTradeTHxAI Gold Sniper MT5 Professional Gold Trading Signal Indicator for MetaTrader 5 CyberTradeTHxAI Gold Sniper MT5 is a professional-grade Gold (XAUUSD) trading indicator developed to identify high-probability Buy and Sell opportunities using trend analysis, pullback confirmation, and intelligent market structure detection. Designed for both beginner and advanced traders, the indicator automatically calculates optimal Entry Zones, Stop Loss, and multiple Take Profit levels while provid
Профиль Рынка (Market Profile) определяет ряд типов дней, которые помогают трейдеру распознать поведение рынка. Ключевая особенность - это область значений (Value Area), представляющая диапазон ценового действия, в котором произошло 70% торговли. Понимание области значений может помочь трейдерам вникнуть в направление рынка и установить торговлю с более высокими шансами на успех. Это отличное дополнение к любой системе, которую вы возможно используете. Blahtech Limited представляет сообществу Me
Premium level - это уникальный индикатор с точностью правильных прогнозов  более 80%!  Данный индикатор тестировался более двух месяцев лучшими Специалистами в области Трейдинга!  Индикатор авторский такого вы больше не где не найдете!  По скриншотах можете сами увидеть точностью данного инструмента!  1 отлично подходит для торговли бинарными опционами со временем экспирации на 1 свечу. 2 работает на всех валютных парах, акциях, сырье, криптовалютах Инструкция: Как только появляется красная стре
Russian Этот индикатор служит передовым помощником по анализу графиков для трейдеров, предпочитающих торговлю по графическим паттернам. Он разработан для снижения нагрузки при визуальном анализе и повышения точности извлечения прибыли. Основные преимущества данного индикатора с практической точки зрения: 1. Автоматическое распознавание паттернов (Automated Pattern Detection) Экономия времени и снижение предвзятости: Вам больше не нужно вручную чертить трендовые линии. Индикатор находит ценовые р
##   ONLY GOLD ##   Тiльки Золото ## **Mercaria Professional Trading Zones - Complete Guide** ## **Mercaria Professional Trading Zones - Повний посібник** ### **How Mercaria Zones Work / Як працюють зони Mercaria** **English:** Mercaria Zones is an advanced trading indicator that identifies high-probability support and resistance areas using ZigZag extremes combined with mathematical zone calculations. The indicator works on multiple timeframes simultaneously, providing a comprehensive view
SophieSMC One is a premium Smart Money Concepts indicator designed specifically for XAUUSD (Gold) traders who want a cleaner, more structured and institutional approach to the market. Built around real market structure concepts, SophieSMC One combines multiple Smart Money Concepts tools into one powerful and visually clean trading system for MetaTrader 5. FEATURES: • BOS & CHoCH market structure detection • Fair Value Gap (FVG) identification • Liquidity sweep visualization • Order Block recog

Вот версия на русском языке, готовая для публикации в MQL5 Market: Volume Profile Multiple — Множественные профили объёма с буферами для алгоритмической торговли Устали строить Volume Profile блок за блоком, перерисовывая и пересчитывая его при каждой смене таймфрейма? Volume Profile Multiple автоматически строит на графике несколько последовательных профилей объёма, показывая, где реально находился институциональный интерес в каждом отрезке рынка — а не только в последнем видимом диапазоне. Что
Cumulative Volume Delta MA-X MTF (с градиентным импульсом) Этот индикатор выполняет мультитаймфреймовый анализ кумулятивной дельты объема (CVD) для платформы MetaTrader 5. Он рассчитывает чистую разницу между давлением покупателей и продавцов, анализируя тиковые данные или реальный объем, что позволяет визуально оценить настроения потока ордеров. Логика и функции индикатора Индикатор использует математический подход к анализу объема: Источники данных: Поддержка как реального объема ( Real Volum
Heiken Ashi CE Filtered - индикатор, генерирующий торговые сигналы на основе свечей Heiken Ashi c использованием дополнительной фильтрации. Для фильтрации используется: Chandelier Exits , основанный на изменении ATR, для определения направления торговли. Вы можете скачать этот индикатор здесь: Chandelier Exits Zero Lags SMA ,  основанный на линейной регрессии, для дополнительного подтверждения тренда.  Вы можете скачать этот индикатор здесь:  Zero Lags SMA Основные функции : Сигналы на покупку/п
Part 2 — Bottom Indicator: TudasDownCombined.mq5 2.1 Money Flow Price is rising, but money is actually leaving the asset — you can't see this in the candles, and the move dies right after you enter, because there's no real buyer behind it. Money Flow shows the intensity of capital entering and leaving the asset, before this shows up in price, not after. The line is smoothed through a cascade of EMAs to strip out small-player noise and show the direction the big players are setting. Flow rising
PatternScope — Multi-Pattern Recognition for MT5 PatternScope is a multi-pattern recognition indicator for MetaTrader 5. It scans price action for classic chart patterns, confirms breakouts, and draws clear   Entry, Stop Loss and Take Profit   levels. A compact dashboard shows the latest pattern, bias and Risk:Reward. Patterns:   Double Top/Bottom, Triple Top/Bottom, Head and Shoulders (and inverted), Bullish & Bearish Flag, Pennant, Rising & Falling Wedge, Triangle, Rectangle, Cup and Handle —
SMART ATR GRID PRO++ – Adaptive Grid Intelligence Suite is a next-generation, institutional-grade grid trading indicator engineered for traders who demand precision, adaptability, and comprehensive market structure analysis. By seamlessly integrating   Adaptive Volatility Grid System ,   KAMA Candle Trend Filtering ,   Multi-Factor Trend Detection (ADX + EMA20/50) ,   Dynamic Heatmap Zone Engine , and   Real-Time Market Regime Classification , this indicator delivers a complete decision-making
Обучаемый искуственный интеллект и нейронные сети. Финансовый индикатор SolarTrade Suite - Theia Market Indicator! Это индикатор, который использует особые инновационные и передовые алгоритмы для рассчета своих значений, Ваш Помошник в Мире Финансовых Рынков. Индикатор SolarTrade Suite - Theia Market Indicator предсказывает цену финансового инструмента на несколько значений вперед и отображает свои показания в виде комментария в окне терминала. Проверьте другие наши продукты из серии SolarTr
Gann Time–Price Square Cycles (MT5) Этот индикатор реализует концепцию баланса времени и цены, предложенную У.Д. Ганном. Он выявляет ценовые свинги на графике и проецирует временные интервалы циклов Quarter, Half и Full вперёд, отмечая их вертикальными линиями. Инструмент предназначен для того, чтобы помочь трейдерам изучать взаимосвязь между величиной ценового движения и прошедшим временем непосредственно на графиках MT5. Функции Определяет локальные максимумы и минимумы на основе глубины пиво
Данный индикатор аналогичен популярному Heiken Ashi Smoothed. Для MetaTrader 5 уже есть индикатор Heikin Ashi, но он обладает двумя недостатками: Он не точно рисует свечи. Невозможно изменить ширину свечей. Посмотрите также Heikin Ashi в MQL5 Code Base . В данной версии отсутствуют вышеописанный недостатки.
GoldPro Max
Taher Ahmed Mohamed Taha Elshafei
GOLDPRO MAX Advanced Multi-Timeframe and Smart Money Market Analysis for MetaTrader 5 GoldPro Max is a professional market analysis indicator for MetaTrader 5 designed to help traders study market direction, price structure, liquidity, market imbalance and potential trading areas from multiple perspectives. The indicator combines Multi-Timeframe Analysis, Smart Money Concepts, Market Structure, Liquidity Analysis, Order Blocks, Fair Value Gaps, Premium and Discount analysis, Smart Analytical Eng
Auto-levels trading robot: key levels & risk manager Short Description: Automatically plots dynamic weekly support and resistance zones with real-time risk tracking. Full Description: Elevate your chart analysis with a dynamic tool designed to map the market structure effortlessly. This indicator automatically calculates and plots critical support and resistance levels based on weekly price action, updating every new week to align seamlessly with current market dynamics. By projecting precise pe
GDS Renko Pip ST Chart - Pip-Based Renko Chart Indicator for MetaTrader 5 GDS Renko Pip ST Chart is a pip-based Renko chart indicator for MetaTrader 5. It helps traders build and study cleaner Renko price movement using a practical fixed pip or point-based brick structure. This tool is designed as a Renko chart foundation for manual analysis. It does not predict the market, does not generate buy or sell signals and does not decide whether a trade should be opened. Renko EDGE EA Golden Delta | A
GDS Renko Pip ST - Fixed Brick Renko Chart Tool for MetaTrader 5 GDS Renko Pip ST is a Renko chart tool for MetaTrader 5 designed for traders who want to build and study fixed brick Renko movement using a practical pip or point-based setup. The purpose of this tool is simple: create a cleaner Renko structure so the trader can observe direction, brick runs, pullbacks, support and resistance behavior without normal candle noise. This is not a signal indicator and it does not predict the market. It
Ing (inguz,ingwar) - 23-я руна старшего футарка ᛝ, Unicode+16DD. Добавьте немного рунической магии в ваши торговые стратегии. Правильная разметка дневного чарта обозначит вам удачные моменты для контр-трендовой торговли. Просто использовать, имеет высокую эффективность в волатильных участках. Будьте осторожны в боковых движениях. Сигналы  ᛝ генерируются при пересечении основных линий построения. Красная стрелка вниз - рекомендованы продажи Синяя стрелка вверх - рекомендованы покупки редкие фиоле
ONNYX INDICATOR — версия 1.14 Индикатор зон спроса и предложения для MetaTrader 5 без перерисовки подтвержденных сигналов. Он определяет подтвержденные ценовые экстремумы, строит зоны с шириной на основе ATR, оценивает качество зон в процентах и показывает стрелки BUY/SELL на закрытых свечах. ОСНОВНЫЕ ВОЗМОЖНОСТИ - Зоны спроса и предложения с процентной оценкой внутри зоны. - Увеличенные стрелки BUY/SELL после подтверждения закрытой свечи. - Фильтр тренда EMA и подтверждение отклонения цены. - П
Noize Absorption Index - is the manual trading system that measures the difference of pressure between bears forces and bulls forces. Green line - is a noize free index that showing curent situation. Zero value of index shows totally choppy/flat market.Values above zero level shows how powerfull bullish wave is and values below zero measures bearish forces.Up arrow appears on bearish market when it's ready to reverse, dn arrow appears on weak bullish market, as a result of reverse expectation.
Passband Filter Pro Passband Filter Pro is a trend and cycle oscillator for MetaTrader 5. It is built on the Ehlers Super Passband Filter, a band pass filter that removes long term trend drift and short term noise so that only the dominant market cycle remains. The result is a clean oscillator with a color cloud that shows overbought and oversold conditions, cycle turns, and momentum on forex, gold, indices, stocks and crypto. Most traders enter too early or too late. Simple moving averages la
Trade Extender
Loncey Duwarkah
5 (1)
Autonomously executes trades, overseeing the entire process from initiation to completion.  Free support via chat, email and remote assistance Originally built for XAUUSD (Gold). Settings changes for other symbols Powerful rules management Enhanced positioning features Risk Management / Dynamic lot sizing Quick Setup Symbols : XAUUSD Investment for all: Our trading bot is crafted to serve traders of all investment levels, ensuring accessibility to the forex market even for those with limited fu
Enigmera MT5
Ivan Stefanov
3.67 (3)
Enigmera — ручной индикатор и торговая система для MetaTrader 5. Он использует фрактальные циклы для расчёта уровней поддержки и сопротивления, отмечает фазу накопления и показывает направление и цель текущего движения. Анализ применим как в тренде, так и в коррекции. Индикатор управляется вручную с помощью кнопок на графике. Его можно запустить в тестере стратегий MetaTrader в визуальном режиме и изучить поведение на исторических данных до принятия решения о покупке; часть функций, управляемых
Volume Profile Canvas - Professional Volume Profile Indicator for MetaTrader 5 DESCRIPTION Volume Profile Canvas is a professional volume profile indicator for MetaTrader 5 that renders directly on the chart using a high-performance Canvas engine. It calculates and displays the volume distribution across price levels, identifying the Point of Control (POC), Value Area High (VAH) and Value Area Low (VAL) in real time. This is a pure analysis tool. It does not trade. It gives you an instant vi
LuoMo Volume & Price Structure 8.98 A multi-function chart indicator for   MetaTrader 4 and MetaTrader 5 , designed to display key volume, volatility, sentiment, and price-structure information directly on the main chart. Main Features Volume and price-based Support & Resistance Volume spike and exhaustion signals ATR volatility expansion alerts Volume Profile with HVN and LVN Bullish and bearish sentiment distribution Developing or fixed POC VAH and VAL levels Supply and Demand zones Volume-wei
RBreaker Gold Indicators — это краткосрочная внутридневная торговая стратегия для фьючерсов на золото, которая сочетает в себе два подхода: трендовое следование и внутридневные развороты. Она позволяет не только получать прибыль при трендовом движении, но и своевременно фиксировать прибыль при развороте рынка, открывая позиции в новом направлении. Данная стратегия на протяжении 15 лет подряд входила в десятку самых прибыльных торговых стратегий по версии американского журнала Futures Truth. Она
С этим продуктом покупают
ARICoin is a powerful trading companion designed to generate high-probability entry signals with dynamic TP/SL/DP levels based on volatility. Built-in performance tracking shows win/loss stats, PP1/PP2 hits, and success rates all updated live. Key Features: Buy/Sell signals with adaptive volatility bands Real-time TP/SL/DP levels based on ATR Built-in MA Filter with optional ATR/StdDev volatility Performance stats panel (Success, Profit/Loss, PP1/PP2) Alerts via popup, sound, push, or email Cust
MERAVITH SCANNER — это профессиональный индикатор финансовых рынков для MetaTrader 5, который объединяет несколько аналитических инструментов в единую интегрированную систему. Он выполняет все расчёты автоматически, используя собственную методологию средневзвешенной цены по объёму (VWAP), полностью исключая субъективную интерпретацию. Индикатор работает на всех классах активов (Forex, акции, индексы, товары, криптовалюты) и на всех таймфреймах от M1 до Monthly. Базовый принцип заключается в том,
MasterTrend Indicator for MT5 A powerful trend-following and signal-evaluation tool MasterTrend   is a custom MT5 indicator that combines Moving Averages and ATR-based risk/reward logic to generate clear buy/sell signals. It visualizes dynamic SL/TP levels, evaluates past trade outcomes, and displays win/loss statistics in a clean on-chart panel. Key features include: Buy/Sell signals based on MA crossovers ATR-based SL/TP1/TP2/TP3 levels with visual lines and labels Signal outcome tracking wit
AriX
Temirlan Kdyrkhan
1 (4)
AriX Indicator for MT5 A powerful trend-following and signal-evaluation tool AriX is a custom MT5 indicator that combines Moving Averages and ATR-based risk/reward logic to generate clear buy/sell signals. It visualizes dynamic SL/TP levels, evaluates past trade outcomes, and displays win/loss statistics in a clean on-chart panel. Key features include: Buy/Sell signals based on MA crossovers ATR-based SL/TP1/TP2/TP3 levels with visual lines and labels Signal outcome tracking with real-time stat
ScalpPoint is a powerful trading companion designed to generate high-probability entry signals with dynamic TP/SL/DP levels based on volatility. Built-in performance tracking shows win/loss stats, PP1/PP2 hits, and success rates — all updated live. Key Features: Buy/Sell signals with adaptive volatility bands Real-time TP/SL/DP levels based on ATR Built-in MA Filter with optional ATR/StdDev volatility Performance stats panel (Success, Profit/Loss, PP1/PP2) Alerts via popup, sound, push, or emai
PrimeScalping is a powerful trading companion designed to generate high-probability entry signals with dynamic TP/SL/DP levels based on volatility. Built-in performance tracking shows win/loss stats, PP1/PP2 hits, and success rates — all updated live. Key Features: Buy/Sell signals with adaptive volatility bands Real-time TP/SL/DP levels based on ATR Built-in MA Filter with optional ATR/StdDev volatility Performance stats panel (Success, Profit/Loss, PP1/PP2) Alerts via popup, sound, push, or e
Робот с видео приложен во вкладке "Обсуждение" , он работает одним ордером и только по сигналам для оценки эффективности индикатора. Pan PrizMA CD Phase является опцией, построенной на базе индикатора Pan PrizMA . Подробнее . Усреднение полиномом второй-четвертой степени повышает гладкость линий, добавляет инерцию и соответственно ритмичность. Экстраполяция функцией синусоиды около константы позволяет регулировать запаздывание или опережение. Значение фазы - параметра состояния волны (близко по
Классификатор силы тренда. Показания на истории не меняет. Изменяется классификация только незакрытого бара. По идее подобен полной системе ASCTrend, сигнальный модуль которой, точнее его аппроксимация в несколько "урезанном" виде, есть в свободном доступе, а также в терминале как сигнальный индикатор SilverTrend . Точной копией системы ASCTrend не является. Работает на всех инструментах и всех временных диапазонах. Индикатор использует несколько некоррелируемых между собой алгоритмов для класси
FFx Universal Strength Meter PRO - это больше, чем простой измеритель силы. Вместо того, чтобы ограничивать расчет ценой, его значения могут быть основаны на любом из 19 встроенных режимов измерения силы + 9 таймфреймов. С FFx USM вы сможете задавать любой период для любой комбинации таймфреймов. Например, вы можете установить панель на последние 10 свечей на M15-H1-H4… Полная гибкость! Простая интерпретация... Это дает отличное представление о том, какие валюты слабые и сильные, поэтому вы смож
Индикатор FFx Universal MTF Alerter показывает все тайфреймы (от M1 до месячного) на одном графике, отображая статус выбранного индикатора на каждом из них. 9 индикаторов (MACD-RSI-Stochastic-MA-ADX-Ichimoku-Candles-CCI-PSAR). Каждый из них можно несколько раз применять на одном графике с различными настройками. Простая интерпретация. Сделки на покупку подтверждаются, когда большинство таймфреймов показывается зеленым цветом. А сделки на продажу подтверждаются, когда большинство таймфреймов пока
FFx Watcher PRO - панель для отображения на одном графике текущего направления стандартных индикаторов (до 15 одновременно) на нескольких таймфреймах (до 21). Панель работает в двух режимах: Режим Watcher: Мульти-индикаторный Пользователь может выбрать до 15 индикаторов для отображения Пользователь может выбрать до 21 таймфрейма для отображения Режим Watcher: Мультивалютный Пользователь может выбрать любое количество символов Пользователь может выбрать до 21 таймфрейма для отображения В этом реж
Индикатор FFx Patterns Alerter дает торговые рекомендации по входу в рынок, по уровням TP 1, TP 2 и SL на основе любого из выбранных паттернов (PinBar, Engulfing, InsideBar, OutsideBar) Предлагаются следующие варианты: Для работы с несколькими парами можно запускать несколько экземпляров индикатора на одном графике. Рекомендации по входу - количество пипсов, которые будут добавлены после пробоя для входа в рынок 3 различных варианта расчета SL - по пипсам, с использованием множителя ATR или по м
Версия для MetaTrader 4 доступна здесь : https://www.mql5.com/ru/market/product/24881 FFx Basket Scanner ищет до пяти индикаторов среди 16 доступных на всех парах и таймфреймах. Таким образом вы можете ясно увидеть торговли по каким валютам следует избегать, а на каких сосредоточить внимание. Когда валюта переходит в экстремальную зону (например, 20/80%), вы можете торговать всей корзиной с большей уверенностью. Другая область применения индикатора – определение сильных и слабых валют для поиск
Версия для MetaTrader 4 доступна здесь: https://www.mql5.com/ru/market/product/25793 FFx Pivot SR Suite PRO - это полный набор инструментов для построения уровней поддержки и сопротивления. Поддержка и сопротивление - самые используемые уровни во всех видах торговли. Их можно использовать для поиска разворотов тренда, установки уровней тейк-профита и стоп-лосса и т.д. Индикатор можно полностью настроить непосредственно с графика Выбор из 4 периодов для расчетов: 4-часовой, дневной, недельный и
ClassicSBA
Umri Azkia Zulkarnaen
this indicator very simple and easy if you understand and agree with setup and rule basic teknical sba you can cek in link : please cek my youtube channel for detail chanel : an for detail info  contact me  basicly setup buy (long) for this indicator is Magenta- blue and green candle or magenta - green  and green candlestik and for setup sell (short) is Black - yellow - and red candle or black - red  and red candlestik
WanaScalper
Isaac Wanasolo
1 (1)
A scalping indicator based on mathematical patterns, which on average gives signals with relatively small SL, and also occasionally helps to catch big moves in the markets (more information in the video) This indicator has three main types of notifications: The first type warns of a possible/upcoming signal on the next bar The second type indicates the presence of a ready signal to enter the market/open a position The third type is for SL and TP levels - you will be notified every time price re
Recommended TimeFrame >= H1. 100% Non Repainted at any moment.  Use it carefully, only with Trend Direction. Trading Usage: 2 Variants: as Range System or as BreakOut System (Both Only With Trend Direction)::: (Always use StopLoss for minimise Risk); [1] as Range System: (Recommended) in UP TREND:  - BUY in Blue Line , then if price goes down by 50 points (on H1) open Second BUY.   Close in any Profit you wish: TrailingStop(45 points) or Close when Price touches upper Gold Line. in DOWN TREND
этот индикатор является индикатором детектора спайков, он специально разработан для обмена на Boom 1000, Boom 500, Crash 1000 и Crash 500 Мы рекомендуем использовать его только для индексов Deriv Boom и Crash. Его настройки интуитивно понятны, знакомы, просты в использовании имеет функции уведомления; звуковые уведомления и push-уведомления. этот инструмент прост в использовании, прост в обращении Это обновление основано на разных стратегиях для шипов.
Limitless MT5  - это универсальный индикатор который подойдет каждому как начинающему так и опытному трейдеру работает на всех валютных парах криптовалютах сыре акциях Limitless MT5 - уже настроен и не требует дополнительной настройки   А теперь главное Почему  Limitless MT5 ? 1 полное отсутствие перерисовки  2 два года тестирования лучшими специалистами в трейдинге 3 точность правильных сигналов превышает 80% 4 хорошо показал себя в торговле во время выхода новостей Правила торговли  1 сигнал н
Trend and Signals MT5  indicator scans  30 trading Instruments (Forex, Metals and Indices).     It uses special algorithm on the  current market   based on   Pure Price Action   and display the overall trend and signal on the dashboard. When signals are produced the indicator sends alert and notification. Strategy for Signals This indicator uses the daily timeframe to determine the direction of the trend. The hourly timeframe is used to identify possible entries. Main trend and is determined by
This indicator is based on a mathematical formula and an ANN combined, designed to make a model(using previous prices) of the most recent market condition (any chart*) in order to use the model as a forecasting tool. *This indicator can operate on any chart/timeframe, but it's suggested you use multiple timeframes for each trade because this method relies solely on the time factor, you can not use this indicator to predict price volatility, but if it's fit correctly it will show you when the nex
This indicator is based on the crossing of two Moving Average with the RSI It is intended for scalpers Specially designed for Boom and Crash syhtetic indices from Binary.com/Deriv.com It is easy to use and intuitive. We recommend its use on M1 and is equipped with three types of notification Email alert Sound notification Push notification these parameters can be activated and deactivated.
IVISTscalp5
Vadym Zhukovskyi
5 (6)
[iVISTscalp5]:  Лаборатория исследования поведения рынка через время TLV Framework | Liquidity Activation Points Общее описание iVISTscalp5 — это мультиуровневый индикатор таймингов и ценовой структуры, разработанный в рамках проекта VISTmany. Система прогнозирует время, направление и диапазон движения через Liquidity Activation Points (тайминги). Индикатор iVISTscalp5 можно использовать с параметрами по умолчанию для любого финансового инструмента. -----------------------------------------
This indicator is a scalping indicator intended solely for the Boom and Crash indices of the Deriv Limited market It supports Boom 500, Boom 1000, Crash 500 and Crash 1000 Not repaint and no bug The settings are intuitive and easy to use The product activation number is 20 The Time Frame used depends on the user If you are an aggressive scalper then just use M1 For long trades use M15 If you are conservative use M5 Please contact me for more details of its use
Индикатор Recuroid показывает очень хорошие точки входа. Просто посмотрите на скриншоты, после чего скачайте бесплатную версию и посмотрите в тестере стратегий и вы сами убедитесь. Работает система на основе двух ключевых алгоритмов.  Первый алгоритм (управляемый) создает систему сбалансированного перехода из зоны покупки в зону продажы и наоборот, рисует стрелки и линии, формирует входы.  Второй алгоритм (управляющий) корректирует исходные данные для первого алгоритма (управляемого) за счет и
Прямая трансляция индикатора на YouTube. Пожалуйста, нажмите на ссылку ниже для большего доверия. Есть также видео индикатора, которые вы можете посмотреть. Обратите внимание, что трансляция запаздывает, не полагайтесь на нее. Только обзор индикатора только обзор точности индикатора, который почти не проигрывает и доходность доходит до 95%.Буду работать с большой точностью на CRASH монете 1000 INDICES
MMM Gold Sniper MT5
Gilang Wardhana Purnama Putra
Indicator is based on   Market Maker Strategy.   NO REPAINT. MM's are traders and their objective is to make money.  This includes strategies to trade against retails traders.  The major difference between them and other traders is that they have the ability, through access to massive volumes, to move price at their will.  So to make money, they aim to buy at a lower price and then sell at a higher price. They achieve this by:  1. Inducing traders to take positions. This is achieved by using a
Tatino Super Signals is Non Repaint Indicator for Binary Option trading and Forex trading. Recommendations: Timeframe: All timeframes. For best results we recommend using it on M1, M5 and M15 timeframes. Currency pairs: All Pairs Account type: All Type Broker time: Any Brokers : Alls Binary Trading : Expired 1 Candle Buffer Buy=1, Sell=0, Entry Next Candle Recommended Forex trading stop loss : 15 pips Recommended  Forex tradingTake profit levels : 15 pips Specifications: Does not repaint   Pa
Magicx
Hasan Abdulhussein
The indicator places a buy or sell signal when the conditions of the strategy it was designed with are met. The strategy is guaranteed, strong, and has been tested for 9 years. The indicator is for binary options and can be converted into a bot by linking it to MT2Trading, where it sends the signal to this platform. This platform automatically opens a trade on the trading platform you are using, whether it is Pocket Option, IQ Option, or any other binary options platforms. The entry is on the n
Это индикатор для бинарных опционов. Он рассчитывает свечи поглощения с подтверждением сигнала скользящей средней. На графике отображаются зеленые стрелки Buy и Red Sell. Он был протестирован на 3-минутном и 5-минутном графике с несколькими парами (EUR/USD, EUR/JPY, USD/JPY... и т. д.). Он будет работать на внебиржевом рынке Pocketoption, а также на внебиржевом рынке EUR/JPY и внебиржевом рынке EUR/USD. Для начинающих, Если вы используете мартингейл, рекомендуемые настройки: Первоначальные ин
Другие продукты этого автора
ARGUS Breakout Universal — Volatility Breakout EA for MT5 A fully automated breakout trading system built on one core principle: enter only when the market is truly moving, protect capital when it is not. No martingale. No grid. No averaging. How It Works The EA detects consolidation zones — periods where price compresses within a tight range. When price breaks out with volume confirmation, the EA enters in the breakout direction, filtered by a Daily SMA trend filter to avoid counter-trend trade
The Opening Range Breakout Portfolio The Opening Range Breakout Portfolio A fully automated, intraday diversification system for US stock indices. > INSTITUTIONAL-GRADE LOGIC. SINGLE-CHART SIMPLICITY. Diversification over aggression Most automated systems rely on aggressive risk parameters applied to a single setup. The Opening Range Breakout Portfolio pursues a smoother equity curve through breadth. Target Trades the opening range of the US cash session. Scope Spans multiple index symbols and t
KijunMaster EA 基準線 Expert Advisor for MetaTrader 5 Kijun Master Two classic Ichimoku plays, executed with machine discipline. KijunMaster buys the pullback when a trend rejects the Kijun-sen, and fades the spike when the line goes flat. Nothing else, ever. Hard stop on every trade Closed-bar signals, zero repaint No martingale No grid No averaging down The idea One line, two regimes, one EA that knows the difference Every Ichimoku trader on the planet watches the same line. The Kijun-sen is the
The package consists of two MetaTrader 5 indicator files that are normally placed together on the chart: TudasInstantAnalysis.mq5   — the "top" indicator, drawn over price on the main chart. TudasDownCombined.mq5   — the "bottom" indicator, an independent subwindow below the chart. The logic has been calibrated, and continues to be calibrated, against real XAUUSD data. Part 1 — Top Indicator:   TudasInstantAnalysis.mq5 1.1 EMA Ribbon — moving-average ribbon Trend "by eye" on candles is easy t
Part 2 — Bottom Indicator: TudasDownCombined.mq5 2.1 Money Flow Price is rising, but money is actually leaving the asset — you can't see this in the candles, and the move dies right after you enter, because there's no real buyer behind it. Money Flow shows the intensity of capital entering and leaving the asset, before this shows up in price, not after. The line is smoothed through a cascade of EMAs to strip out small-player noise and show the direction the big players are setting. Flow rising
Фильтр:
Нет отзывов
Ответ на отзыв