Argus Indicator

The package consists of two MetaTrader 5 indicator files that are normally placed together on the chart:
  • TudasInstantAnalysis.mq5 — the "top" indicator, drawn over price on the main chart.
  • TudasDownCombined.mq5 — the "bottom" indicator, an independent subwindow below the chart.
The logic has been calibrated, and continues to be calibrated, against real XAUUSD data.


Part 1 — Top Indicator: TudasInstantAnalysis.mq5


1.1 EMA Ribbon — moving-average ribbon

Trend "by eye" on candles is easy to confuse with a pullback: you end up trading against the move right when a local correction looks like a reversal.
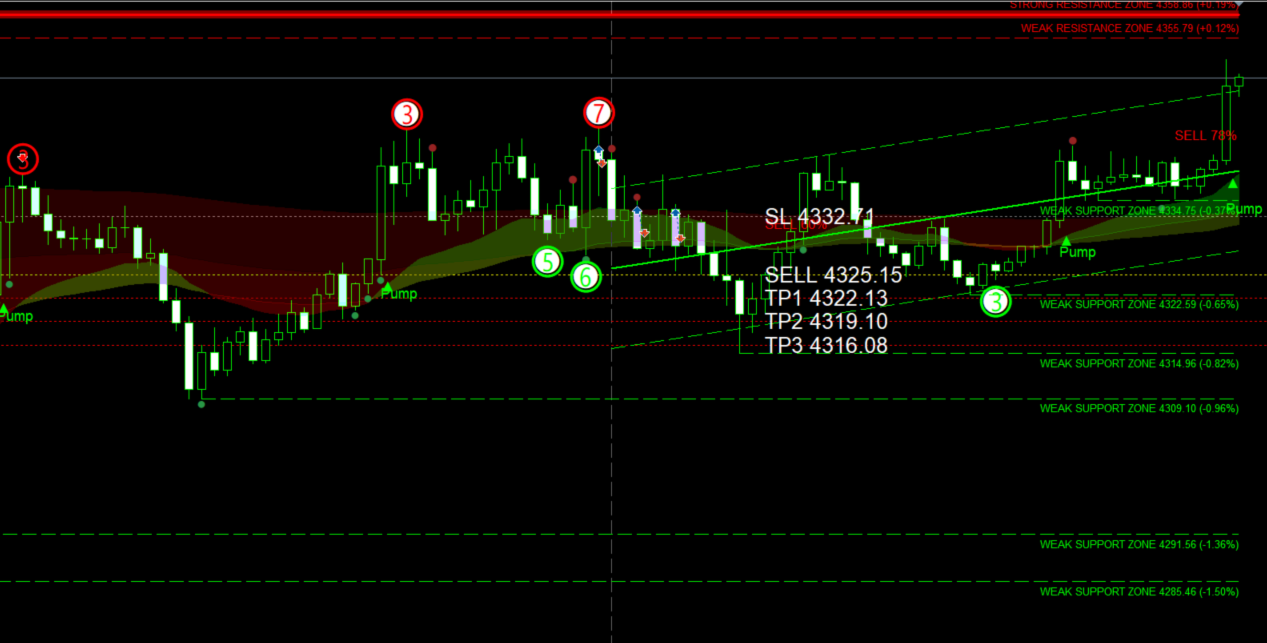
The ribbon removes that subjectivity: four EMAs (20, 50, 100, 200) are colored automatically based on their direction.
  • Green — the line is rising (slope faster than InpFlatATR ×ATR per bar).
  • Red — falling.
  • Yellow — sideways, slope within the threshold.
  • Line thickness increases with the period: EMA20 is the thinnest, EMA200 the thickest.
  • Semi-transparent clouds fill the space between neighboring lines: green when the upper EMA sits above the lower one, red when it's the other way around

How to read trend strength: the 4 lines fan out to the same side and the clouds share the same color — a strong, stable trend. The lines weave together and flip color often — the market is sideways, better to skip signals.
Simple idea: price pulls back to a green EMA — wait for a buy signal from another module in the package (mirror for red). Works best with the trend or in a flat market; against the trend, take short targets only or skip the signal.
1.2 Price Channel(PriceChannel)
An entry "out of thin air", with no relation to structure — it's unclear exactly where you went wrong if the trade didn't work out.
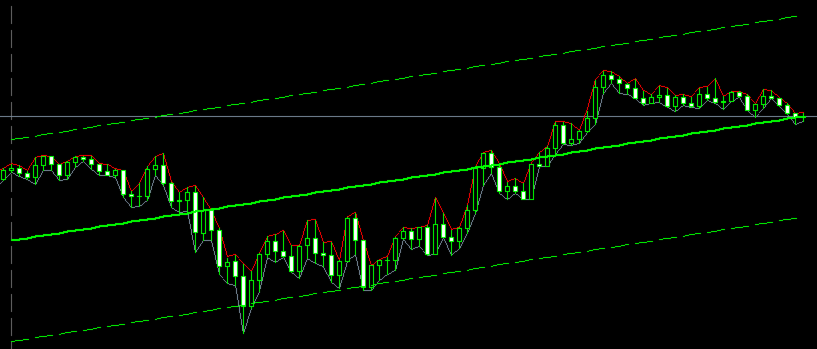
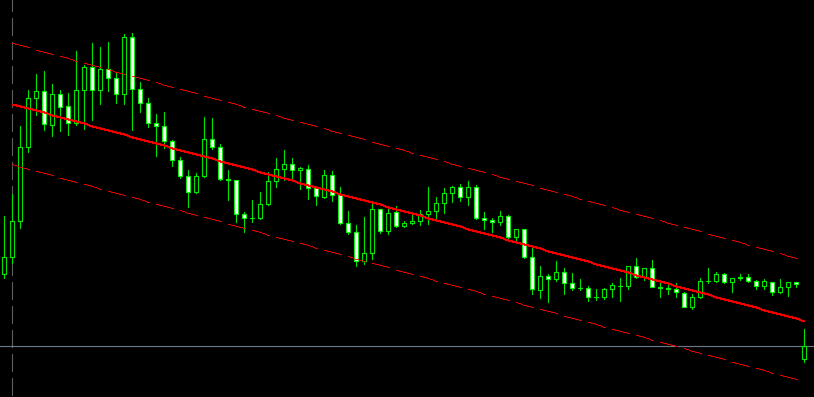
The linear-regression channel over the last InpLength bars (50 by default) gives an entry from the edge, not from nowhere: three lines — mean (solid) + upper/lower (dashed), width = ± InpMult ×standard deviation.

  • Green (BULL) / Red (BEAR) / Yellow (FLAT) — based on the regression slope, normalized and compared against the InpThreshold threshold.
  • Label in the chart corner: PriceChannel: BULL/BEAR/FLAT slope X.XX .
  • Wide channel = high volatility/strong trend. Narrow channel = calm before an impulse — the market "coiling like a spring".


How to read it: the channel edges act as support/resistance; after a breakout, the middle line usually switches roles. The channel's direction filters out false signals against the trend.
Simple idea: price at the green lower edge — wait for Buy; at the red upper edge — wait for Sell. Against the channel's direction, signals are weaker.

1.3 Support/Resistance Zones 

Hand-drawn levels — different ones today, different ones tomorrow, and stops pile up right where you drew yesterday's line.
The indicator finds levels on its own, from confirmed swing pivots over the last SRZ_InpLookback bars (5000 by default), and updates them without trader intervention.
  • Green — support, red — resistance.
  • Weak zone — thin dashed line (1 touch). Strong zone — thick solid line + rectangular fill ( InpStrongTouches =2+ touches) — the key levels to watch first. Label next to the line: STRONG/WEAK RESISTANCE/SUPPORT ZONE price (±% of current) .
  • Broken zones aren't deleted — they remain as a dotted line with the historical memory of the level, not just "the level disappeared".
  • Nearby price touches (radius broken price label — a InpTouchPts ) merge into a single zone instead of duplicating — the touch counter grows, the zone stays one.

How to read it: price moves from level to level. Open a position from a strong level, and place the target before reaching the next strong level, not right on it. Bounce or breakout: Bounce — in a sideways/weak trend: find the nearest strongest level, wait for the bounce to start, trade in its direction. Breakout — in a strong trend: wait for the level to break + a retest of the same level from the other side, trade in the breakout's direction.
Advanced idea: you don't need to wait for every module to agree at once — 2–3 factors (level + channel edge + EMA turn) already give a noticeably more reliable entry point than a level alone.

1.4 Pressure Dots + Pump/Dump + Divergences (TudasCandleSignals)

Candles say a lot, but it's hard to track every tick — you miss half the clues, and the ones you do notice get interpreted a little differently each time.
Big-player pressure — colored dots next to the candle's wick:
  1. Dot at the low, green — buying pressure.
  2. Dot at the high, red — selling pressure.
  3. Dot size = pressure strength (close offset from the bar's center, reinforced by anomalous volume). Weak signals (below Pressure_MinStrength ) aren't drawn.
  • Pump (green label with an up arrow) — volatility compression + volume increase on the breakout bar + a close above the compression range. A zone where big players were quietly building a position — an impulse is brewing.
  • Dump (red label with a down arrow) — a recent high pierced followed by a weak close — a classic retail stop-hunt, a strong sell signal.

Divergence counter — one of the strongest phenomena in technical analysis: price marks a new extreme, but the oscillator doesn't — the move is losing strength underneath. Calculated across 11 oscillators at once (RSI, MACD, Stochastic, AO, CCI, Momentum, OBV, ADX, MFI, ROC, WPR):
  • Red arrow up — bearish divergence, green down — bullish.
  • Number in the circle — how many oscillators confirmed the divergence (minimum InpMinCount =3, maximum 11).
  • Filled circle — also confirmed by money flow (OBV/MFI diverged too) — a reinforced signal.
  • False divergences, after which no real move followed ( InpProveBars bars), remove themselves retroactively.
Simple idea: bullish divergence at the bottom — wait for Buy; bearish at the top — wait for Sell. The higher the number in the circle, the stronger the signal.

1.5 "Instant Technical Analysis" Panel

Everything described above is manual work: looking at 5 different layers and weighing what they say together yourself. The panel does this automatically.
15 factors, reliability scale 0–30

№ 

Factor


Source


1–4
EMA20/50/100/200 trend
slope of the EMA Ribbon lines
5 Price channel
PriceChannel state
6 "Whale" event (VSA)
narrow bar+anomalous volume+close at the edge = pressure; wide bar+anomalous volume = impulse
7 Volume delta
volume on bullish bars minus bearish bars
8-12 RSI/Stochastic/MFI/CCI/Momentum
rising/falling over recent bars
13 Latest divergence
if more recent than AN_DivRecencyBars bars
14 Position next to an S/R zone
closer to support or resistance
15 Latest Pump/Dump
if more recent than AN_PumpDumpRecencyBars bars

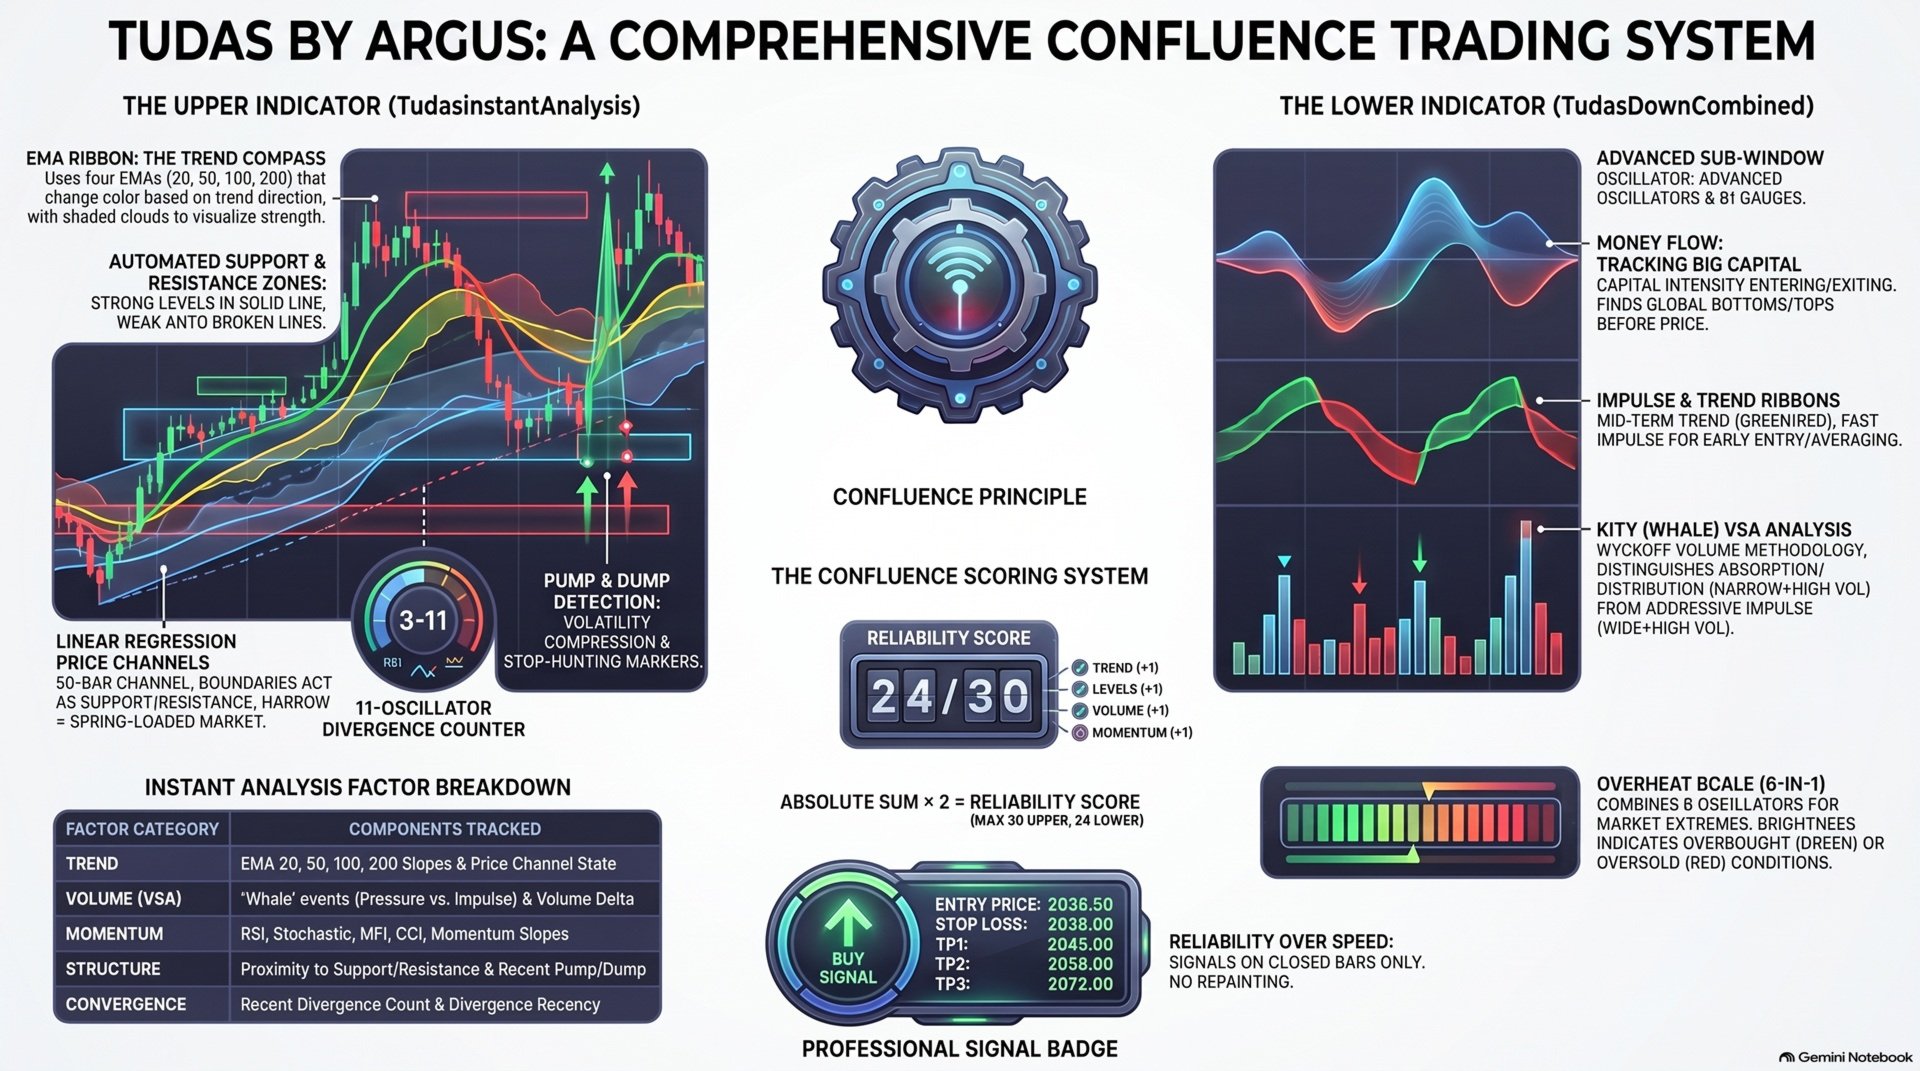
  • Each factor contributes +1 (buy side), −1 (sell side), or 0. The sum determines direction, reliability = |sum|×2, max 30 — but the more factors that ACTUALLY line up at the same time, the higher and more reliable that number is, and vice versa: 2–3 points means almost nothing lined up, the signal isn't worth attention. The signal fires when reliability ≥ AN_MinScoreToFire (a threshold calibrated against the real score distribution — the theoretical max of 30 is nearly unreachable), no more than once every AN_CooldownBars bars, and only on an already-closed bar — reliability matters more than how fast it appears. What appears on the chart when it fires:
  • BUY/SELL XX% badge next to the entry.
  • Analysis panel: sections "1) Trend / 2) Levels / 3) Entry Confirmation" — each factor with a colored dot (green = favors buy, red = favors sell, yellow = neutral), then Reliability: N/30 points , entry/SL/TP, risk/reward ratio, and a live line below that updates every bar: the current floating result while the position is "open", and after closing, the final outcome by stop or by take.
  • Entry level and SL — in large white text, so they don't get lost on the chart.
  • TP1/TP2/TP3 — from the nearest S/R zones in the trade's direction, but never closer than the stop (minimum 1R/2R/3R) — the risk/reward ratio is protected at the calculation level, not just visually.
  • Touch counter at the bottom left — how many times TP1/TP2/TP3/SL were actually reached across every signal fired during the session

Part 2 — Bottom Indicator: TudasDownCombined.mq5

2.1 Money Flow

Price is rising, but money is actually leaving the asset — you can't see this in the candles, and the move dies right after you enter, because there's no real buyer behind it.
Money Flow shows the intensity of capital entering and leaving the asset, before this shows up in price, not after. The line is smoothed through a cascade of EMAs to strip out small-player noise and show the direction the big players are setting.
  • Flow rising — money coming in — bullish signal.
  • Flow falling — money leaving — bearish signal.
  • Green zone (near 100%) — market top. Red zone (near 0%) — market bottom.
  • Single label in the corner: Flow: NN% .

Simple idea: price leaves the red zone (bottom) and flow starts rising — wait for Buy. Leaving the green zone (top) with flow falling — wait for Sell. Works best with the flow's direction — shorting against a rising flow of big players is risky, that kind of counter-signal is best filtered out.


2.2 Trend Ribbon

The wave just started, or is it already ending — by eye these two states are almost indistinguishable.
The ribbon is colored by direction: green — rising wave, red — falling wave. A color change at the wave's turn is a possible reversal signal.


Advanced idea (three-wave combo): determine the overall trend with Money Flow → confirm with an Impulse turn → enter on the ribbon/analysis-panel signal → results tend to be more precise on higher timeframes.


2.3 Impulse

There's movement on the chart, but no force behind it — the trade reverses right after you enter, because there was no real volume behind the impulse.
Impulse is the fastest, least smoothed layer in the package: the wave changes color by direction (green = bullish mood, red = bearish), wave size = current strength of buyers/sellers, dots at peaks/troughs = turning points.

Three uses:
  1. Entry — in an uptrend, the best entries are green dots on a green wave.
  2. Averaging in — the same colored dot again, in the same direction — you can add to the position with the trend.
  3. Taking profit — an opposite-colored dot appears — signal to close the position.

Being the fastest layer, it's not enough on its own — by default it's used as an early warning, with reliability confirmed by Money Flow/the Ribbon/the analysis panel. Works best with an already established trend.

2.4 Whales (VSA)

A big player is quietly building a position while retail jumps in right at the peak.

The module analyzes bar volume and range (honest disclaimer: forex/CFD brokers don't provide data on individual trade sizes — this is volume analysis under the Wyckoff methodology, not a literal "whale detector")

  • Pressure (narrow bar + anomalous volume + close at the edge) = absorption/distribution — a phase where a big player is accumulating or unloading a position.
  • Impulse trades (wide bar + anomalous volume) = an aggressive trade already opened by a big player.
  • The wave doesn't cut off instantly — it holds and decays smoothly, forming a shaped mountain, not an isolated flash.
  • Text labels right on the chart: "R↑/R↓" (reversal — absorption at the bottom/distribution at the top) and "I↑/I↓" (impulse — trend continuation) — green for buy, red for sell.
  • A readiness dot on the main chart — appears when several consecutive events cluster in the same direction ( Kity_ReadinessPersistEvents , 3 by default) — a signal that the accumulation/distribution phase is about to end.

Simple idea: knowing where a big player opens and closes positions means trading alongside the strongest market participants, not against them.

Advanced idea: identify the market phase from the pressure → confirm the big player's strength with impulse trades and the readiness dot → enter with the trend on the signal.

2.5 Overheat Scale

Two typical mistakes: entering after the move already happened, and entering right as the impulse starts fading.
The scale combines 6 oscillators at once (RSI, StochRSI, Stochastic, MFI, CCI, Momentum) into a single compact strip — one unified "sensor" for market overheating, instead of watching six charts at once.
  • Green — overbought (buy-side strength). Red — oversold (sell-side strength). Grey — neutral.
  • Segment brightness = degree of overheating (how far the move has gone).
  • Runs with hysteresis (doesn't switch off instantly at the smallest pullback — there's a separate zone-exit level, so it doesn't flicker every bar).
  • Labels on the right update every tick: RSI (62%), etc
Entry rule: open the trade when overheating first appears, close as the scale starts to fade.
"Buy the green" — enter on green overheating, exit as it fades. "Sell the red" — mirror for red. The more of the 6 oscillators that overheat at the same time, the more reliable the signal.

Part 3 — General Principles

  1. Reliability matters more than speed. Every marker and both panels are calculated only on already-closed bars — a signal may appear a bar later, but it never "changes its mind" afterward.
  2. The more factors that line up at the same time, the stronger the signal — this principle holds at every level of the package: from a single divergence, to all six Overheat Scale oscillators, to the final analysis panel.
  3. Best used with the trend or in a flat market, on higher timeframes. Against the trend, signals are weaker — short targets only, or skip them.
  4. Thresholds and weights are calibration hypotheses, obtained through testing on real data, not dogma — they're tuned to the specific instrument/timeframe via debug mode ( ..._Debug=true ), which prints the real signal distribution to the journal.
  5. Simple strategy — wait for the corresponding layer's Buy/Sell signal and enter. Advanced strategy — don't wait for every module to agree at once; 2–3 matching factors already give a noticeably more reliable entry point than any one alone
推荐产品
Tudas by Argus UP
Yevhen Hladchenko
The package consists of two MetaTrader 5 indicator files that are normally placed together on the chart: TudasInstantAnalysis.mq5   — the "top" indicator, drawn over price on the main chart. TudasDownCombined.mq5   — the "bottom" indicator, an independent subwindow below the chart. The logic has been calibrated, and continues to be calibrated, against real XAUUSD data. Part 1 — Top Indicator:   TudasInstantAnalysis.mq5 1.1 EMA Ribbon — moving-average ribbon Trend "by eye" on candles is easy t
该指标建立当前报价,可以与历史报价进行比较,并在此基础上进行价格走势预测。指示器有一个文本字段,用于快速导航到所需日期。 选项: 符号 - 选择指标将显示的符号; SymbolPeriod - 选择指标从中获取数据的时段; IndicatorColor - 指示器颜色; HorisontalShift - 由指标绘制的报价移动指定的柱数; Inverse - true 反转引号,false - 原始视图; ChartVerticalShiftStep - 图表垂直移动(键盘上的向上/向下箭头); 接下来是文本字段的设置,您可以在其中输入日期,您可以通过按“回车”立即跳转到该日期。 接下来是文本字段的设置,您可以在其中输入日期,您可以通过按“回车”立即跳转到该日期。
CyberTradeTHxAI Gold Sniper MT5 Professional Gold Trading Signal Indicator for MetaTrader 5 CyberTradeTHxAI Gold Sniper MT5 is a professional-grade Gold (XAUUSD) trading indicator developed to identify high-probability Buy and Sell opportunities using trend analysis, pullback confirmation, and intelligent market structure detection. Designed for both beginner and advanced traders, the indicator automatically calculates optimal Entry Zones, Stop Loss, and multiple Take Profit levels while provid
Blahtech Market Profile MT5
Blahtech Limited
5 (10)
Was: $249  Now: $99   Market Profile defines a number of day types that can help the trader to determine market behaviour. A key feature is the Value Area, representing the range of price action where 70% of trading took place. Understanding the Value Area can give traders valuable insight into market direction and establish the higher odds trade. It is an excellent addition to any system you may be using. Inspired by Jim Dalton’s book “Mind Over Markets”, this indicator is designed to suit the
Wedge Pattern MT5
Sathit Sukhirun
Chinese 这款指标就像是为热衷于图表形态交易的交易者提供的高级图表分析助手。它的设计初衷是减轻视觉分析的负担,并提高盈利的准确性。 从实际应用角度来看,这款指标的主要优势如下: 1. 自动形态检测 (Automated Pattern Detection) 节省时间并减少偏见: 您无需再手动绘制趋势线。指标会寻找价格波段的高低点(Pivot High/Low),并在价格结构符合条件时,自动绘制出上升楔形(Rising Wedge)和下降楔形(Falling Wedge)的框架。 涵盖所有情况: 能够检测正在形成的形态、突破(Breakout)的瞬间,甚至是失败(Failed)的形态,让您清晰地掌握市场全貌。 2. 内置目标和斐波那契止盈 (Built-in Targets & Fibonacci TP) 自动计算目标: 当发生突破时,系统会根据楔形开口的宽度立即计算出主要目标(Main Target)距离,让您明确知道该把止盈(Take Profit)设在哪里。 支持分批平仓 (Scaling Out): 划出多达5个级别的斐波那契线作为子止盈点,非常适合喜欢在关键支撑/阻力位分
##   ONLY GOLD ##   Тiльки Золото ## **Mercaria Professional Trading Zones - Complete Guide** ## **Mercaria Professional Trading Zones - Повний посібник** ### **How Mercaria Zones Work / Як працюють зони Mercaria** **English:** Mercaria Zones is an advanced trading indicator that identifies high-probability support and resistance areas using ZigZag extremes combined with mathematical zone calculations. The indicator works on multiple timeframes simultaneously, providing a comprehensive view

SophieSMC One
Junel Abellana
SophieSMC One is a premium Smart Money Concepts indicator designed specifically for XAUUSD (Gold) traders who want a cleaner, more structured and institutional approach to the market. Built around real market structure concepts, SophieSMC One combines multiple Smart Money Concepts tools into one powerful and visually clean trading system for MetaTrader 5. FEATURES: • BOS & CHoCH market structure detection • Fair Value Gap (FVG) identification • Liquidity sweep visualization • Order Block recog
Volume Profile Multiple — 多区块成交量分布指标,带缓冲区数据接口,支持算法交易 还在为每次切换周期都要重新绘制、重新计算成交量分布图而烦恼吗? Volume Profile Multiple 可在图表上自动绘制多个连续的成交量分布区块,揭示机构资金在市场各个阶段的真实活动区域——而不仅仅局限于最近可见的价格区间。 功能说明 该指标将历史价格按每 N 根K线划分为若干区块(区块数量和每区块的K线数量均可自定义),并为每个区块计算完整的成交量分布数据:控制点(POC)、价值区上下沿(VAH/VAL),以及高成交量节点和低成交量节点(HVN/LVN)。最终呈现的是一幅逐区块的市场结构可视化地图,便于识别基于真实成交量的筹码集中区、支撑阻力位,以及价格在不同价值区之间的轮动情况。 同样为算法交易而设计 与大多数成交量分布指标不同,本指标不仅提供可视化功能:它还输出 3个数据缓冲区 (最新区块的 POC、VAH、VAL),完全兼容 StrategyQuant X 以及任何 MQL5 智能交易系统(EA)。这意味着您可以直接基于这些关键价位构建交易策略,无需重新编写成交量
Cumulative Volume Delta MA-X MTF(带梯度动量) 该指标为 MetaTrader 5 提供多时区累积成交量德尔塔(CVD)分析。它通过分析报价成交量(Tick Volume)或真实成交量(Real Volume)数据,计算买盘与卖盘压力之间的净差值,从而直观地展示订单流(Order Flow)情绪。 指标逻辑与特性 本指标采用数学方法进行成交量分析: 数据来源 :支持交易所资产的 真实成交量 (Real Volume) ,以及针对外汇/CFD 市场的 OHLC 影线代理算法 (OHLC Wick Proxy) 。 梯度系统 :4 色移动平均线用于识别趋势阶段: 深天蓝 (DeepSkyBlue) :数值为正且正在上升。 橙色 (Orange) :数值为正但正在下降。 洋红色 (Magenta) :数值为负且正在下降。 紫色 (Purple) :数值为负但正在上升。 五层共振系统 (5-Layer Confluence System) 指标集成了五种不同的分析方法: 第一层:成交量德尔塔核心 (Volume Delta Core) —— 计算成交量德尔塔的
Overview Heiken Ashi CE Filtered MT5 is a technical indicator for the MetaTrader 5 platform. It integrates smoothed candlestick charting with a dynamic exit strategy and a customizable trend filter to deliver clear buy and sell signals. The indicator is designed to improve trend detection and signal reliability by reducing market noise. If you want to see more high-quality products or order the development/conversion of your own products, visit my partners' website: 4xDev Get 10% OFF on manual
Tudas by Argus DOWN
Yevhen Hladchenko
Part 2 — Bottom Indicator: TudasDownCombined.mq5 2.1 Money Flow Price is rising, but money is actually leaving the asset — you can't see this in the candles, and the move dies right after you enter, because there's no real buyer behind it. Money Flow shows the intensity of capital entering and leaving the asset, before this shows up in price, not after. The line is smoothed through a cascade of EMAs to strip out small-player noise and show the direction the big players are setting. Flow rising
PatternDetector
Thien Thanh Tran
PatternScope — Multi-Pattern Recognition for MT5 PatternScope is a multi-pattern recognition indicator for MetaTrader 5. It scans price action for classic chart patterns, confirms breakouts, and draws clear   Entry, Stop Loss and Take Profit   levels. A compact dashboard shows the latest pattern, bias and Risk:Reward. Patterns:   Double Top/Bottom, Triple Top/Bottom, Head and Shoulders (and inverted), Bullish & Bearish Flag, Pennant, Rising & Falling Wedge, Triangle, Rectangle, Cup and Handle —
Smart ATR Grid Pro
Syamsurizal Dimjati
SMART ATR GRID PRO++ – Adaptive Grid Intelligence Suite is a next-generation, institutional-grade grid trading indicator engineered for traders who demand precision, adaptability, and comprehensive market structure analysis. By seamlessly integrating   Adaptive Volatility Grid System ,   KAMA Candle Trend Filtering ,   Multi-Factor Trend Detection (ADX + EMA20/50) ,   Dynamic Heatmap Zone Engine , and   Real-Time Market Regime Classification , this indicator delivers a complete decision-making
可训练的人工智能和神经网络。 SolarTrade Suite 金融指标 - Theia 市场指标! 这款指标采用特殊的创新和先进算法来计算其数值, 是您金融市场的得力助手。 SolarTrade Suite - Theia 市场指标可以提前几步预测金融工具的价格, 并在终端窗口中以注释的形式显示其读数。 请在产品描述底部查看我们 SolarTrade Suite 系列的其他产品。 您想自信地畅游投资和金融市场吗? SolarTrade Suite - Theia 市场指标是一款创新的软件,旨在帮助您做出明智的投资决策并提升您的利润。 SolarTrade Suite - Theia 市场指标金融指标的优势: - 精准计算:我们的指标采用先进的算法和分析方法,能够准确预测市场走势。 在这种情况下,它就是高效的人工智能。 - 用户友好的界面:直观的界面让您轻松掌握程序,并在安装后立即享受其优势。 - 专家支持:我们的专业团队随时准备解答您的任何问题,并提供程序使用建议。 立即试用 SolarTrade Suite 金融指标 - Theia 市场指标,让您的投资决策充满
Gann Time–Price Square Cycles (MT5) This indicator applies the concept of time–price balance introduced by W.D. Gann. It detects price swings on the chart and projects Quarter, Half, and Full cycle time intervals forward, marking them with vertical lines. The tool is designed to help traders study the relationship between swing size and elapsed time directly on MT5 charts. Functions Detects swing highs and lows based on pivot depth and minimum swing size. Projects Quarter, Half, and Full harmon
This indicator is the same as the popular Heiken Ashi Smoothed. The Heikin Ashi indicator for MetaTrader 5 already exists, but it has two disadvantages: It paints the candles not accurate. It's not possible to change the candle width. See also Heikin Ashi in MQL5 Code Base . In this version there are no such disadvantages.
GoldPro Max
Taher Ahmed Mohamed Taha Elshafei
GOLDPRO MAX Advanced Multi-Timeframe and Smart Money Market Analysis for MetaTrader 5 GoldPro Max is a professional market analysis indicator for MetaTrader 5 designed to help traders study market direction, price structure, liquidity, market imbalance and potential trading areas from multiple perspectives. The indicator combines Multi-Timeframe Analysis, Smart Money Concepts, Market Structure, Liquidity Analysis, Order Blocks, Fair Value Gaps, Premium and Discount analysis, Smart Analytical Eng
Auto-levels trading robot: key levels & risk manager Short Description: Automatically plots dynamic weekly support and resistance zones with real-time risk tracking. Full Description: Elevate your chart analysis with a dynamic tool designed to map the market structure effortlessly. This indicator automatically calculates and plots critical support and resistance levels based on weekly price action, updating every new week to align seamlessly with current market dynamics. By projecting precise pe
GDS Renko Pip ST Chart - Pip-Based Renko Chart Indicator for MetaTrader 5 GDS Renko Pip ST Chart is a pip-based Renko chart indicator for MetaTrader 5. It helps traders build and study cleaner Renko price movement using a practical fixed pip or point-based brick structure. This tool is designed as a Renko chart foundation for manual analysis. It does not predict the market, does not generate buy or sell signals and does not decide whether a trade should be opened. Renko EDGE EA Golden Delta | A
GDS Renko Pip ST - Fixed Brick Renko Chart Tool for MetaTrader 5 GDS Renko Pip ST is a Renko chart tool for MetaTrader 5 designed for traders who want to build and study fixed brick Renko movement using a practical pip or point-based setup. The purpose of this tool is simple: create a cleaner Renko structure so the trader can observe direction, brick runs, pullbacks, support and resistance behavior without normal candle noise. This is not a signal indicator and it does not predict the market. It
Inguz
Maxim Kuznetsov
Ing (inguz,ingwar) - the 23rd rune of the elder Futhark ᛝ, Unicode+16DD. Add some runic magic to your trading strategies. The correct marking of the daily chart will indicate to you the successful moments for counter-trend trading. Simple to use, has high efficiency in volatile areas. Be careful in lateral movements. Signals ᛝ are generated when the main lines of construction intersect. Red arrow down - recommended sales Blue up arrow - recommended purchases rare purple arrows indicate exce
ONNYX INDICATOR 版本 1.14 这是一款用于 MetaTrader 5 的供需区域分析指标。已确认的历史信号采用收盘K线逻辑,避免确认后的箭头因盘中波动而消失。指标根据确认的摆动高低点建立区域,使用 ATR 调整区域宽度,并以百分比显示区域质量。 主要功能 - 供需区域及区域内百分比评分。 - 收盘K线确认后的放大 BUY/SELL 箭头。 - 可选 EMA 趋势过滤和K线拒绝确认。 - 趋势、价格水平和市场环境面板。 - 最多显示 5 条相关经济新闻;公布前显示 Forecast 和 Previous,公布后显示 Actual。 - 新闻每 60 秒刷新,并支持策略测试器中的日历缓存。 - 弹窗、推送和邮件提醒。 - iCustom 集成:缓冲区 0 为 BUY 价格,缓冲区 1 为 SELL 价格。 使用方法 将指标加载到图表,等待历史数据完成加载,查看趋势和有效区域,然后结合自己的交易计划使用收盘K线信号。XAUUSD H1 适合更清晰的结构,M15 可获得更频繁的机会。 重要提示 本产品是分析指标,不是自动交易 EA,不会自动开仓、修改或平仓,也不保证盈利。请先
Noize Absorption Index
Ekaterina Saltykova
Noize Absorption Index - is the manual trading system that measures the difference of pressure between bears forces and bulls forces. Green line - is a noize free index that showing curent situation. Zero value of index shows totally choppy/flat market.Values above zero level shows how powerfull bullish wave is and values below zero measures bearish forces.Up arrow appears on bearish market when it's ready to reverse, dn arrow appears on weak bullish market, as a result of reverse expectation.
Passband Filter Pro Passband Filter Pro is a trend and cycle oscillator for MetaTrader 5. It is built on the Ehlers Super Passband Filter, a band pass filter that removes long term trend drift and short term noise so that only the dominant market cycle remains. The result is a clean oscillator with a color cloud that shows overbought and oversold conditions, cycle turns, and momentum on forex, gold, indices, stocks and crypto. Most traders enter too early or too late. Simple moving averages la
Trade Extender
Loncey Duwarkah
5 (1)
Autonomously executes trades, overseeing the entire process from initiation to completion.  Free support via chat, email and remote assistance Originally built for XAUUSD (Gold). Settings changes for other symbols Powerful rules management Enhanced positioning features Risk Management / Dynamic lot sizing Quick Setup Symbols : XAUUSD Investment for all: Our trading bot is crafted to serve traders of all investment levels, ensuring accessibility to the forex market even for those with limited fu
Enigmera MT5
Ivan Stefanov
3.67 (3)
Enigmera 是一款用于 MetaTrader 5 的手动指标与交易系统。它利用分形周期计算支撑与阻力位,标记积累阶段,并绘制当前走势的方向与目标。该分析在趋势行情与回调行情中均适用。 该指标通过图表上的按钮手动操作。可以在 MetaTrader 策略测试器的可视模式下运行,在购买前查看它在历史数据上的表现;部分由按钮控制的功能在测试器中的表现可能与实盘图表不同。 工作原理 指标根据品种的分形周期推导出当前趋势的支撑线、支撑线周围的允许偏离通道、三个偏离水平以及目标线。支撑线定义了市场状态:价格保持在其上方时趋势延续,跌破该线则表示趋势改变。已经绘制的线条不会重绘。 大部分功能通过图表左侧的按钮控制,因此可以在市场状况变化时快速调整显示内容。 按钮 ON/OFF:显示或隐藏整个指标。 Support:趋势的主支撑线。 Ch:启用支撑通道,显示允许的偏离范围。 Dev1:价格在支撑偏离范围内运行,表示盘整或积累。 Dev2:价格在各偏离水平之间运行,表示趋势形成及其方向。 Dev3:价格运行显示趋势加速与波动加大。 45deg:显示市场相对于 45 度线的运行速度。 Tgt:趋势的目
Volume Profile Canvas
Mauro Italo Gaspari
Volume Profile Canvas - Professional Volume Profile Indicator for MetaTrader 5 DESCRIPTION Volume Profile Canvas is a professional volume profile indicator for MetaTrader 5 that renders directly on the chart using a high-performance Canvas engine. It calculates and displays the volume distribution across price levels, identifying the Point of Control (POC), Value Area High (VAH) and Value Area Low (VAL) in real time. This is a pure analysis tool. It does not trade. It gives you an instant vi
TradeAQ
Guo Sheng Zhao
这个量价结构指标是一款适用于   MetaTrader 4 和 MetaTrader 5   的图表分析指标,集量价结构、成交量分布、市场情绪、波动提示和关键价格区域展示于一体。指标直接运行在主图窗口,可帮助交易者快速观察市场的重要价格位置与活跃程度。 主要功能 1. 量价结构支撑与阻力 自动标记连续量价结构形成的潜在支撑位和阻力位,辅助识别价格可能出现停顿、反应或突破的位置。 支持两种分析模式: 成交量结构 价格结构 线条颜色、宽度和样式均可自定义。 2. 成交量尖峰提示 当市场成交量显著放大时,在图表中显示醒目标记,帮助发现异常活跃、加速、衰竭或可能发生方向变化的行情。 可选功能包括: 尖峰图标提示 尖峰价格水平线 高点、低点、收盘价或组合价位显示 自定义成交量阈值 3. 高波动行情提示 自动标记波动明显扩张的 K 线,方便交易者及时发现突破、加速和快速行情。 支持: 高波动图标 关键价格水平线 自定义检测周期与敏感度 自定义线条颜色、宽度和样式 4. 成交量分布 在图表右侧显示指定范围内的成交量分布,直观呈现不同价格区域的交易活跃程度。 主要显示内容包括: 高成交量节点 低成交量
RBreaker
Zhong Long Wu
RBreaker Gold Indicators 是黄金期货一种短线日内交易策略,它结合了趋势跟踪和日内反转两种交易方式,既能捕捉趋势行情的利润,又能在行情反转时及时止盈并顺势反手。 该策略曾连续15年被美国《Futures Truth》杂志评选为前十大最赚钱的交易策略之一,具有很长的生命周期,至今仍在国内外普遍使用与研究。 本指标结合了2026年期货黄金的走势,依据14日ATR指标,分别定义了突破系数A,观察系数B,反转系数R更合理的数值,非常不错的指标,已实现年稳定盈利,值得推荐~ 以上指标适合高波动品种,参数适合期货黄金,股指期货等,如果需要其他品种行情,需要单独设定 突破系数A,观察系数B,反转系数R,进行回测才能使用。 欢迎指标售后有问题可以加+V:504282029
该产品的买家也购买
ARIPoint
Temirlan Kdyrkhan
1 (4)
ARIPoint is a powerful trading companion designed to generate high-probability entry signals with dynamic TP/SL/DP levels based on volatility. Built-in performance tracking shows win/loss stats, PP1/PP2 hits, and success rates all updated live. Key Features: Buy/Sell signals with adaptive volatility bands Real-time TP/SL/DP levels based on ATR Built-in MA Filter with optional ATR/StdDev volatility Performance stats panel (Success, Profit/Loss, PP1/PP2) Alerts via popup, sound, push, or email Cu
ARICoins
Temirlan Kdyrkhan
ARICoin is a powerful trading companion designed to generate high-probability entry signals with dynamic TP/SL/DP levels based on volatility. Built-in performance tracking shows win/loss stats, PP1/PP2 hits, and success rates all updated live. Key Features: Buy/Sell signals with adaptive volatility bands Real-time TP/SL/DP levels based on ATR Built-in MA Filter with optional ATR/StdDev volatility Performance stats panel (Success, Profit/Loss, PP1/PP2) Alerts via popup, sound, push, or email Cust
Meravith Scanner
Ivan Stefanov
5 (3)
MERAVITH SCANNER 是一款适用于 MetaTrader 5 的专业金融市场指标,将多种分析工具整合为一个统一的系统。它基于专有的成交量加权平均价格(VWAP)方法自动完成所有计算,完全消除主观判断。 该指标适用于所有资产类别(外汇、股票、指数、大宗商品、加密货币)以及从 M1 到 Monthly 的所有时间周期。其核心原理是价格跟随成交量。MERAVITH 识别机构资金成交量的集中区域,并从该集中区域中推导出数学上精确的价格水平。它不预测,不推测。它只计算。 使用 MERAVITH SCANNER,您可以在 2–3 分钟内扫描全部 28 个主要外汇货币对的所有时间周期。您也可以扫描任何您选择的市场——例如,大约 100 只股票约需 10 分钟。 该指标计算耗尽水平、平衡线、偏差、统计水平以及目标投射。 图表元素 Origin Point 标记所有计算的起始位置。指标会自动将其放置在最佳位置。红色标签(TOP)表示市场高点并带有看跌倾向。绿色标签(BOTTOM)表示市场低点并带有看涨倾向。 Sentiment Line 是一条动态曲线,反映基于成交量加权计算得出的市场情绪。
MasterTrend
Temirlan Kdyrkhan
MasterTrend Indicator for MT5 A powerful trend-following and signal-evaluation tool MasterTrend   is a custom MT5 indicator that combines Moving Averages and ATR-based risk/reward logic to generate clear buy/sell signals. It visualizes dynamic SL/TP levels, evaluates past trade outcomes, and displays win/loss statistics in a clean on-chart panel. Key features include: Buy/Sell signals based on MA crossovers ATR-based SL/TP1/TP2/TP3 levels with visual lines and labels Signal outcome tracking wit
AriX
Temirlan Kdyrkhan
1 (4)
AriX Indicator for MT5 A powerful trend-following and signal-evaluation tool AriX is a custom MT5 indicator that combines Moving Averages and ATR-based risk/reward logic to generate clear buy/sell signals. It visualizes dynamic SL/TP levels, evaluates past trade outcomes, and displays win/loss statistics in a clean on-chart panel. Key features include: Buy/Sell signals based on MA crossovers ATR-based SL/TP1/TP2/TP3 levels with visual lines and labels Signal outcome tracking with real-time stat
ScalpPoint
Temirlan Kdyrkhan
ScalpPoint is a powerful trading companion designed to generate high-probability entry signals with dynamic TP/SL/DP levels based on volatility. Built-in performance tracking shows win/loss stats, PP1/PP2 hits, and success rates — all updated live. Key Features: Buy/Sell signals with adaptive volatility bands Real-time TP/SL/DP levels based on ATR Built-in MA Filter with optional ATR/StdDev volatility Performance stats panel (Success, Profit/Loss, PP1/PP2) Alerts via popup, sound, push, or emai
PrimeScalping
Temirlan Kdyrkhan
PrimeScalping is a powerful trading companion designed to generate high-probability entry signals with dynamic TP/SL/DP levels based on volatility. Built-in performance tracking shows win/loss stats, PP1/PP2 hits, and success rates — all updated live. Key Features: Buy/Sell signals with adaptive volatility bands Real-time TP/SL/DP levels based on ATR Built-in MA Filter with optional ATR/StdDev volatility Performance stats panel (Success, Profit/Loss, PP1/PP2) Alerts via popup, sound, push, or e
Pan PrizMA CD Phase
Aleksey Panfilov
The Expert Advisor and the video are attached in the Discussion tab . The robot applies only one order and strictly follows the signals to evaluate the indicator efficiency. Pan PrizMA CD Phase is an option based on the Pan PrizMA indicator. Details (in Russian). Averaging by a quadric-quartic polynomial increases the smoothness of lines, adds momentum and rhythm. Extrapolation by the sinusoid function near a constant allows adjusting the delay or lead of signals. The value of the phase - wave s
Классификатор силы тренда. Показания на истории не меняет. Изменяется классификация только незакрытого бара. По идее подобен полной системе ASCTrend, сигнальный модуль которой, точнее его аппроксимация в несколько "урезанном" виде, есть в свободном доступе, а также в терминале как сигнальный индикатор SilverTrend . Точной копией системы ASCTrend не является. Работает на всех инструментах и всех временных диапазонах. Индикатор использует несколько некоррелируемых между собой алгоритмов для класси
FFx Universal Strength Meter PRO is more than a basic strength meter. Instead of limiting the calculation to price, it can be based on any of the 19 integrated strength modes + 9 timeframes. With the FFx USM, you are able to define any period for any combination of timeframes. For example, you can set the dashboard for the last 10 candles for M15-H1-H4… Full flexibility! Very easy to interpret... It gives a great idea about which currency is weak and which is strong, so you can find the best pai
The FFx Universal MTF alerter shows on a single chart all the timeframes (M1 to Monthly) with their own status for the chosen indicator. 9 indicators mode (MACD-RSI-Stochastic-MA-ADX-Ichimoku-Candles-CCI-PSAR). Each can be applied multiple times on the same chart with different settings. Very easy to interpret. Confirm your BUY entries when most of the timeframes are showing green color. And confirm your SELL entries when most of the timeframes are showing red color. 2 Alert Options : input to s
FFx Watcher Pro MT5
Eric Venturi-Bloxs
The FFx Watcher PRO is a dashboard displaying on a single chart the current direction of up to 15 standard indicators and up to 21 timeframes. It has 2 different modes: Watcher mode: Multi Indicators User is able to select up to 15 indicators to be displayed User is able to select up to 21 timeframes to be displayed Watcher mode: Multi Pairs User is able to select any number of pairs/symbols User is able to select up to 21 timeframes to be displayed This mode uses one of the standard indicators
FFx Patterns Alerter gives trade suggestions with Entry, Target 1, Target 2 and StopLoss .... for any of the selected patterns (PinBar, Engulfing, InsideBar, OutsideBar) Below are the different options available: Multiple instances can be applied on the same chart to monitor different patterns Entry suggestion - pips to be added over the break for the entry 3 different options to calculate the SL - by pips, by ATR multiplier or at the pattern High/Low 3 different options to calculate the 2 TPs -
FFx Basket Scanner MT5
Eric Venturi-Bloxs
MetaTrader 4 version available here : https://www.mql5.com/en/market/product/24881 FFx Basket Scanner is a global tool scanning all pairs and all timeframes over up to five indicators among the 16 available. You will clearly see which currencies to avoid trading and which ones to focus on. Once a currency goes into an extreme zone (e.g. 20/80%), you can trade the whole basket with great confidence. Another way to use it is to look at two currencies (weak vs strong) to find the best single pairs
MetaTrader 4 version available here: https://www.mql5.com/en/market/product/25793 FFx Pivot SR Suite PRO is a complete suite for support and resistance levels. Support and Resistance are the most used levels in all kinds of trading. Can be used to find reversal trend, to set targets and stop, etc. The indicator is fully flexible directly from the chart 4 periods to choose for the calculation: 4Hours, Daily, Weekly and Monthly 4 formulas to choose for the calculation: Classic, Camarilla, Fibonac
ClassicSBA
Umri Azkia Zulkarnaen
this indicator very simple and easy if you understand and agree with setup and rule basic teknical sba you can cek in link : please cek my youtube channel for detail chanel : an for detail info  contact me  basicly setup buy (long) for this indicator is Magenta- blue and green candle or magenta - green  and green candlestik and for setup sell (short) is Black - yellow - and red candle or black - red  and red candlestik
WanaScalper
Isaac Wanasolo
1 (1)
A scalping indicator based on mathematical patterns, which on average gives signals with relatively small SL, and also occasionally helps to catch big moves in the markets (more information in the video) This indicator has three main types of notifications: The first type warns of a possible/upcoming signal on the next bar The second type indicates the presence of a ready signal to enter the market/open a position The third type is for SL and TP levels - you will be notified every time price re
Recommended TimeFrame >= H1. 100% Non Repainted at any moment.  Use it carefully, only with Trend Direction. Trading Usage: 2 Variants: as Range System or as BreakOut System (Both Only With Trend Direction)::: (Always use StopLoss for minimise Risk); [1] as Range System: (Recommended) in UP TREND:  - BUY in Blue Line , then if price goes down by 50 points (on H1) open Second BUY.   Close in any Profit you wish: TrailingStop(45 points) or Close when Price touches upper Gold Line. in DOWN TREND
Spike Detector
Tete Adate Adjete
this indicator is a Spike detector indicator, it is specially designed to trade Boom 1000, Boom 500, Crash 1000 and Crash 500 We recommend using it on Deriv Boom and Crash indices only Its setting is intuitive, familiar, easy to use it has notification functions; audible notifications and push notifications. this tool is simple to use, easy to handle This update is based on different strategies for spikes
Limitless MT5
Dmitriy Kashevich
Limitless MT5 is a universal indicator suitable for every beginner and experienced trader. works on all currency pairs, cryptocurrencies, raw stocks Limitless MT5 - already configured and does not require additional configuration And now the main thing Why Limitless MT5? 1 complete lack of redrawing 2 two years of testing by the best specialists in trading 3 the accuracy of correct signals exceeds 80% 4 performed well in trading during news releases Trading rules 1 buy signal - the ap
Trend and Signals MT5  indicator scans  30 trading Instruments (Forex, Metals and Indices).     It uses special algorithm on the  current market   based on   Pure Price Action   and display the overall trend and signal on the dashboard. When signals are produced the indicator sends alert and notification. Strategy for Signals This indicator uses the daily timeframe to determine the direction of the trend. The hourly timeframe is used to identify possible entries. Main trend and is determined by
Cycles Forecast
Pooriya Alirezaee
This indicator is based on a mathematical formula and an ANN combined, designed to make a model(using previous prices) of the most recent market condition (any chart*) in order to use the model as a forecasting tool. *This indicator can operate on any chart/timeframe, but it's suggested you use multiple timeframes for each trade because this method relies solely on the time factor, you can not use this indicator to predict price volatility, but if it's fit correctly it will show you when the nex
BC Scalper Aroow
Tete Adate Adjete
This indicator is based on the crossing of two Moving Average with the RSI It is intended for scalpers Specially designed for Boom and Crash syhtetic indices from Binary.com/Deriv.com It is easy to use and intuitive. We recommend its use on M1 and is equipped with three types of notification Email alert Sound notification Push notification these parameters can be activated and deactivated.
IVISTscalp5
Vadym Zhukovskyi
5 (6)
[iVISTscalp5]:通过时间研究市场行为的实验室 TLV Framework | Liquidity Activation Points ⸻ 项目概述 iVISTscalp5 是在 VISTmany 项目框架下开发的多层级时间与价格结构指标。 该系统通过 Liquidity Activation Points(时间激活点 / timings)预测: 市场启动时间 方向 运动范围 iVISTscalp5 指标可使用默认参数应用于任何金融工具。 ⸻ 实际价值 iVISTscalp5 并不是作为传统技术指标而开发的。 它的核心理念是: 让任何人都能够通过“时间”研究市场行为。 ⸻ Time Language VISTmany (TLV) — 项目的核心概念 t(p) t(p) 是 timings 被激活的价格水平。 ⸻ p(p) p(p) 是 iVISTscalp5 指标构建的核心价格水平。 最强的市场反应通常出现在: t(p) 与 p(p) 相互作用时。 ⸻ 在 TLV(Time Language VIST
This indicator is a scalping indicator intended solely for the Boom and Crash indices of the Deriv Limited market It supports Boom 500, Boom 1000, Crash 500 and Crash 1000 Not repaint and no bug The settings are intuitive and easy to use The product activation number is 20 The Time Frame used depends on the user If you are an aggressive scalper then just use M1 For long trades use M15 If you are conservative use M5 Please contact me for more details of its use
Recuroid
Andriy Sydoruk
The Recuroid indicator shows very good entry points. Just look at the screenshots, then download the free version and look in the strategy tester and see for yourself. The system is based on two key algorithms. The first algorithm (managed) creates a system of balanced transition from the buy zone to the sell zone and vice versa, draws arrows and lines, and forms entries. The second algorithm (managing) corrects the initial data for the first algorithm (managed) by measuring virtual windows, t
Boom coins indicator and crash coins
Waleed Hamood Said Al Rawahi
YouTube上的指標直播。更多可信度請點擊下面的鏈接。還有指標的視頻可以觀看。注意直播晚了,不要依賴,只有對指標的回顧僅回顧指標的準確性,幾乎不輸,利潤率達到 95%。我將在 CRASH coin 1000 INDICES 上非常準確地工作 YouTube上的指標直播。更多可信度請點擊下面的鏈接。還有指標的視頻可以觀看。注意直播晚了,不要依賴,只有對指標的回顧僅回顧指標的準確性,幾乎不輸,利潤率達到 95%。我將在 CRASH coin 1000 INDICES 上非常準確地工作 YouTube上的指標直播。更多可信度請點擊下面的鏈接。還有指標的視頻可以觀看。注意直播晚了,不要依賴,只有對指標的回顧僅回顧指標的準確性,幾乎不輸,利潤率達到 95%。我將在 CRASH coin 1000 INDICES 上非常準確地工作
MMM Gold Sniper MT5
Gilang Wardhana Purnama Putra
Indicator is based on   Market Maker Strategy.   NO REPAINT. MM's are traders and their objective is to make money.  This includes strategies to trade against retails traders.  The major difference between them and other traders is that they have the ability, through access to massive volumes, to move price at their will.  So to make money, they aim to buy at a lower price and then sell at a higher price. They achieve this by:  1. Inducing traders to take positions. This is achieved by using a
Tatino Super Signals is Non Repaint Indicator for Binary Option trading and Forex trading. Recommendations: Timeframe: All timeframes. For best results we recommend using it on M1, M5 and M15 timeframes. Currency pairs: All Pairs Account type: All Type Broker time: Any Brokers : Alls Binary Trading : Expired 1 Candle Buffer Buy=1, Sell=0, Entry Next Candle Recommended Forex trading stop loss : 15 pips Recommended  Forex tradingTake profit levels : 15 pips Specifications: Does not repaint   Pa
Magicx
Hasan Abdulhussein
The indicator places a buy or sell signal when the conditions of the strategy it was designed with are met. The strategy is guaranteed, strong, and has been tested for 9 years. The indicator is for binary options and can be converted into a bot by linking it to MT2Trading, where it sends the signal to this platform. This platform automatically opens a trade on the trading platform you are using, whether it is Pocket Option, IQ Option, or any other binary options platforms. The entry is on the n
作者的更多信息
ARGUS Breakout Universal — Volatility Breakout EA for MT5 A fully automated breakout trading system built on one core principle: enter only when the market is truly moving, protect capital when it is not. No martingale. No grid. No averaging. How It Works The EA detects consolidation zones — periods where price compresses within a tight range. When price breaks out with volume confirmation, the EA enters in the breakout direction, filtered by a Daily SMA trend filter to avoid counter-trend trade
ORB Indices by ARGUS
Yevhen Hladchenko
The Opening Range Breakout Portfolio The Opening Range Breakout Portfolio A fully automated, intraday diversification system for US stock indices. > INSTITUTIONAL-GRADE LOGIC. SINGLE-CHART SIMPLICITY. Diversification over aggression Most automated systems rely on aggressive risk parameters applied to a single setup. The Opening Range Breakout Portfolio pursues a smoother equity curve through breadth. Target Trades the opening range of the US cash session. Scope Spans multiple index symbols and t
Argus Kijun Gold
Yevhen Hladchenko
KijunMaster EA 基準線 Expert Advisor for MetaTrader 5 Kijun Master Two classic Ichimoku plays, executed with machine discipline. KijunMaster buys the pullback when a trend rejects the Kijun-sen, and fades the spike when the line goes flat. Nothing else, ever. Hard stop on every trade Closed-bar signals, zero repaint No martingale No grid No averaging down The idea One line, two regimes, one EA that knows the difference Every Ichimoku trader on the planet watches the same line. The Kijun-sen is the
Tudas by Argus UP
Yevhen Hladchenko
The package consists of two MetaTrader 5 indicator files that are normally placed together on the chart: TudasInstantAnalysis.mq5   — the "top" indicator, drawn over price on the main chart. TudasDownCombined.mq5   — the "bottom" indicator, an independent subwindow below the chart. The logic has been calibrated, and continues to be calibrated, against real XAUUSD data. Part 1 — Top Indicator:   TudasInstantAnalysis.mq5 1.1 EMA Ribbon — moving-average ribbon Trend "by eye" on candles is easy t
Tudas by Argus DOWN
Yevhen Hladchenko
Part 2 — Bottom Indicator: TudasDownCombined.mq5 2.1 Money Flow Price is rising, but money is actually leaving the asset — you can't see this in the candles, and the move dies right after you enter, because there's no real buyer behind it. Money Flow shows the intensity of capital entering and leaving the asset, before this shows up in price, not after. The line is smoothed through a cascade of EMAs to strip out small-player noise and show the direction the big players are setting. Flow rising
筛选:
无评论
回复评论