Structure Break Forecaster
- Индикаторы
-
Antonello Belgrano
 MQL5 Programmer specialized in creating professional Expert Advisors and Indicators.
I develop high-quality strategies as well as custom solutions, optimizations, and personalized Expert Advisors tailored to your specific needs.
Feel free to contact me for any requests or custom projects. - Версия: 1.20
- Обновлено: 26 июля 2026
- Активации: 5
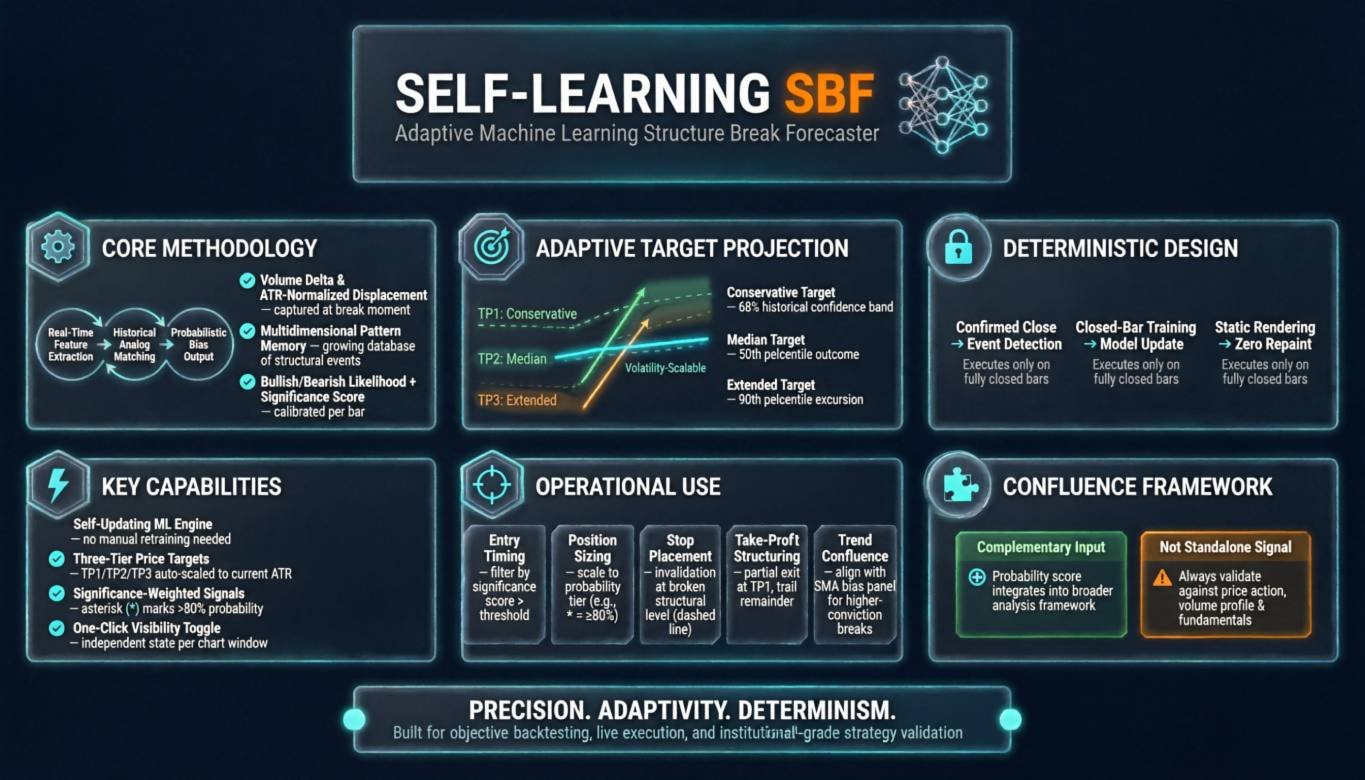
Every time the market breaks a key structural level, Self-Learning SBF asks a simple question: "What happened last time price did this?"
Instead of relying on fixed rules, the indicator keeps a live archive of every structure break it observes and how it played out — and it never stops learning. Every new signal is compared against the most similar cases in that archive, turning market history into a probability score and clear, tiered price targets, right when the market shifts.
What You Get
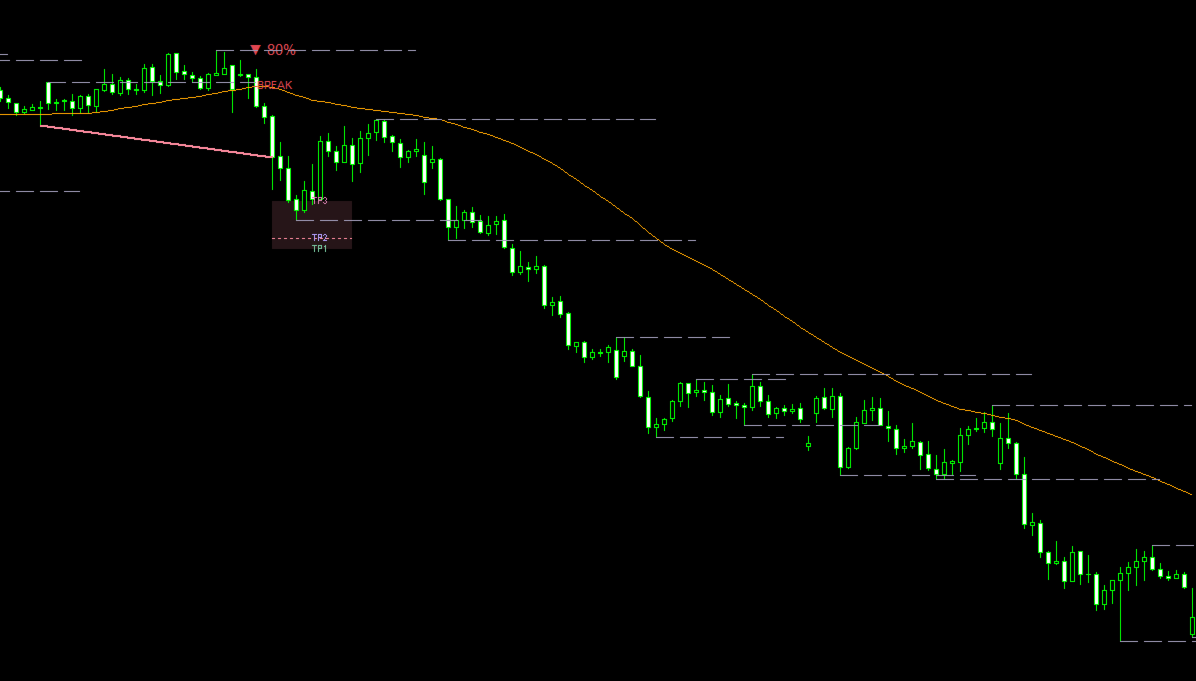
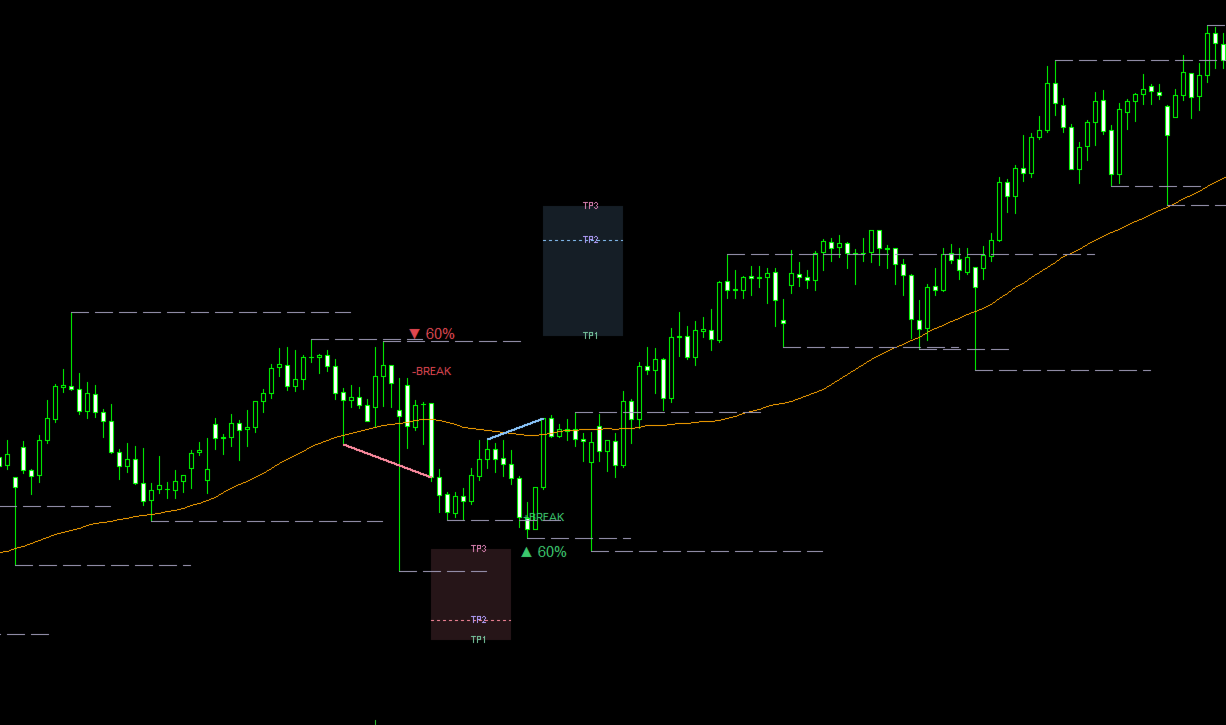
- Instant probability score on every structure break — know at a glance whether the setup has historically favored bulls or bears
- Three price targets (conservative, median, aggressive) automatically plotted after every signal
- Clean structure map: broken levels, connector lines, and target zones drawn directly on your chart
- Built-in 50-period SMA for quick trend context
- Live stats panel showing current bias, signal database size, and settings at a glance
- Custom alerts so you never miss a high-probability break
- No repainting — every signal is locked in the moment its bar closes, so what you see in backtest is what you would have seen live
Why It's Different
Most structure-break indicators treat every break the same way. Self-Learning SBF doesn't — it keeps score. The more the market moves, the bigger its archive grows, and the sharper its read becomes on which breaks tend to follow through and which don't.
Fully Customizable
Adjust the learning window, sensitivity, and number of historical matches to fit your trading style. Every color, line, and label is configurable to match your chart setup.
Best For
Traders who already read market structure and want a statistical edge layered on top — turning "the level broke" into "the level broke, and here's how similar breaks played out."
As with any technical tool, past historical performance does not guarantee future results. Use as part of a complete trading plan with proper risk management.