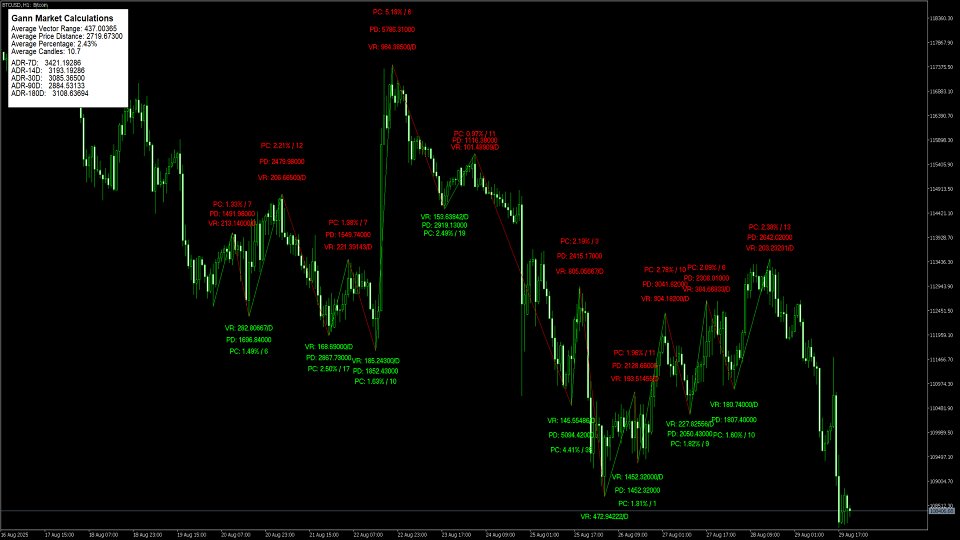
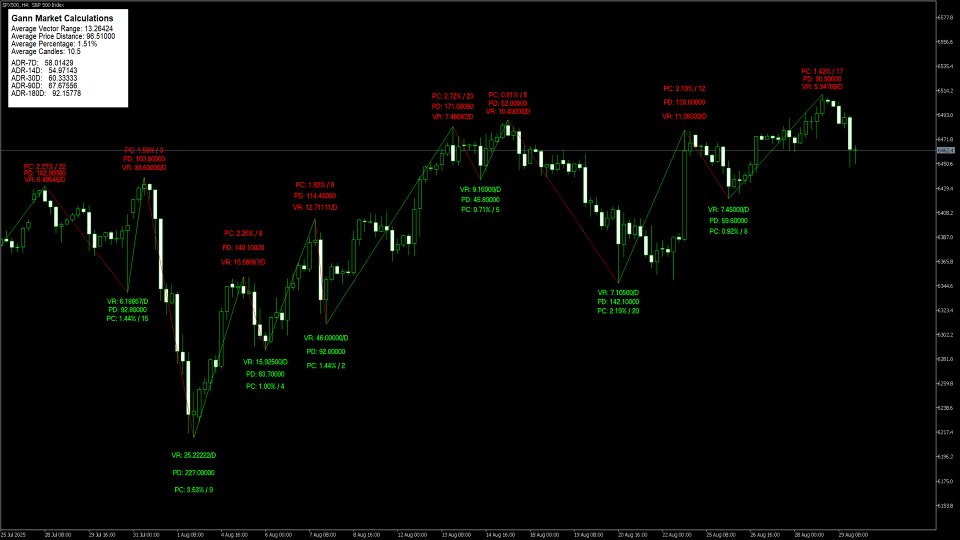
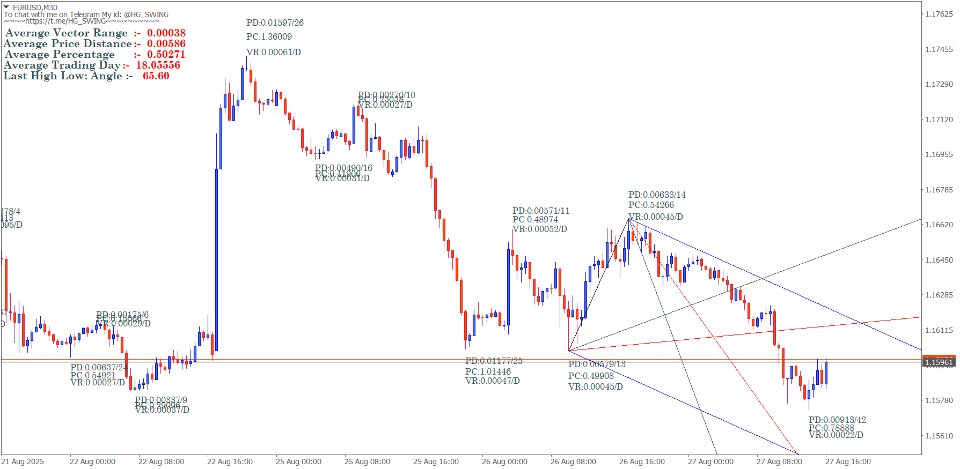
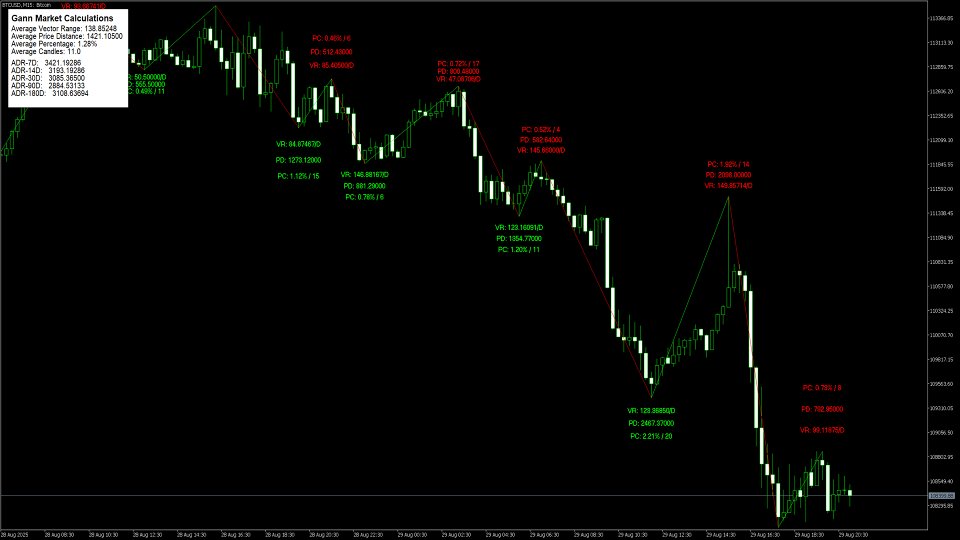
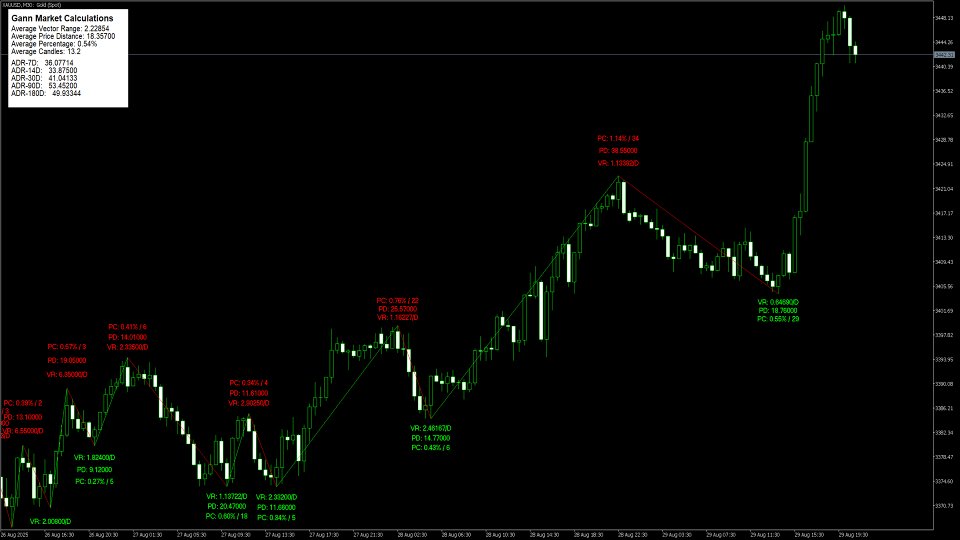
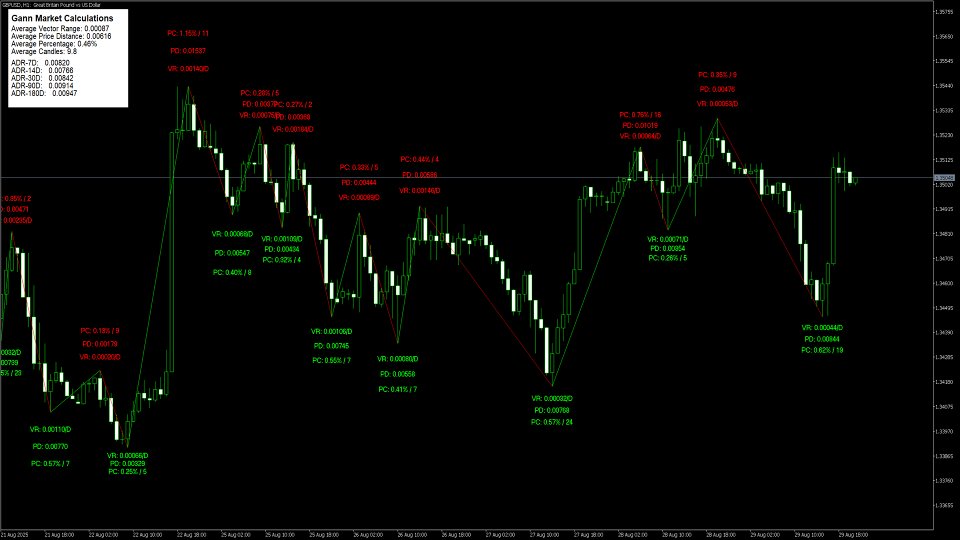
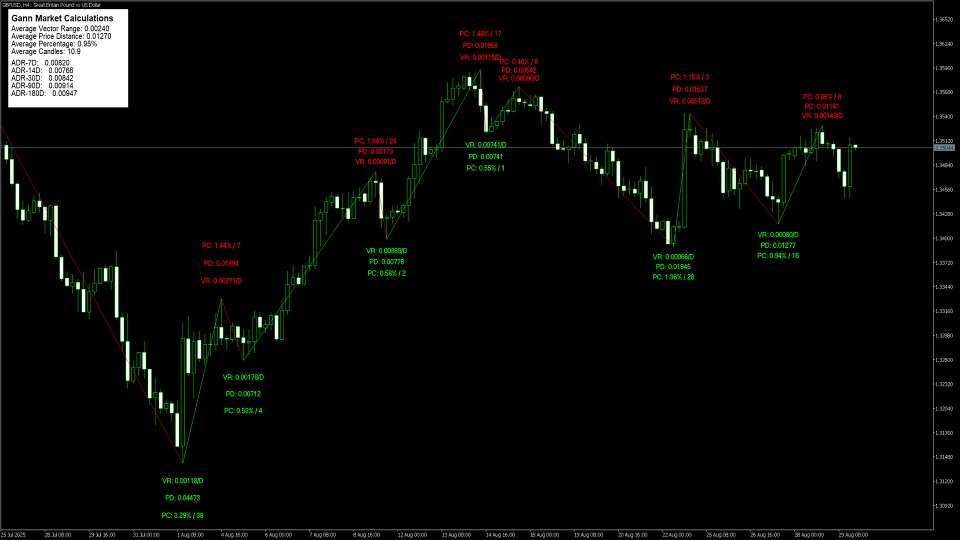
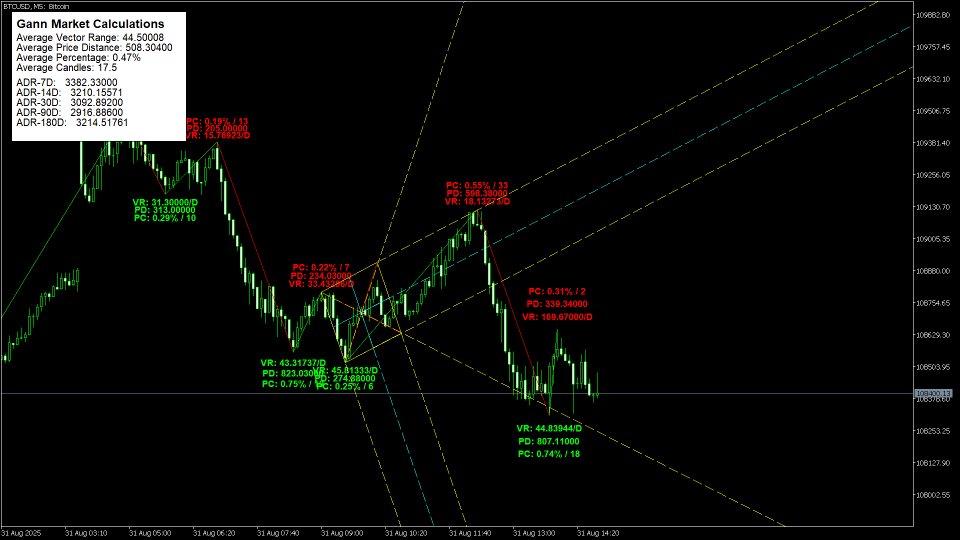
Gann Swing Calculations Methods

WD Gann Swing Trading & Market Calculation Mathematics: Decoding the Master's Geometric Approach to Market Prediction

Introduction

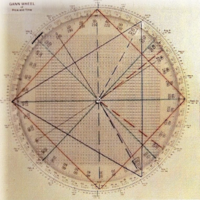
William Delbert Gann (1878-1955) stands as one of the most enigmatic and successful traders in financial history, developing a sophisticated mathematical framework that combined geometry, astronomy, and natural law to predict market movements. His theory was based upon natural geometric shapes and ancient mathematics. Gann theory states that the patterns and angles of an asset on the market can be used as a predictor for the price's future movements.

Central to Gann's methodology was his swing trading approach - a systematic method of identifying market turning points through mathematical calculations that removed market "noise" and revealed the underlying geometric structure of price movements.

The Foundation of Gann's Mathematical Framework

Core Philosophy and Market Vibration Theory

According to this theory, human behavior isn't random and creates predictable vibrations in the whole market. Gann traded financial markets based on the idea that collective human behavior forms a specific repeating pattern that unfolds through time.

Gann believed that markets moved according to natural law, with mathematical relationships governing every price movement. His approach was built on three fundamental pillars:

  1. Price Analysis - Mathematical relationships between price levels
  2. Time Analysis - Cyclical patterns and geometric time relationships
  3. Pattern Analysis - Geometric angles and natural proportions

The Square of Price and Time

He later formulated his theory into what is known as the squaring of price and time. This concept represents the cornerstone of Gann's mathematical approach, where price movements and time intervals follow proportional relationships based on square root progressions and geometric angles.

Gann Swing Chart Construction and Mathematics

Basic Swing Chart Methodology

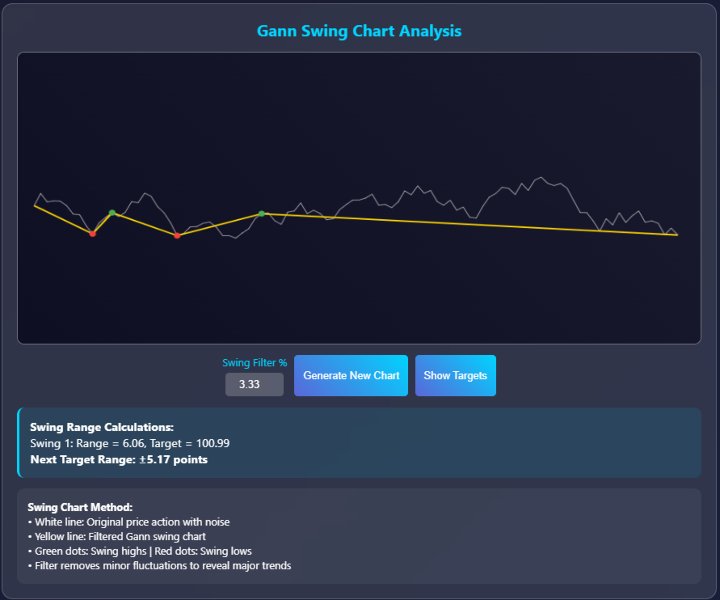
The Gann swing chart method systematically filters price action to identify significant market swings. The main goal of using Gann's charts is to remove the "noise" from regular price charts, revealing the underlying trend structure.

Mathematical Rules for Swing Identification

Upswing Requirements:

  • Price must exceed the previous swing high by a predetermined percentage or point value
  • The move must sustain above the breakout level for a specified time period
  • Volume confirmation often required for validation

Downswing Requirements:

  • Price must break below the previous swing low by the same mathematical criteria
  • Sustained breakdown below the violation level
  • Time-based confirmation of the new swing direction

Swing Calculation Formulas

Range Calculation Method

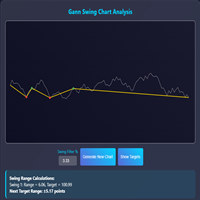
Swing objectives – add the range to move to the top of that move to find out the target for the next upmove or reverse in the bear market.

Formula:

Next Swing Target = Current Swing Extreme + Previous Swing Range

Where:

  • Current Swing Extreme = The high (uptrend) or low (downtrend) of the current move
  • Previous Swing Range = Absolute difference between the previous swing high and low

Percentage-Based Swing Filters

Gann employed specific percentage filters to define valid swings:

Small Swing Filter: 3-5% price movement Medium Swing Filter: 5-10% price movement
Major Swing Filter: 10%+ price movement

Square Root Progression in Swing Analysis

Gann discovered that significant price levels often aligned with square root relationships:

Square Root Calculation:

Next Resistance = √(Current Price²) + 1 Next Support = √(Current Price²) - 1

Square of numbers and 50% of the difference between those squares are significant support and resistance, but cannot be traded by themselves.

Advanced Mathematical Concepts

Gann Angles and Geometric Progression

Gann's angle system represents one of his most sophisticated mathematical contributions. These angles are derived from the relationship between price and time using specific geometric ratios:

Primary Gann Angles:

  • 1×1 (45-degree angle) - One unit of price per one unit of time
  • 1×2, 1×3, 1×4, 1×8 - Varying price-to-time relationships
  • 2×1, 3×1, 4×1, 8×1 - Inverse relationships

Mathematical Construction of Gann Angles

Angle Calculation = arctan(Price Movement / Time Movement)

For a 1×1 angle on a chart where 1 day = $1:

  • Slope = 1/1 = 1
  • Angle = arctan(1) = 45 degrees

The Square of Nine

This represents Gann's most complex mathematical tool, incorporating:

Spiral Mathematics: Numbers arranged in expanding squares with specific directional movements creating resistance and support calculations.

Cardinal Points: 0°, 90°, 180°, 270° positions within the square Cross Points: 45°, 135°, 225°, 315° intermediate positions

Time Cycle Calculations

WD Gann, a famous trader, believed that market movements were influenced by predictable time cycles.

Natural Time Periods:

  • Solar cycles (365 days)
  • Lunar cycles (29.53 days)
  • Seasonal cycles (90-day quarters)
  • Geometric progressions (7, 14, 21, 30, 45, 60, 90, 120, 180, 360 days)

Practical Application of Gann Swing Mathematics

Trend Confirmation Methods

To confirm a trend was in progress, he would look for lower highs and higher lows to form after a major reversal in trend.

Uptrend Confirmation:

  1. Price creates higher swing highs
  2. Price maintains higher swing lows
  3. Gann angles provide directional support

Downtrend Confirmation:

  1. Price creates lower swing highs
  2. Price maintains lower swing lows
  3. Gann angles provide directional resistance

Risk Management Through Mathematics

Gann's main trading philosophy was to trade with a close stop loss and select the most opportune trades in the direction of the main trend.

Mathematical Stop Loss Placement:

  • 3-5% below swing lows for long positions
  • 3-5% above swing highs for short positions
  • Gann angle violations as alternative stop levels

Swing Target Calculations

Primary Target Method:

Target = Entry Price ± (Previous Swing Range × 1.0)

Secondary Target Method:

Target = Entry Price ± (Previous Swing Range × 1.618)

Square Root Target Method:

Target = Next Perfect Square Root Level

Modern Implementation of Gann Mathematics

Digital Age Adaptations

Contemporary traders apply Gann's mathematical principles using:

Automated Swing Detection: Algorithms that identify swings based on percentage or point-based filters

Computer-Generated Gann Angles: Software that automatically plots angle lines based on mathematical relationships

Cycle Analysis Tools: Programs that identify time cycle confluences using Gann's natural time periods

Combining Traditional Mathematics with Modern Tools

Fibonacci Integration: Combining Gann levels with Fibonacci retracements for confluence analysis

Volume Profile Analysis: Using Gann price levels with volume-based support and resistance

Multi-Timeframe Analysis: Applying Gann swing principles across multiple time horizons

Critical Analysis and Limitations

Mathematical Precision vs. Market Reality

While Gann's mathematical approach provides structured market analysis, several considerations affect practical application:

Subjectivity in Swing Identification: Different traders may identify different swing points using identical criteria

Market Structure Changes: Modern electronic markets may not respond identically to mathematical relationships identified in Gann's era

Curve Fitting Risk: The complexity of Gann's methods can lead to retrospective optimization rather than predictive accuracy

Balancing Mathematical Rigor with Trading Psychology

Successful implementation requires understanding that mathematical precision must be balanced with:

  • Market sentiment analysis
  • Fundamental factor consideration
  • Risk management principles
  • Position sizing mathematics

Conclusion

WD Gann's swing trading and market calculation mathematics represent a sophisticated attempt to discover natural law within financial markets. W. D. Gann's legendary swing trading method has been unstoppable for the last 7 years. His geometric approach to market analysis, combining mathematical precision with natural cycles, continues to influence traders nearly a century after its development.

The enduring appeal of Gann's methods lies not just in their mathematical elegance, but in their systematic approach to market analysis that removes emotional decision-making from trading. While modern markets have evolved significantly since Gann's era, the underlying mathematical relationships he identified continue to provide valuable insights for contemporary traders willing to master their complexity.

Success with Gann's methods requires dedicated study of both the mathematical foundations and practical application techniques. The geometric precision of his approach demands disciplined implementation, but for those who master these calculations, Gann's swing trading methodology offers a unique perspective on market structure that transcends conventional technical analysis approaches.

Note: Trading based on any mathematical system involves significant risk. Historical performance of analytical methods does not guarantee future results. Proper risk management and thorough backtesting are essential before implementing any trading strategy based on Gann's mathematical principles.

link:- https://claude.ai/public/artifacts/4579f122-c256-455a-a251-a0c9f934cfd0


Рекомендуем также
Перейдите на   новый уровень   трейдинга с L ofi Trend v1 —   мощным индикатором полос   Боллинджера без   перерисовки для   максимальной яс ности и надеж ных сигналов. Lofi Trend v1 – Индикатор тренда с полосами Боллинджера без перерисовки Поднимите анализ графиков на новый уровень с Lofi Trend v1 — профессиональным трендовым индикатором без перерисовки для чистой входящей информации и реальных результатов. Работает на любом таймфрейме Скальпинг M1, внутридневная торговля на M15 или свинг на
Disclaimer : Keep in mind that seasonal patterns are not always reliable. Therefore, thoughtful risk management is crucial to minimize losses.  Seasonal patterns in the financial world are like a well-guarded secret that successful investors use to their advantage. These patterns are recurring price movements that occur during specific periods or around special events. Additionally, there are also intraday patterns that repeat. For example, Uncle Ted from Forex Family suggests examining previou
Functions Analyzes the current market trend Displays a numbering system based on trend structure (see below) Colors the chart background depending on trend direction Displays the ZigZag indicator Display Fibonacci Retracement with custom defined levels at the lates corrective trend movement Display Fibonacci Expansions with custom defined levels at the latest progressive trend movement Buffers for all relevant Trend parameters so EAs can access the trend information Background Information The
Novato
Juan Manuel Rojas Perez
5 (1)
Descubre el poderoso aliado que te guiará en el laberinto de los mercados financieros. Este indicador revolucionario te llevará de la incertidumbre a la claridad, permitiéndote identificar con precisión los puntos de inflexión del mercado. Mejora tus decisiones de entrada y salida, optimiza tus operaciones y ¡multiplica tus ganancias con confianza. ¡Para más información, te invitamos a unirte a nuestro canal de Telegram en https://t.me/Profit_Evolution  ¡Allí encontrarás contenido exclusivo, an
FREE
Novato alertas
Juan Manuel Rojas Perez
4.75 (4)
Descubre el poderoso aliado que te guiará en el laberinto de los mercados financieros. Este indicador revolucionario te llevará de la incertidumbre a la claridad, permitiéndote identificar con precisión los puntos de inflexión del mercado. Mejora tus decisiones de entrada y salida, optimiza tus operaciones y ¡multiplica tus ganancias con confianza. Ahora con alertas en tu pc o móvil ¡Para más información, te invitamos a unirte a nuestro canal de Telegram en   https://t.me/Profit_Evolution  ¡Al
FREE
Impulse fractals indicator - is counter-trend oriented complex market fractal pattern.  Market creates bull/bear impulse, trend starts, fractals on impulsed wave are an agressive pullback signals. Buy arrow is plotted when market is bearish and it's impulse showed up-side fractal, and sell arrow is plotted when market is bullish and it's impulse showed dn-side fractal. Main indicator's adjustable inputs : impulsePeriod - main period of impulse histogram  filterPeriod  - smoothes impulse accordi
Hunt markets with Hunttern ZigZag . Easy to use with one parameter    You can use it for the following:       -Classic patterns       -Heads and shoulders       -Harmonic patterns       -Elliott Wave       -Support and resistance       -Supply and Demand Single parameter:      -Period (1-120) Features:        -Candle time        -Single parameter        -Light mode template This is version 1 of Hunttern ZigZag. We are very happy to receive feedback from you.
FREE
Этот индикатор определяет краткосрочный и долгосрочный тренд. Анализ основан на выбраном таймфрейме. Индикатор показывает точки открытия сделок на продажу или покупку, а также указывает направление тренда на: Краткосрочном периоде Долгосрочном периоде Этот индикатор не только сигнализирует о немедленной покупке или продаже. Он указывает краткосрочный и долгосрочный тренд. Индикатор позволяет вам подробнее изучить реальный и исторический рыночный тренды!
Суть системы заключается в идентификации момента формирования "разворотной" композитной свечи с заданными характеристиками (размер свечи в пунктах, структура теней). В анализе японских свечей аналогами подобных разворотных моделей являются "Молот" (Hammer) и "Повешенный" (Hanging Man), но в данной системе тело свечи не обязательно должно быть маленьким, а результирующая свеча строится из нескольких свечей. Входные параметры системы: Range - задает максимальное количество баров, которые будут уча
FREE
MT5 Enveloping Pattern Detector: Your competitive advantage in trading Are you looking for a tool to help you accurately identify the best trading opportunities in the forex market? Our Engulfing Pattern Detector provides you with a highly reliable buy or sell signal, based on one of the most recognized and effective Japanese candlestick patterns: the engulfing pattern. With an average success rate of 70%, this indicator will allow you to make safer and more profitable investment decisions. Don'
FREE
Custom Indictor Signal Scanner for scan your own any custom indicator and template its one click you can open your desire signals(given time frame alert). Also can open same template with particular input indicator just type name of template your created with given indicator and enjoy all time frame scan with your logical signals  input string s2 = "====== Embedded Indicator Settings ======"; input UseEmbeddedIndicator = false; // Use embedded indicator instead of external file ( don't use its n
XFlow показывает расширяющийся ценовой канал помогающий определять тренд и моменты его разворота. Используется также при сопровождении сделок для установки тейк-профит/стоп-лосс и усреднений. Практически не имеет параметров и очень прост в использовании - просто укажите важный для вас момент истории и индикатор рассчитает ценовой канал. ОТОБРАЖАЕМЫЕ ЛИНИИ ROTATE - толстая сплошная линия. Центр общего вращения цены. Цена делает широкие циклические движения вокруг линии ROTATE. Положение цены окол
Anti Butterfly Harmonic Pattern Indicator MT5 The Anti Butterfly Harmonic Pattern Indicator on the MetaTrader 5 platform automatically detects harmonic pattern points X, A, B, C, and D directly on the chart. It analyzes price data and calculates Fibonacci ratios with high accuracy, enabling precise identification of potential reversal zones. «Indicator Installation & User Guide» MT5 Indicator Installation  | Anti Butterfly Harmonic Pattern Indicator MT4  | ALL Products By  TradingFinderLab  | Be
FREE
GdeAsset Position
Daniel De Almeida Galvao
Получите бесплатно! Моделирование для трейдеров, фондов управления капиталом и разработчиков MQL5 Получите алгоритм этого эксперта, зарегистрировавшись в Gdeasset Blackbox. Необходимый инструмент для настройки финансовой позиции только для покупок или защиты капитала только для продаж. Пример: чтобы защитить длинную позицию по биткоину, просто сохраните часть позиции с GdeAsset, настроенным только на продажу, тогда он будет накапливать прибыль во время падения биткоина и сохранит длинную позицию
FREE
Functional in the Forex market. Functional in the B3 market - Bolsa Brasil Balcão. Motivation The technical Fibonacci retraction indicator for many is essential and the basis for all market movement forecasts. The name of the tool comes from the Italian mathematician Leonardo de Pisa (13th century). This DEMO version will work in Meta Trader with Demo and Strategy Tester. To purchase the Full version that works on a Real account, click on: https://www.mql5.com/en/market/product/38089 Opera
FREE
Explosive Breakout Hunter  - это автоматизированный торговый советник (EA), направленный на максимизацию прибыли за счет ловли мощных пробоев. Уровень выигрыша составляет около 50%, а количество сделок ограничено несколькими входами в месяц. Однако этот советник делает ставку на качество, а не на количество. Он терпеливо ждет идеального момента, чтобы принести вам значительные выигрыши. Результаты бэктестов доступны в виде скриншотов, чтобы вы могли оценить потенциальную прибыль. Кроме того,
Duende MT5
Nestor Alejandro Chiariello
Привет Трейдеры! Представляю Стратегию "Дуэнде", Дуэнде — это алгоритм, который обнаруживает шаблоны различных высоких и низких уровней, где они остаются постоянными, чтобы делать хорошие входы, с системой восстановления, запрашивающей различные вещи, такие как безубыточность, и пересечения между одноранговыми узлами. Доказано, что он без проблем контролирует несколько валют, с мощным контролем новостей во время рынка. можно управлять всеми необходимыми символами Моя стратегия оптимизирована
If you love this indicator, please leave a positive rating and comment, it will be a source of motivation to help me create more products <3 How to use  Slope Direction Line Uptrend: When the SDL line slopes up and turns from red to green, it shows that the price is trending up. This is also considered a buy signal. Downtrend: When the SDL line slopes down and turns from green to red, it shows that the price is trending down. This is also considered a sell signal. Sideways: When the SDL line mo
FREE
Here we have the Start Midas Fibo Bands , I confess that it is an indicator that excited me enough to operate because I was able to find more defined rules. Well, the indicator has the functions of the other indicators of the Start line , which is a possibility to plot several Midas on the screen, you can move the anchor point using keyboard shortcuts and use the legend to differentiate one anchor from another. The rules that I have analyzed for my possible setup are recommended to the entry, st
VWAP Machine Learning Bands: Прогностическое Преимущество для Трейдеров Откройте для себя новый уровень рыночного анализа с VWAP Machine Learning Bands – инновационным индикатором для MQL5, разработанным для предоставления беспрецедентной информации о рыночных трендах, динамических зонах поддержки/сопротивления и высоковероятных торговых сигналах. Используя запатентованный адаптивный алгоритм машинного обучения, интегрированный с мощью средневзвешенной цены по объему (VWAP), этот индикатор выход
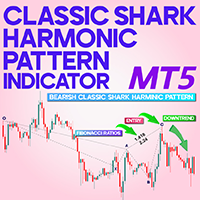
Classic Shark Harmonic Pattern Indicator for MetaTrader 5 The Classic Shark Harmonic Pattern Indicator utilizes specific Fibonacci ratios—such as 88.6%, 113%, and 161.8%—to detect potential price reversal zones. By recognizing the geometric configuration of the pattern, the indicator automatically draws the Shark pattern on the chart and highlights the Potential Reversal Zone (PRZ) when conditions are met. «Indicator Installation & User Guide» MT5 Indicator Installation  |  Classic Shark Harmon
FREE
La **Media Móvil de Tercera Generación (TGMMA)** es una versión avanzada del indicador estándar de **Media Móvil (MA)**. Fue descrita por primera vez por Manfred G. Dürschner en su artículo "Gleitende Durchschnitte 3.0" (en alemán). Aquí están las características clave de la TGMMA: 1. **Reducción del Retraso**:    - A diferencia de las MAs tradicionales, la TGMMA reduce significativamente el retraso. Se adapta más rápidamente a los cambios de precios, lo que la hace ideal para traders que busc
FREE
ZP Day Trading Indicator in MT5 The ZP Day Trading Indicator is one of the tools developed based on Price Action trading style concepts in MetaTrader 5. This indicator uses color-coded boxes to identify Trading Ranges on the chart. A trading range forms when the price moves within a specific range between a resistance level (ceiling) and a support level (floor) over a period of time. In such scenarios, buyers and sellers reach equilibrium within the defined range. «Indicator Installation & User
FREE
VFI Quantum
Nikita Berdnikov
5 (1)
Представляем VFI (Volume Flow Indicator) – индикатор для торговли, который анализирует соотношение объема и движения цены для выявления ключевых торговых возможностей. Индикатор отображает силу и направление потока объемов, предоставляя четкие сигналы о потенциальных точках входа и выхода. Сигналы формируются на основе пересечения нулевой линии, пересечения линии VFI и ее экспоненциальной скользящей средней (EMA), а также при выходе индикатора из зон перекупленности и перепроданности. Внимание!
FREE
PZ Penta O MT5
PZ TRADING SLU
3.5 (4)
The Penta-O is a 6-point retracement harmonacci pattern which usually precedes big market movements. Penta-O patterns can expand and repaint quite a bit. To make things easier this indicator implements a twist: it waits for a donchian breakout in the right direction before signaling the trade. The end result is an otherwise repainting indicator with a very reliable trading signal. The donchian breakout period is entered as an input. [ Installation Guide | Update Guide | Troubleshooting | FAQ | A
FREE
MT5 Hammer Pattern Detector: Your guide to more profitable operations Tired of searching for the best trading opportunities? Our innovative indicator gives you a competitive advantage by automatically identifying hammer patterns on your charts. Known for its high probability of success, the hammer pattern has been a fundamental tool in the arsenal of experienced traders for decades. Our indicator, designed to accurately detect this key pattern, will allow you to: Identify trend reversals earl
FREE
Super Trend Alert Indicator for MT5 is a powerful tool designed to help traders identify and follow market trends with precision. This indicator uses a proprietary algorithm to analyze price movements and provide clear trend signals, making it suitable for traders across all experience levels. You can find the MT4 version here Key features of the Super Trend Indicator include: Advanced trend analysis with real-time market scanning to detect potential trend directions. Real-time alerts that not
FREE
Simple QM Pattern   is a powerful and intuitive trading indicator designed to simplify the identification of the Quasimodo (QM) trading pattern. The QM pattern is widely recognized among traders for effectively signaling potential   reversals   by highlighting key market structures and price action formations. This indicator helps traders easily visualize the QM pattern directly on their charts, making it straightforward even for those who are new to pattern trading. Simple QM Pattern includes d
FREE
High Low Open Close
Alexandre Borela
4.98 (41)
Если вам нравится этот проект, оставьте 5-звездочный обзор. Данный показатель рисует открытые, высокие, низкие и закрывающие цены на указанные период и его можно отрегулировать для специфического часового пояса. Это важные уровни, которые выглядят многие институциональные и профессиональные трейдеры и могут быть полезны для вас, чтобы знать места, где они могут быть больше активный. Доступные периоды: Предыдущий день. Предыдущая неделя. Предыдущий месяц. Предыдущий квартал. Предыдущий год. Или
FREE
General Description In the simplest terms this is a contrarian intra-day scalping system. Built to try and let correct trades run as far as possible and flip the trade when indicated. The indicator looks at historical daily trading ranges to lay out levels at which it takes long and short positions based on the statistical levels. The indicator is built around index futures, mainly around S&P and the DOW but can be used an any futures contract mainly using AMP Futures to trade. The indicator is
С этим продуктом покупают
AriX
Temirlan Kdyrkhan
1 (2)
AriX Indicator for MT5 A powerful trend-following and signal-evaluation tool AriX is a custom MT5 indicator that combines Moving Averages and ATR-based risk/reward logic to generate clear buy/sell signals. It visualizes dynamic SL/TP levels, evaluates past trade outcomes, and displays win/loss statistics in a clean on-chart panel. Key features include: Buy/Sell signals based on MA crossovers ATR-based SL/TP1/TP2/TP3 levels with visual lines and labels Signal outcome tracking with real-time stat
ARIBot is a powerful trading companion designed to generate high-probability entry signals with dynamic TP/SL/DP levels based on volatility. Built-in performance tracking shows win/loss stats, PP1/PP2 hits, and success rates — all updated live. Key Features: Buy/Sell signals with adaptive volatility bands Real-time TP/SL/DP levels based on ATR Built-in MA Filter with optional ATR/StdDev volatility Performance stats panel (Success, Profit/Loss, PP1/PP2) Alerts via popup, sound, push, or email Cus
Данный индикатор находит и отрисовывает зоны , так сказать места силы, где цена будет разворачиваться. Индикатор может работать на любом графике, любом инструменте, любом таймфрейме. Индикатор имеет два режима. Индикатор оснащен панелью управления с кнопками для удобства и разбит на два режима. Ручной и авто. Ручной режим: Для работы с ручным режимом необходимо нажать кнопку NEW, появится отрезок. Данный отрезок натягиваете на движение и нажимаете кнопку LVL. Отрисовывается уровень. Авто режим:
Получите БЕСПЛАТНЫЙ индикатор AUX, поддержку EA и полное руководство, посетив – https://www.mql5.com/en/blogs/post/763955 Определи тренд. Прочти паттерн. Выбери момент входа. 3 шага менее чем за 30 секунд! Торгуйте легко — никакого анализа не требуется. Ваш умный помощник готов упростить ваш рабочий процесс Больше никакой перегрузки графиков. Торгуйте уверенно с помощью интеллектуального определения направления. Совместим со всеми валютами, криптовалютами, акциями, металлами, индексами и любыми
VTrende Pro
Andrii Diachenko
5 (1)
VTrende Pro - МТФ индикатор для трендовой торговли с панелью индикации для МТ5 !!! - Подробное описание на русском языке под видео (на Youtube) - !!! Хотя сигналы индикатора VTrende Pro можно использовать, как сигналы полноценной торговой системы, рекомендуется применять их в связке с ТС Билла Вильямса. VTrende Pro - это расширенная версия индикатора VTrende . Отличие Pro версии от VTrende: - Временные зоны - Сигнал V - сигнал 1-2 волн Основная задача индикатора - определить точки изменения н
SupportResistancePeaks Indicator indicator - is the combination of dynamic support/resitance and price action pattern. As a rule support/resistance indicators uses already calculated, history levels. The most disadvantage of this method - new(incomming) levels always are not the same as were on history, in other words accuracy is not so high as expected. My indicator is looking for dynamic/live levels that are forming right now after trend lost it's power and choppy market starts. As a rule exac
Enigmera MT5
Ivan Stefanov
3.67 (3)
ENIGMERA: Сердце рынка Введение Этот индикатор и торговая система представляют собой выдающийся подход к финансовым рынкам. ENIGMERA использует фрактальные циклы для точного расчёта уровней поддержки и сопротивления. Он показывает подлинную фазу накопления и задаёт направление и цели — система работает как в тренде, так и в коррекции. Как это работает Большая часть функционала индикатора управляется кнопками на левой панели графика, что позволяет мгновенно реагировать на разные рыночные условия.
Weis Wave with Alert MT5
Trade The Volume Waves Single Member P.C.
4.94 (16)
Rental/Lifetime Package Options and Privileges  Rent Monthly Six Months   Yearly/Lifetime Weis Wave with Speed with Alert+Speed Index x x x Manual  x x x Quick Set up Video x x x Blog x x x Lifetime Updates x x x Setup and Training Material x x Discord Access Channel "The SI traders"          x Rectangle Break Alert Tool      x How to trade with it:    http://www.tradethevolumewaves.com   ** If you purchase please contact me to setup your  : Training Room and  complete manual access.  Wei
Индикатор выделяет зоны, в которых проявляется интерес, а затем показывает зону накопления ордеров. Он работает как биржевой стакан, но в крупном масштабе. Это индикатор для самых крупных денег. Его эффективность исключительна. Какой бы интерес ни возник на рынке — вы его увидите. (Это полностью переписанная и автоматизированная версия — ручной анализ больше не требуется.) Скорость транзакций — это концептуально новый индикатор, который показывает, где и когда накапливаются крупные ордера и как
Tragos
David Chokumanyara
TRAGOS Indicator – The GOAT of All Trading Indicators TRAGOS (Greek for “male goat”) isn’t just a name — it’s the GOAT: Greatest of All Time in trading indicators. Designed for Forex, Indices, Gold, Crypto, and Deriv Synthetic Indices (Boom & Crash, Volatility 75, Step, Jump, etc.), it gives you non-repainting buy, sell, and exit signals with unmatched clarity. Why TRAGOS? Non-Repainting Signals – 100% reliable. Audible, Email & Push Alerts – Never miss a trade. Trend Following – Rid
A tool for on-chart strategy backtesting and performance analysis. A utility for developing, debugging, and testing custom trading ideas and indicator functions. An indicator designed to quickly test trading concepts and visualize the effectiveness of different input parameters. An all-in-one sandbox for testing everything from simple crossovers to complex, multi-condition trading systems.
Индикатор " Dynamic Scalper System MT5 " разработан для скальпингового метода торговли внутри трендовых волн. Тестировался на основных валютных парах и золоте, возможна совместимость с другими торговыми инструментами. Дает сигналы для кратковременного открытия позиций по тренду с дополнительным сопровождением движения цены. Принцип действия индикатора. Большие стрелки определяют направление тренда. Внутри трендовых волн действует алгоритм генерации сигналов для скальпинга в виде маленьких ст
The Second-Level Tick Candlestick Generator is a professional-grade MT5 indicator tool specifically designed for high-frequency trading and short-term scalping. It can convert raw tick data into highly customizable second-level candlestick charts in real-time, helping traders accurately capture micro-market fluctuations and optimize entry and exit timing. This tool provides clear chart displays, allowing you to more intuitively identify price action patterns and improve trading decision efficien
NOTE: CYCLEMAESTRO is distributed only on this website, there are no other distributors. Demo version is for reference only and is not supported. Full versione is perfectly functional and it is supported. CYCLEMAESTRO , the first and only indicator of Cyclic Analysis, useful for giving signals of TRADING, BUY, SELL, STOP LOSS, ADDING. Created on the logic of   Serghei Istrati   and programmed by   Stefano Frisetti ;   CYCLEMAESTRO   is not an indicator like the others, the challenge was to inter
Данный индикатор основан на математике великого трейдера W.D.Ganna.  С помощью его мы с легкостью найдете сильные уровни анализируя свинг для поиска оптимальной точки входа. Индикатор работает на всех инструментах и всех тайм фреймах. Индикатор полностью ручной и оснащен кнопками управления. Все что вам нужно это нажать на кнопку NEW, появится отрезок, данный отрезок вы размещаете на любое движение, свинг или даже 1 свечу, которую хотите проанализировать. Разместив отрезок нажимаете кнопку ОК. П
Данный индикатор предназначен для работы на любом ТФ. Программа на основе авторских алгоритмов и математике W.D.Ganna позволяет рассчитать целевые уровни движения цены по трем точкам с высочайшей степенью достоверности. Является прекрасным инструментом для биржевой торговли. Индикатор оснащен тремя кнопками NEW - вызвать треугольник для расчета. DEL - удалить выбранный треугольник. DELS - полностью удалить все построения. Вероятность достижения целей более 80%. Так же индикатор оснащен сигналом
SYSTEM INTRODUCTION:   The Binary Options Momentum System Is Specifically Designed For Binary Options Trading. Unlike Other Systems And Indicators That Were Adopted From Other Trading Environments For Binary Options. Little Wonder Why Many Of Such Systems Fail To Make Money . Many End Up Loosing Money For Their Users.  A Very Important Fact That Must Be Noted Is The Fact That Application Of Martingale Is not Required. Thus Making It Safer For Traders Usage And Profitability. A Trader Can Use Fi
Финансовый Индикатор SolarTrade Suite: Mercury Market Indicator - Ваш Надежный Проводник в Мире Финансовых Рынков! В нашу компьютерную программу для форекса встроен мощный искусственный интеллект, который анализирует рыночные данные в реальном времени. Он точно прогнозирует изменения цен, помогая принимать обоснованные торговые решения. Благодаря продвинутым алгоритмам, наш индикатор оптимизирует стратегии и минимизирует риски для трейдеров. Это скользящая средняя, которая использует особые инн
Core Concept: Naveen Saroha's Advanced time and price angles are drawn from significant highs or lows at specific geometric ratios that represent the relationship between price movement and time. The Main Gann Angles and Percentage together Most Important: 1x1 Angle : One units of price for one unit of time  1x2 Angle : One unit of price for two units of time  1x3 Angle 1x4 Angle 1x5 Angle 1x6 Angle 1x7 Angle 1x8 Angle: (45) : Eight unit of price for one unit of time - considered the most i
note: this indicator is for METATRADER4, if you want the version for METATRADER5 this is the link:  https://www.mql5.com/it/market/product/108106 TRENDMAESTRO ver 2.4 TRENDMAESTRO recognizes a new TREND in the bud, he never makes mistakes. The certainty of identifying a new TREND is priceless. DESCRIPTION TRENDMAESTRO identifies a new TREND in the bud, this indicator examines the volatility, volumes and momentum to identify the moment in which there is an explosion of one or more of these data a
Multi Currency Multi Time Market Scan Signals Multi Currency Multi Time Market Scan Signals (MT5 Dashboard) Unlock Smarter Trading with Real-Time Market Insights Across Multiple Currencies & Timeframes! The Multi Currency Multi Time Market Scan Signals dashboard is your all-in-one solution for MetaTrader 5 , designed to simplify complex market analysis and pinpoint high-probability trading opportunities. Say goodbye to manual chart hopping – this powerful tool scans multiple symbols and timef
Jeslyn MT5
Justine Kelechi Ekweh
Это многоцелевая система, которая подходит как ручным трейдерам Форекс, так и скальперской системе или стратеги и для получения очень сильного импульса, трей дерам бинарных опционов или для использования универсальными советниками в авт о матической торговле. Это многоцелевая система, которая подходит как ручным трейдерам Форекс, так и скальперской системе или стратеги и для получения очень сильного импульса, трей дерам бинарных опционов или для использования универсальными советниками в авто ма
Viking Strategy Indicator – Бьющееся сердце системы BT 3.0 Viking Strategy Indicator — это не просто индикатор… Это одна из ключевых составляющих революционной торговой системы BT 3.0 , созданной для трансформации опыта трейдера любого уровня — от новичка до профессионала . BT 3.0 — это не просто инструмент: Это полноценное торговое решение , работающее в полуавтоматическом и автоматическом режимах , объединяющее 6 мощных индикаторов и интеллектуального помощника , который анализирует, вы

IVISTscalp5
Vadym Zhukovskyi
5 (6)
Что нового в индикаторе прогнозов iVISTscalp5 (Версия 10)? iVISTscalp5 – это авторская система прогнозов для любого финансового инструмента на неделю вперед (для быстрого скальпинга по уровням времени). iVISTscalp5 – инструмент для простого изучения и понимания финансового рынка. 1)     Индикатор прогнозов iVISTscalp5 полностью переписан на другой язык программирования ( C ++), что ускорило загрузку и обработку данных. Разное графическое отображение прогнозов на графике будет еще проще для п
Channel Trend Bands – A Comprehensive Indicator for Market Analysis MetaTrader 4 Version Simple to Use, Effective in Application User-Friendly and Suitable for All Traders This indicator stands out due to its straightforward functionality. Whether you're a beginner exploring the market or an experienced trader refining your strategy, this tool offers valuable insights. Using a   Triangular Moving Average (TMA)   with additional   ATR-based bands , it provides structured market data to support w
Reversal ALGO
Muhammad Abdullah Bhatti
Reversal Algo – Технический индикатор для анализа разворотов рынка Обзор Reversal Algo — это сложный технический индикатор, разработанный для того, чтобы помочь трейдерам определить потенциальные поворотные точки в рыночных трендах. Путём тщательного анализа исторических данных о ценах, он обнаруживает значительные максимумы и минимумы, которые могут сигнализировать о предстоящем изменении рыночного импульса. Этот индикатор предоставляет чёткие и ярко выраженные визуальные сигналы на ваших графи
Индикатор Bollinger Bands для Нескольких Таймфреймов Улучшите свой торговый анализ с нашим индикатором Bollinger Bands для MQL5! Этот мощный инструмент позволяет вам одновременно отображать Bollinger Bands на пяти различных таймфреймах, используя при этом одинаковый период . Получите более четкое представление о волатильности рынка и потенциальных разворотах тренда с первого взгляда. Упростите свой анализ на нескольких таймфреймах и принимайте более обоснованные торговые решения.
Индикатор предназначен для того, чтобы вовремя закрывать позиции по рынку. Например: досрочно фиксировать прибыль, если цена не достигла TakeProfit, а рынок разворачивается. Индикатор анализирует импульс, а не тренд. О тренде никакой информации он не дает. Индикатор хорошо подходит для поиска дивергенции. Индикатор Ershov 38 Parrots динамически подстраивается под рынок и выявляет импульсы движения цены средней и высокой амплитуды. На мелкие скачки цены почти не реагирует.  Принципиальное отличи
Trend Compass: All-in-One Trend Tracking The Trend Compass indicator is a sophisticated yet user-friendly trading tool designed for both novice and experienced traders. By combining multiple technical analysis approaches into one comprehensive package, it eliminates the need for multiple indicators cluttering your charts. Key Features: Multiple analysis modes including VSA for effort/result evaluation Dynamic trailing stops using fractal levels Seven color visualization options for clear market
XCalper TFO
Aecio de Feo Flora Neto
Данный осциллятор разработан xCalper в 2015 году и основан на расчете скользящих средних для обозначения и прогнозирования уровней перекупленности/перепроданности. Быстрая линия (по умолчанию белая) колеблется в основном в пределах -0.5 (перепроданность) и +0.5 (перекупленность). Пересечение линией уровня -0.5 вверх формирует уровень перепроданности. Пересечение уровня +0.5 вниз формирует уровень перекупленности. Пересечение быстрой линией значения 0.0 и возврате к предыдущему значению указывает
Другие продукты этого автора
Custom Indictor Signal Scanner for scan your own any custom indicator and template its one click you can open your desire signals(given time frame alert). Also can open same template with particular input indicator just type name of template your created with given indicator and enjoy all time frame scan with your logical signals  input string s2 = "====== Embedded Indicator Settings ======"; input UseEmbeddedIndicator = false; // Use embedded indicator instead of external file ( don't use its n
Core Principles Swing Angle Measurement   Swing angles are calculated by measuring the degree of price movement between swing highs and lows over time. Steeper angles (typically 45+ degrees) indicate stronger momentum and potentially more profitable trading opportunities. Traders use various timeframes to identify these patterns, from intraday charts to weekly swings. Momentum Confirmation   High degree swing angles often coincide with strong momentum indicators like RSI breakouts, volume spikes
Core Concept: Naveen Saroha's Advanced time and price angles are drawn from significant highs or lows at specific geometric ratios that represent the relationship between price movement and time. The Main Gann Angles and Percentage together Most Important: 1x1 Angle : One units of price for one unit of time  1x2 Angle : One unit of price for two units of time  1x3 Angle 1x4 Angle 1x5 Angle 1x6 Angle 1x7 Angle 1x8 Angle: (45) : Eight unit of price for one unit of time - considered the most i
Market predictive price levels are key technical analysis tools is my finest invention through mathematics to predict automatically next price is where to reach after break any levels. A unique name quality it automatically calculate price range its my own invention according price value to predict what's is next price came than after it not fixed levels like Fibonacci or pivots Its Naveen's Predictive Levels .used to forecast where an asset's price might find support (stop falling) or resistanc
Core Principles Swing Angle Measurement   Swing angles are calculated by measuring the degree of price movement between swing highs and lows over time. Steeper angles (typically 45+ degrees) indicate stronger momentum and potentially more profitable trading opportunities. Traders use various timeframes to identify these patterns, from intraday charts to weekly swings. Momentum Confirmation   High degree swing angles often coincide with strong momentum indicators like RSI breakouts, volume spikes
Its and Circle drawer for mt4 auto scale can use multiple circles together watch my all videos based on circle get idea how to use and find out reversals of markets. Its my core concept for predict time and price levels using only Circles no other indicator needed to use with circles a complete trading strategy. https://youtu.be/VlSIur-LPUs?si=gDtioQyUtXDDw_fi https://youtu.be/-IGp7F9XINQ?si=Q2DB0qKHKQzpl4bv NOTE :- ECLIPS CENTER POINT TO PLACE HIGH LOW 
FREE
Its and Circle drawer for mt4 auto scale can use multiple circles together watch my all videos based on circle get idea how to use and find out reversals of markets. Its my core concept for predict time and price levels using only Circles no other indicator needed to use with circles a complete trading strategy. https://youtu.be/VlSIur-LPUs?si=gDtioQyUtXDDw_fi https://youtu.be/-IGp7F9XINQ?si=Q2DB0qKHKQzpl4bv
FREE
The Naveen Dynamic Square is one of the best known  technical analysis tools  inspired  by WD Gann along with the Gann Fan and Gann Box. It is considered a cornerstone of his trading technique that is based on time and price symmetry. The Naveen Dynamic Square is a powerful tool in finance for determining support and resistance levels based on a stock's extreme price points. It works by extrapolating probable price levels from a central value, typically an all-time or cyclical high or low. This
Core Concept: Naveen Saroha's Advanced time and price angles are drawn from significant highs or lows at specific geometric ratios that represent the relationship between price movement and time. The Main Gann Angles: Most Important: 1x1 Angle : One units of price for one unit of time  1x2 Angle : One unit of price for two units of time  1x3 Angle 1x4 Angle 1x5 Angle 1x6 Angle 1x7 Angle 1x8 Angle: (45) : Eight unit of price for one unit of time - considered the most important trend line Co
Advance Gann Grid and Percentage tool is world's first auto scale dynamic grid  created by Naveen Saroha will new unknown features Key Features of Modern Dynamic Gann Grid Real-time Updates : Unlike traditional static grids, dynamic versions automatically adjust as new price data comes in Multiple Timeframe Analysis : Simultaneous calculation across different timeframes Automated Scaling : Software automatically determines optimal price-to-time ratios Interactive Elements : indicator is create 1
High Gravity Reversal signals made by Naveen Saroha a completely new concept using physics universal law of speed and Gravity. Made a simple signals using complex mathematics to match trading concepts. High accurate sell signals and buy potential of reversal of market one of unique invented by core universal laws. We are working on gravity signals since 2019 consistently...high probability reversals with minimal stop losses. 100% Non repainted no legging tools for mt4/mt5 also can use in binary
Gann time and price reversal signals are sophisticated trading concepts developed by Naveen Saroha using  W.D. Gann concepts that focus on predicting market turning points through the confluence of time cycles and price movements. Here are the key elements: Time-Price Balance : Gann famously stated, "When time is up, the market will reverse regardless of the price. This emphasizes that time cycles often take precedence over price levels in determining market reversals. Key Reversal Signals Price
Gann Time Reversal Signals   are sophisticated trading concepts developed by Naveen Saroha using  W.D. Gann concepts that focus on predicting market turning points through the confluence of time cycles and price movements. Here are the key elements: Time-Balance : Gann famously stated, "When time is up, the market will reverse regardless of the price. This emphasizes that time cycles often take precedence over price levels in determining market reversals. Key Reversal Signals Price-Time Confluen
New idea for market turning forecasts and Swing High degree angle by Geometric and Gann methods. Developed by Naveen Saroha in 2019. to find time and angular forecaster for market direction to reversal/swing. Tool shows time vertical line on chart. Using geometric and mathematical equation to define next turning probability of market  Market swing turning points Technical analysis forecasting Trend reversal predictions
Dynamic Andrew's Pitchfork A technical analysis tool that uses three parallel trendlines to identify potential support and resistance levels. Created by selecting three significant pivot points (two lows and one high, or two highs and one low), then drawing: Median Line : The central line connecting the first point to the midpoint between the second and third points Upper Parallel : A line parallel to the median line, passing through the highest of the second two points Lower Parallel : A line p
Mac-Binary option Signals is unique mathematical concept to trade iqoptions,binary,rocketoptions specter or any other binary options company 1 min 5 expiry run robot 30min everyday and fill profit and loss ratios inside mt2iq/mt2binary and run or 1min to 5min expiry ...go to setting in mt2iq robot allow otc and digital options. and select risk 500and profit 300$ per day it can stop automatically after profit or loss... If it can close after loss restart and Reset profit and loss button run again
What is a Dynamic Gann Box? The Dynamic Gann Box, Designed by Mr Naveen Saroha its and  World first in class. World's First auto scale  mt4/mt5 Geometric tools... no matter screen sizes and resolutions its automatically check chart scale with different time and different trading assets like commodities and stocks futures and options.... also known as the Gann Square, is a more complex tool that combines price and time in a squared framework based on W.D. Gann's belief that market movements are
The Naveen Dynamic Square  MT4 Lite. is one of the best known  technical analysis tools  inspired  by WD Gann along with the Gann Fan and Gann Box. It is considered a cornerstone of his trading technique that is based on time and price symmetry. The Naveen Dynamic Square MT5   is a powerful tool in finance for determining support and resistance levels based on a stock's extreme price points. It works by extrapolating probable price levels from a central value, typically an all-time or cyclical h
High low Reversal concept by Naveen saroha to find out new tops and new bottoms through mathematical calculations also can get with own calculation inputs available to increase or decrease swing potential,also can use  auto analysis function to calculate  Parameters swing heights and swing percentages. Indicator can apply all time frame and all types of market symbols..... """High-Low Market Signals Overview High-low market signals are technical indicators that analyze the relationship between r
Custom Indictor Signal Scanner for scan your own any custom indicator and template its one click you can open your desire signals(given time frame alert). Also can open same template with particular input indicator just type name of template your created with given indicator and enjoy all time frame scan with your logical signals  What is a Custom Indicator Scanner for MT4? A custom indicator scanner is an Indicator  or script that automatically scans multiple currency pairs and timeframes for
A day high low scanner is a stock screening tool that helps traders and investors identify stocks based on their daily price movements, specifically focusing on stocks that are hitting new highs or lows within a trading day. Here's how it typically works: Day High Scanner: Identifies stocks that are trading at or near their highest price of the current trading day Shows stocks with strong upward momentum Helps traders spot potential breakout opportunities or stocks with bullish sentiment Day Low
Core Concept: Naveen Saroha's Advanced time and price angles included percentages to find out right time and price equations   are drawn from significant highs or lows at specific geometric ratios that represent the relationship between price movement and time. The Main Gann Angles and Percentage together Most Important: 1x1 Angle : One units of price for one unit of time  1x2 Angle : One unit of price for two units of time  1x3 Angle 1x4 Angle 1x5 Angle 1x6 Angle 1x7 Angle 1x8 Angle: (45)
Multipair Range Percentage Levels Scanner - Technical Description Overview A Fibonacci levels scanner is a technical analysis tool that automatically identifies and plots key Fibonacci retracement and extension levels across multiple financial instruments or timeframes. It helps traders quickly locate potential support and resistance zones based on mathematical relationships derived from the Fibonacci sequence. Core Functionality Automatic Level Detection The scanner identifies significant pric
WD Gann Swing Trading & Market Calculation Mathematics: Decoding the Master's Geometric Approach to Market Prediction Introduction William Delbert Gann (1878-1955) stands as one of the most enigmatic and successful traders in financial history, developing a sophisticated mathematical framework that combined geometry, astronomy, and natural law to predict market movements. His theory was based upon natural geometric shapes and ancient mathematics. Gann theory states that the patterns and angles o
The Naveen Dynamic Square  MT5  is one of the best known  technical analysis tools  inspired  by WD Gann along with the Gann Fan and Gann Box. It is considered a cornerstone of his trading technique that is based on time and price symmetry. The Naveen Dynamic Square MT5   is a powerful tool in finance for determining support and resistance levels based on a stock's extreme price points. It works by extrapolating probable price levels from a central value, typically an all-time or cyclical high o
Advance Gann Grid and Percentage tool is world's first auto scale dynamic grid  created by Naveen Saroha will new unknown features Key Features of Modern Dynamic Gann Grid Real-time Updates : Unlike traditional static grids, dynamic versions automatically adjust as new price data comes in Multiple Timeframe Analysis : Simultaneous calculation across different timeframes Automated Scaling : Software automatically determines optimal price-to-time ratios Interactive Elements : indicator is create 1
High Gravity Reversal signals made by Naveen Saroha a completely new concept using physics universal law of speed and Gravity. Made a simple signals using complex mathematics to match trading concepts. High accurate sell signals and buy potential of reversal of market one of unique invented by core universal laws. We are working on gravity signals since 2019 consistently...high probability reversals with minimal stop losses. 100% Non repainted no legging tools for mt4/mt5 also can use in binary
New idea for market turning forecasts and Swing High degree angle by Geometric and Gann methods. Developed by Naveen Saroha in 2019. to find time and angular forecaster for market direction to reversal/swing. Tool shows time vertical line on chart. Using geometric and mathematical equation to define next turning probability of market  Market swing turning points Technical analysis forecasting Trend reversal predictions
Equilateral triangle trading strategy , which is a technical analysis pattern used in financial markets. To finding reversal of market see my analysis vides based on tringles only a complete tool for trading. An equilateral triangle is a triangle that has three equal sides. It is a special case of an   isosceles triangle   in the modern definition, stating that an isosceles triangle is defined at least as having two equal sides. [ 1 ]   Based on the modern definition, this leads to an equilatera
Mac-Binary option Signals is unique mathematical concept to trade iqoptions,binary,rocketoptions specter or any other binary options company 1 min 5 expiry run robot 30min everyday and fill profit and loss ratios inside mt2iq/mt2binary and run or 1min to 5min expiry ...go to setting in mt2iq robot allow otc and digital options. and select risk 500and profit 300$ per day it can stop automatically after profit or loss... If it can close after loss restart and Reset profit and loss button run again
Фильтр:
Нет отзывов
Ответ на отзыв