Gann Swing Calculations Methods

WD Gann Swing Trading & Market Calculation Mathematics: Decoding the Master's Geometric Approach to Market Prediction

Introduction

William Delbert Gann (1878-1955) stands as one of the most enigmatic and successful traders in financial history, developing a sophisticated mathematical framework that combined geometry, astronomy, and natural law to predict market movements. His theory was based upon natural geometric shapes and ancient mathematics. Gann theory states that the patterns and angles of an asset on the market can be used as a predictor for the price's future movements.

Central to Gann's methodology was his swing trading approach - a systematic method of identifying market turning points through mathematical calculations that removed market "noise" and revealed the underlying geometric structure of price movements.

The Foundation of Gann's Mathematical Framework

Core Philosophy and Market Vibration Theory

According to this theory, human behavior isn't random and creates predictable vibrations in the whole market. Gann traded financial markets based on the idea that collective human behavior forms a specific repeating pattern that unfolds through time.

Gann believed that markets moved according to natural law, with mathematical relationships governing every price movement. His approach was built on three fundamental pillars:

  1. Price Analysis - Mathematical relationships between price levels
  2. Time Analysis - Cyclical patterns and geometric time relationships
  3. Pattern Analysis - Geometric angles and natural proportions

The Square of Price and Time

He later formulated his theory into what is known as the squaring of price and time. This concept represents the cornerstone of Gann's mathematical approach, where price movements and time intervals follow proportional relationships based on square root progressions and geometric angles.

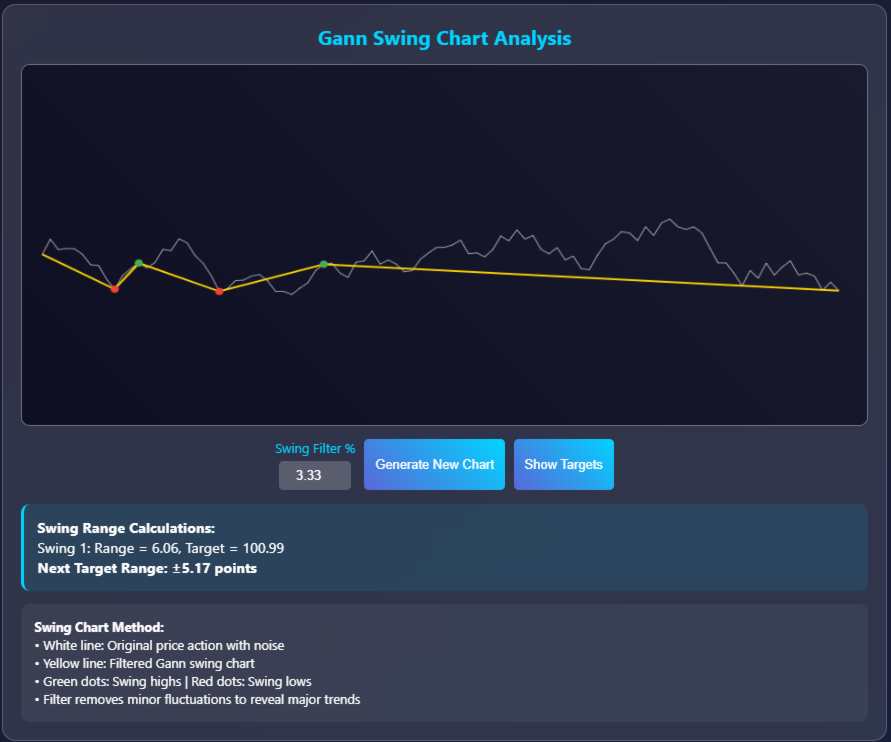
Gann Swing Chart Construction and Mathematics

Basic Swing Chart Methodology

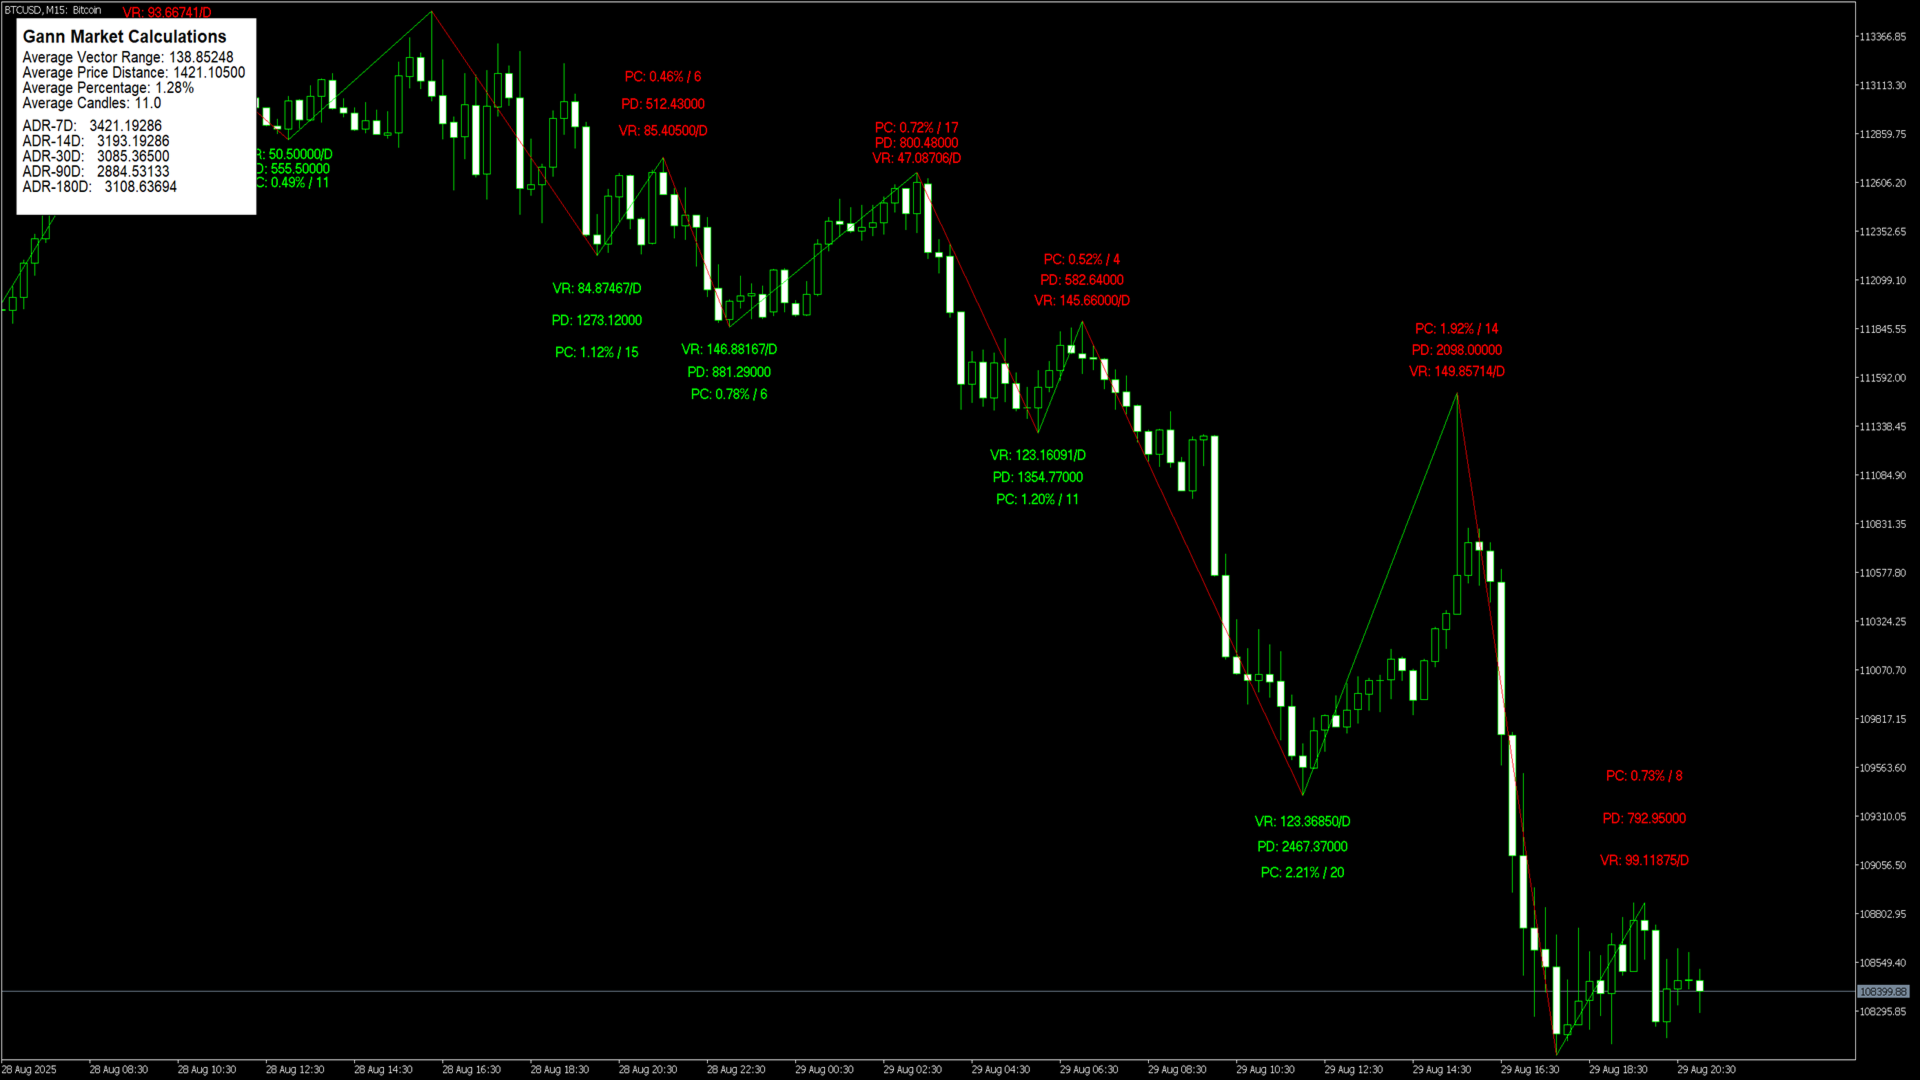
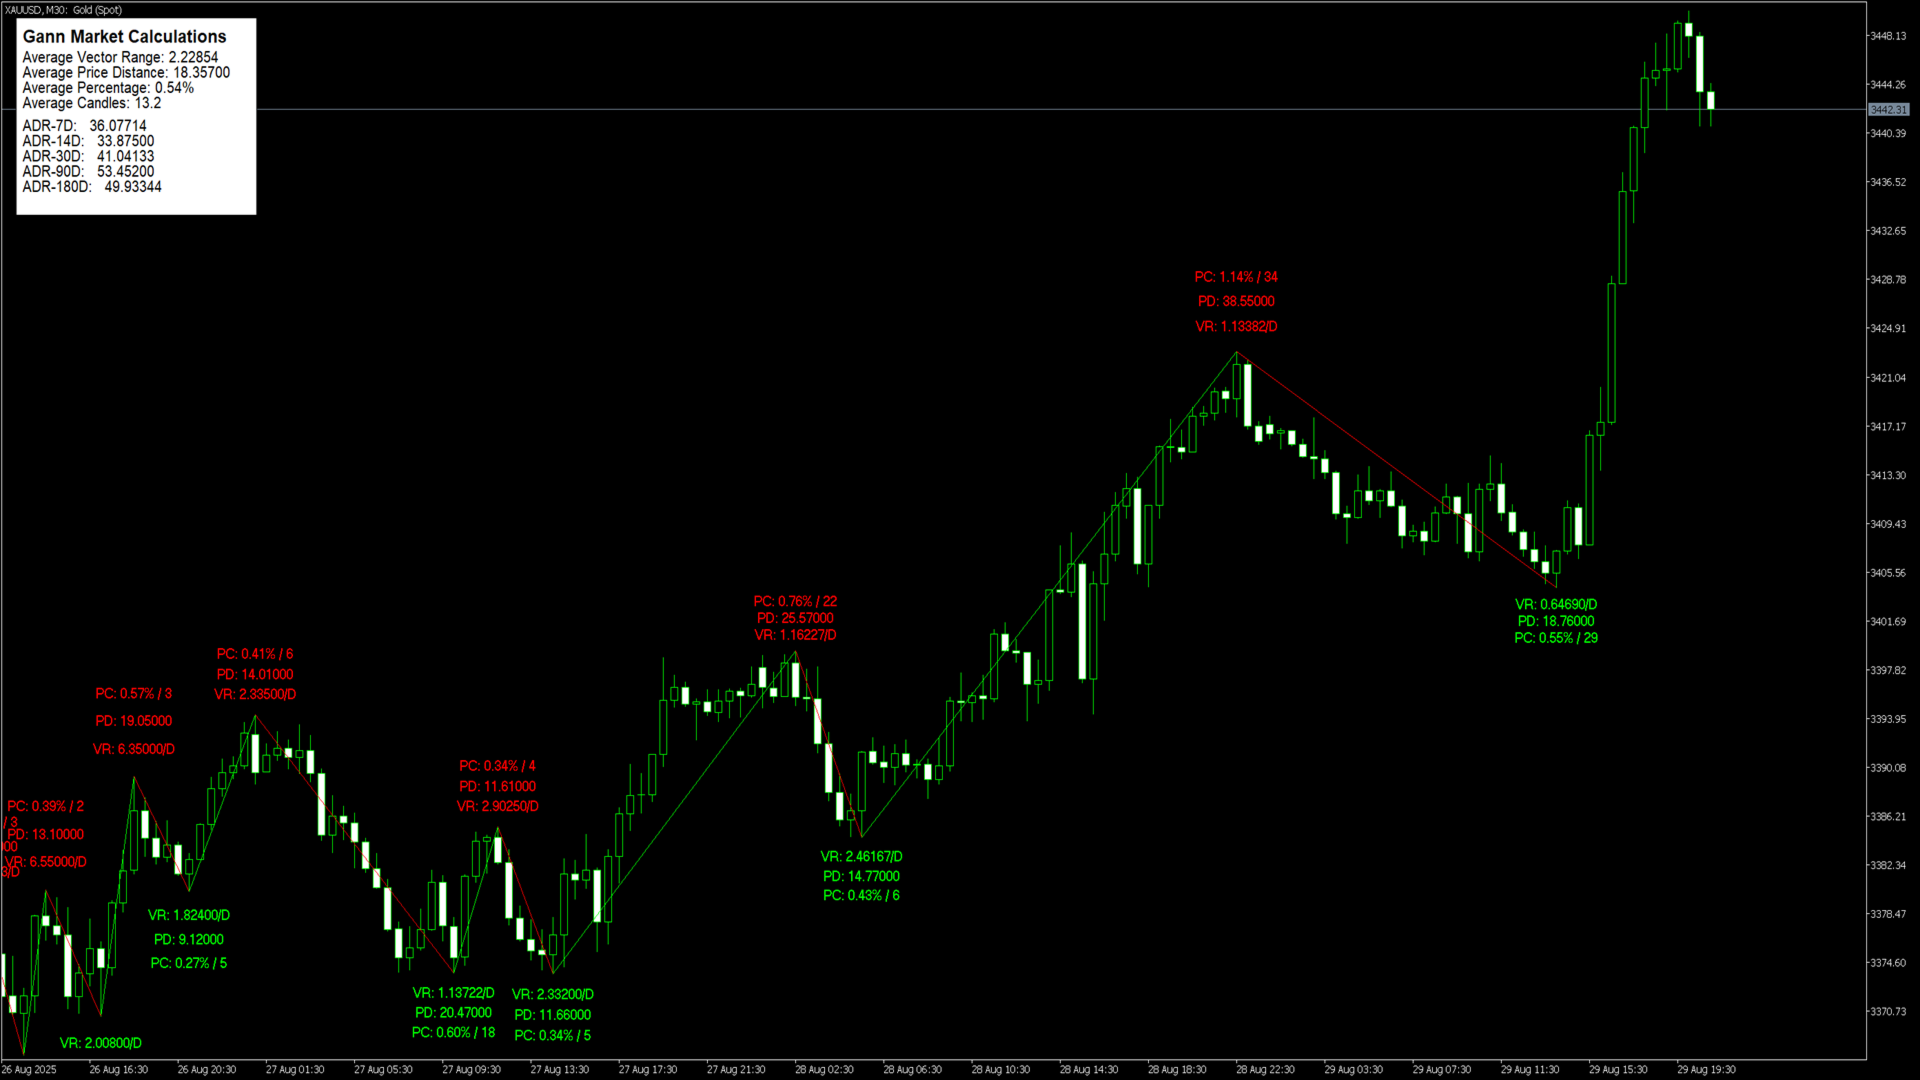
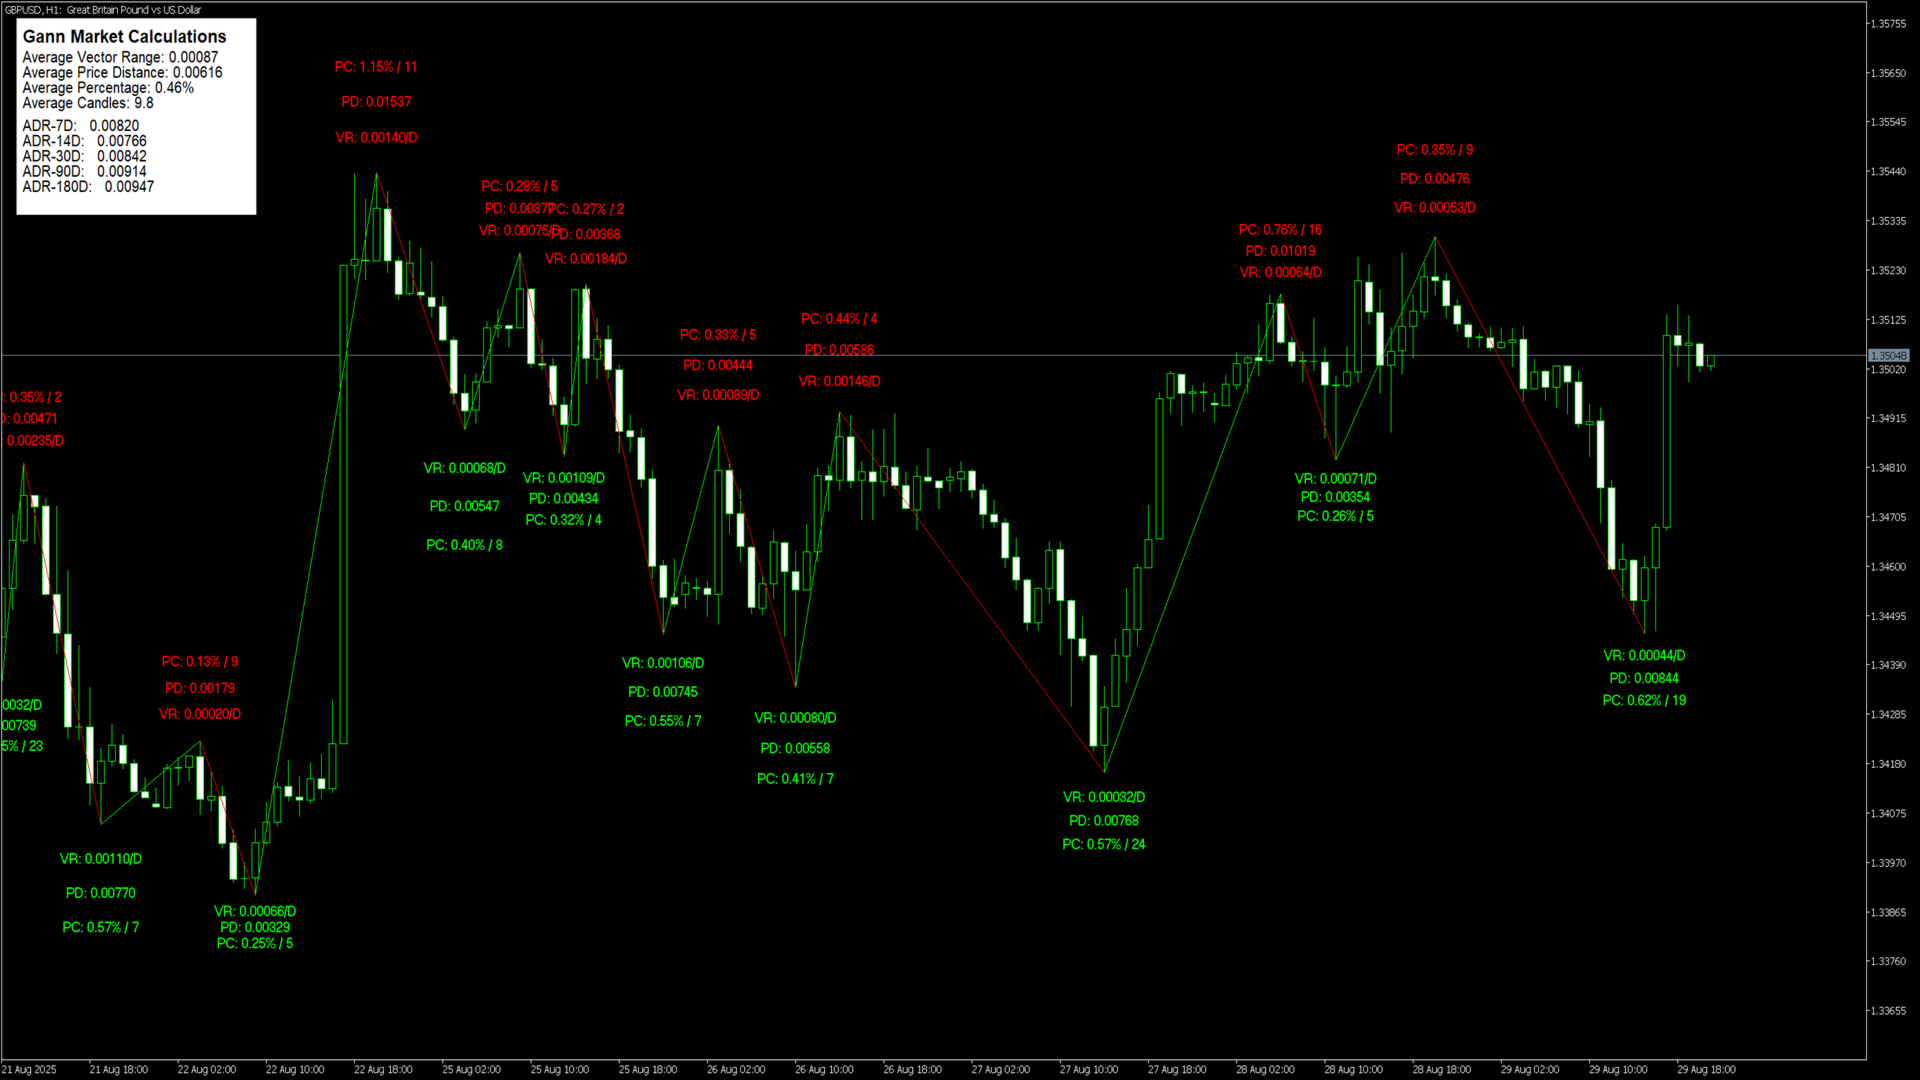
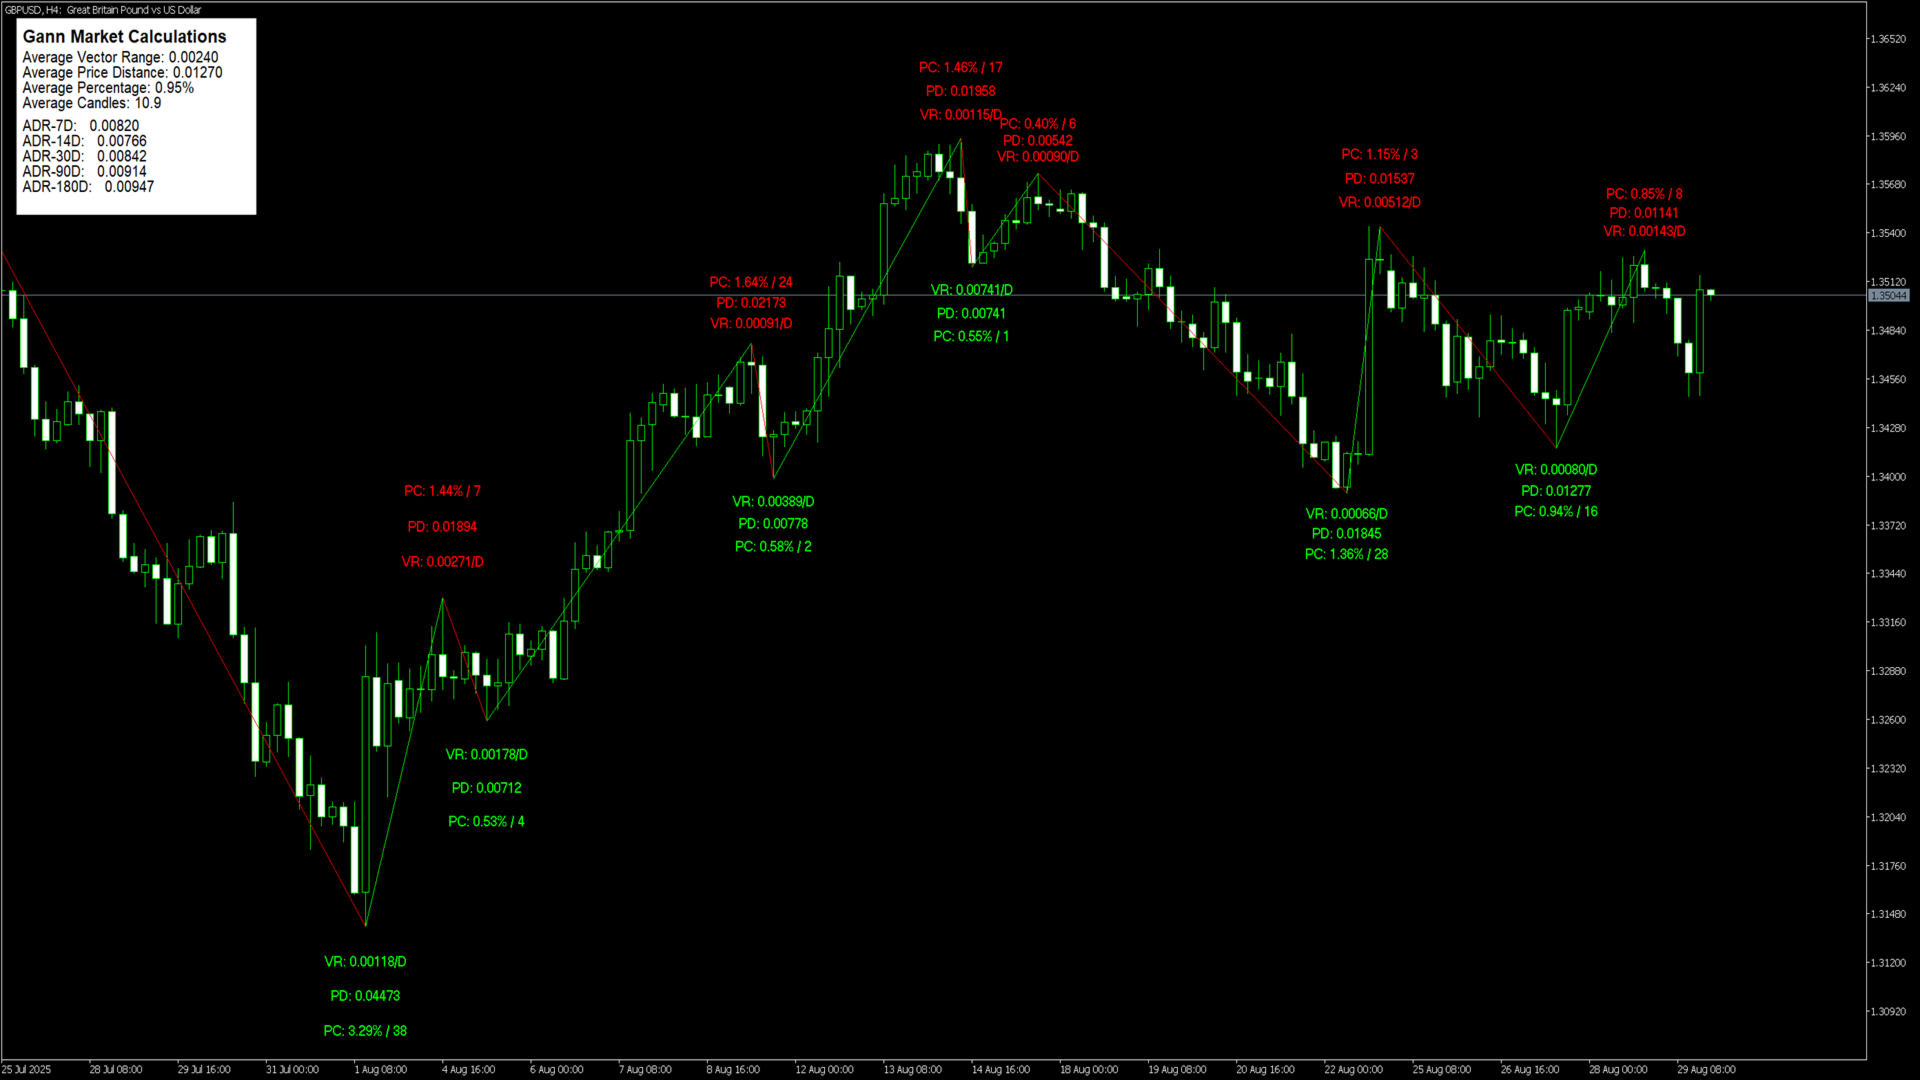
The Gann swing chart method systematically filters price action to identify significant market swings. The main goal of using Gann's charts is to remove the "noise" from regular price charts, revealing the underlying trend structure.

Mathematical Rules for Swing Identification

Upswing Requirements:

  • Price must exceed the previous swing high by a predetermined percentage or point value
  • The move must sustain above the breakout level for a specified time period
  • Volume confirmation often required for validation

Downswing Requirements:

  • Price must break below the previous swing low by the same mathematical criteria
  • Sustained breakdown below the violation level
  • Time-based confirmation of the new swing direction

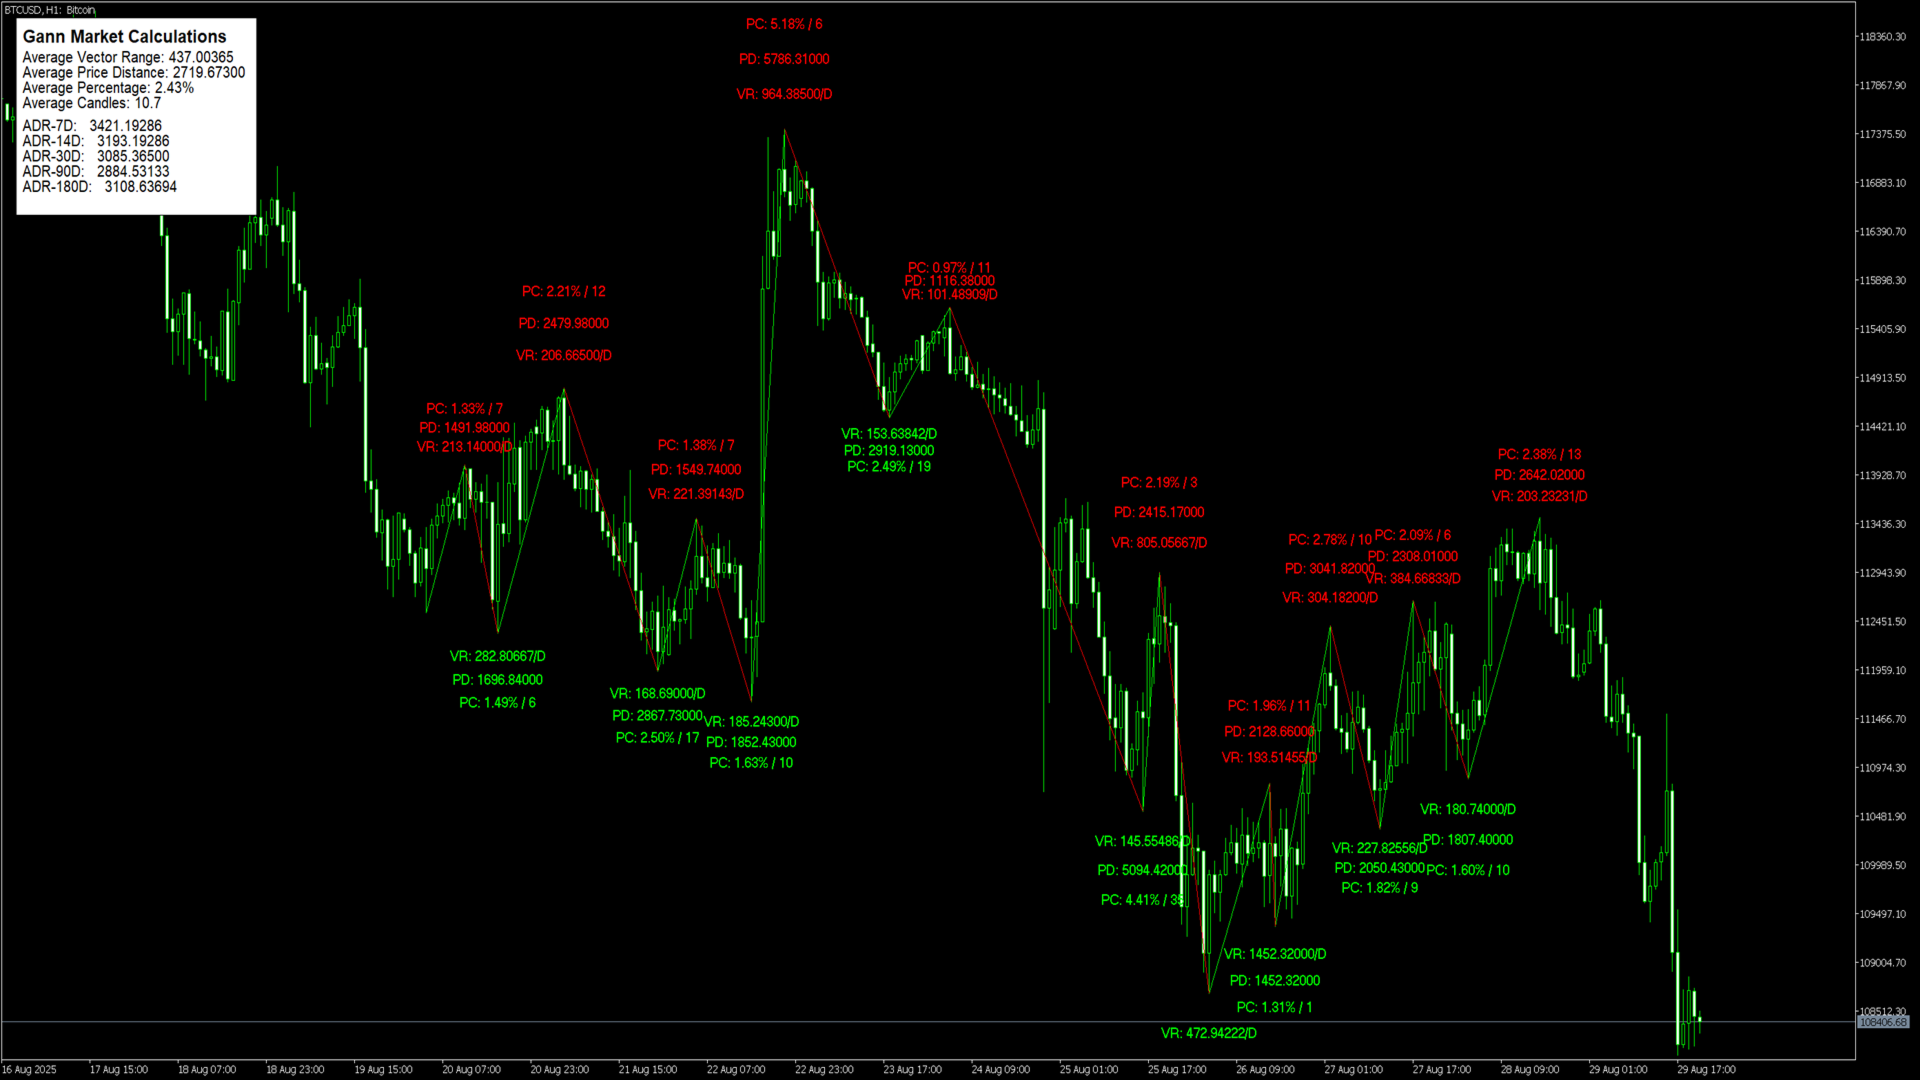
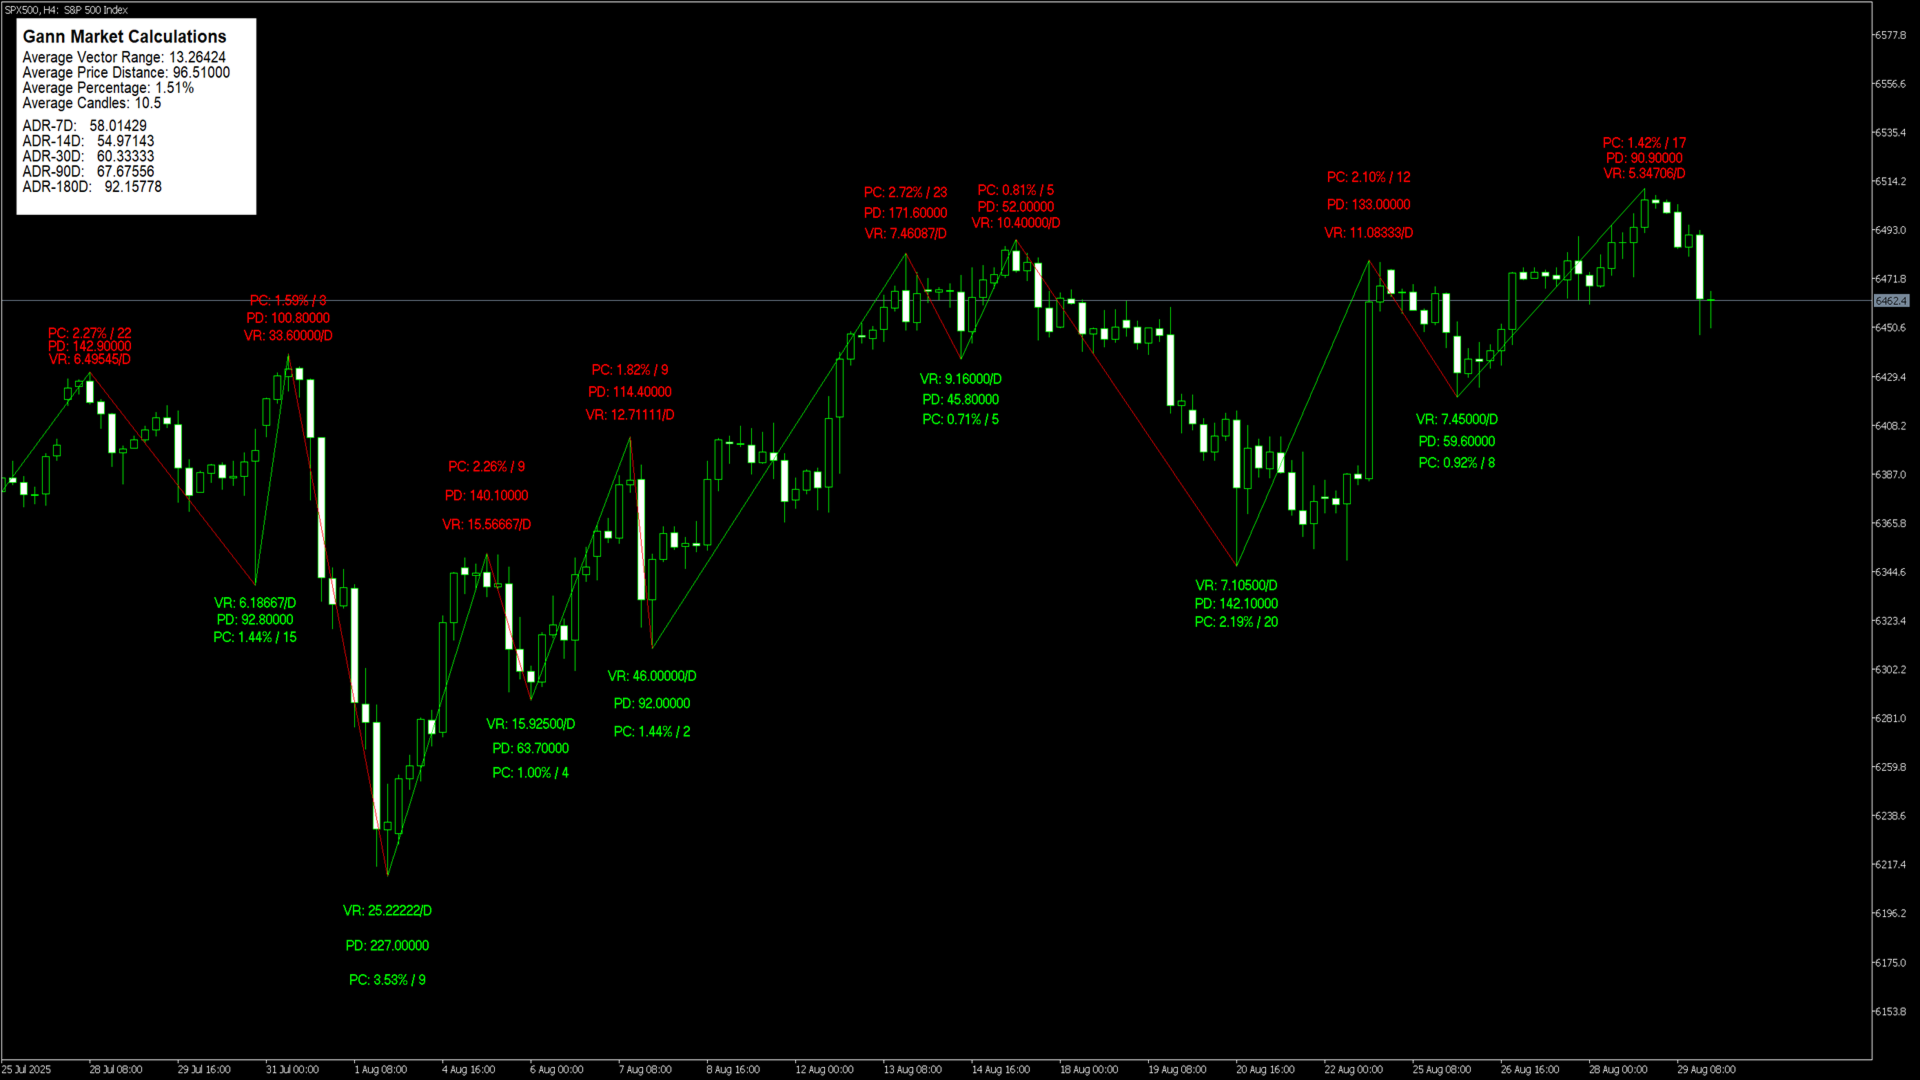
Swing Calculation Formulas

Range Calculation Method

Swing objectives – add the range to move to the top of that move to find out the target for the next upmove or reverse in the bear market.

Formula:

Next Swing Target = Current Swing Extreme + Previous Swing Range

Where:

  • Current Swing Extreme = The high (uptrend) or low (downtrend) of the current move
  • Previous Swing Range = Absolute difference between the previous swing high and low

Percentage-Based Swing Filters

Gann employed specific percentage filters to define valid swings:

Small Swing Filter: 3-5% price movement Medium Swing Filter: 5-10% price movement
Major Swing Filter: 10%+ price movement

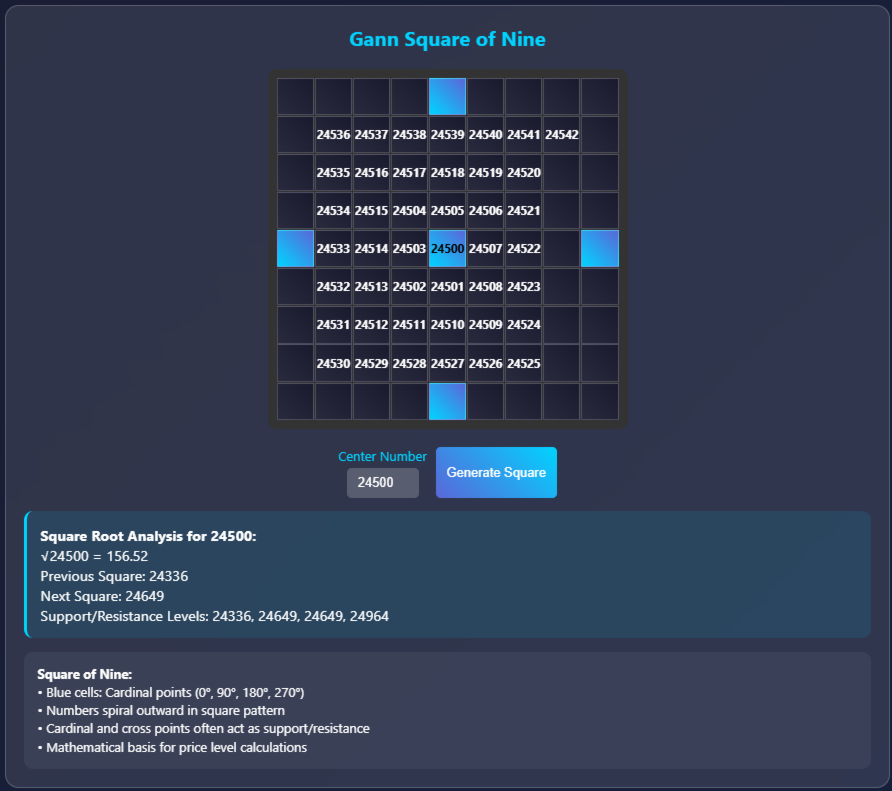
Square Root Progression in Swing Analysis

Gann discovered that significant price levels often aligned with square root relationships:

Square Root Calculation:

Next Resistance = √(Current Price²) + 1 Next Support = √(Current Price²) - 1

Square of numbers and 50% of the difference between those squares are significant support and resistance, but cannot be traded by themselves.

Advanced Mathematical Concepts

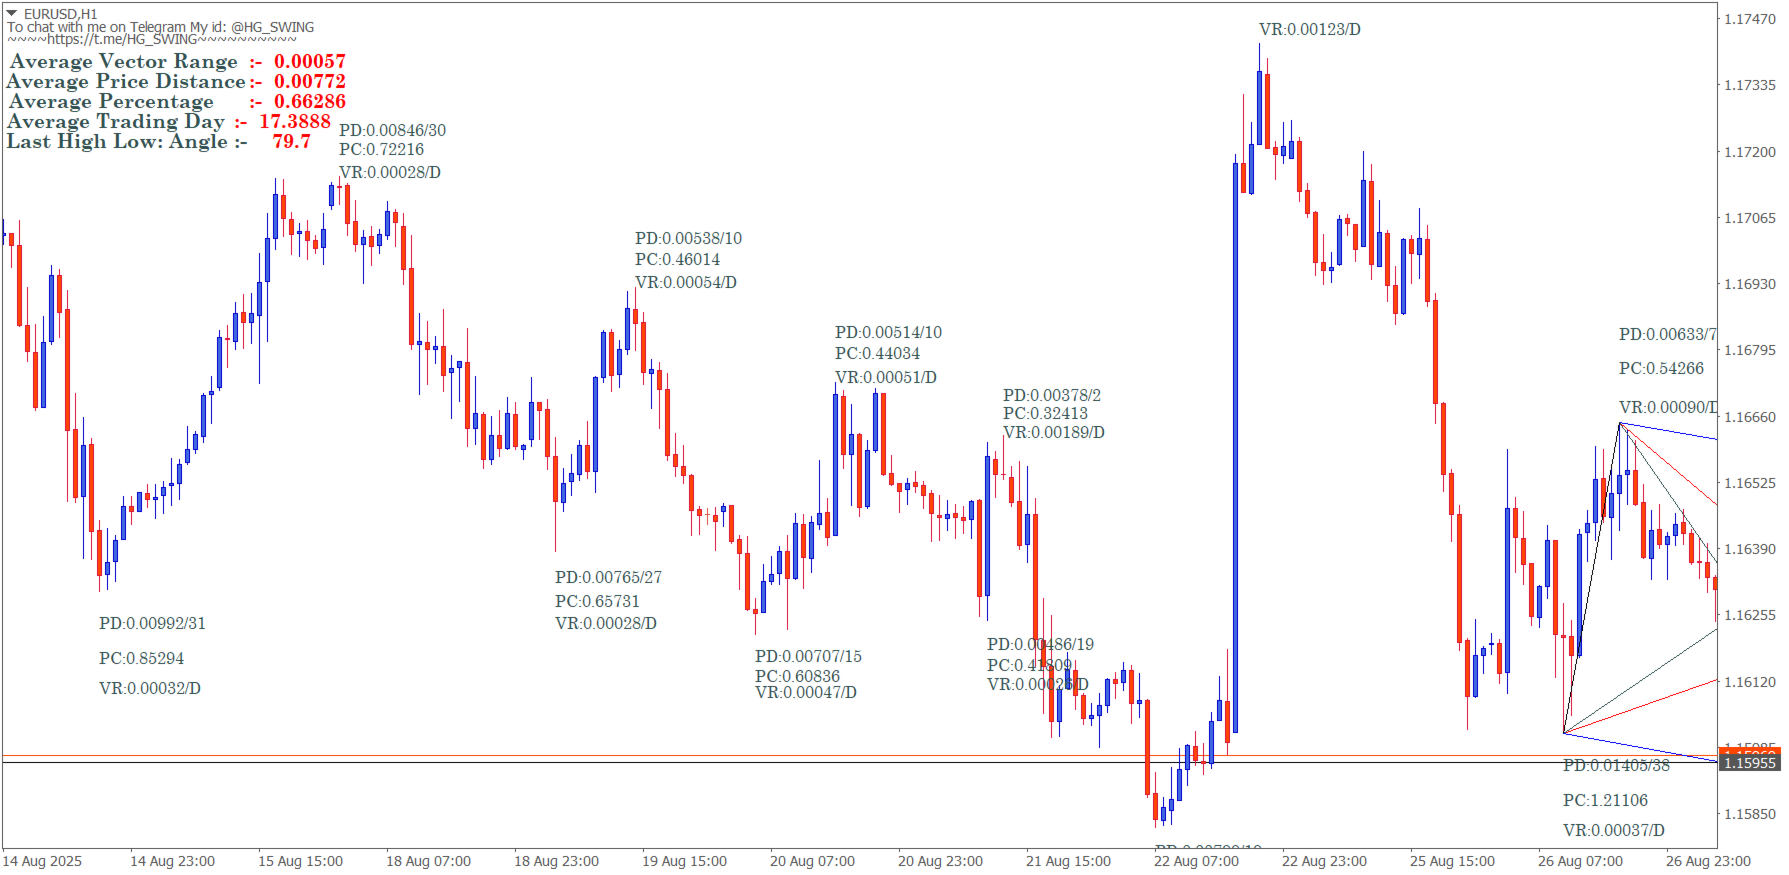
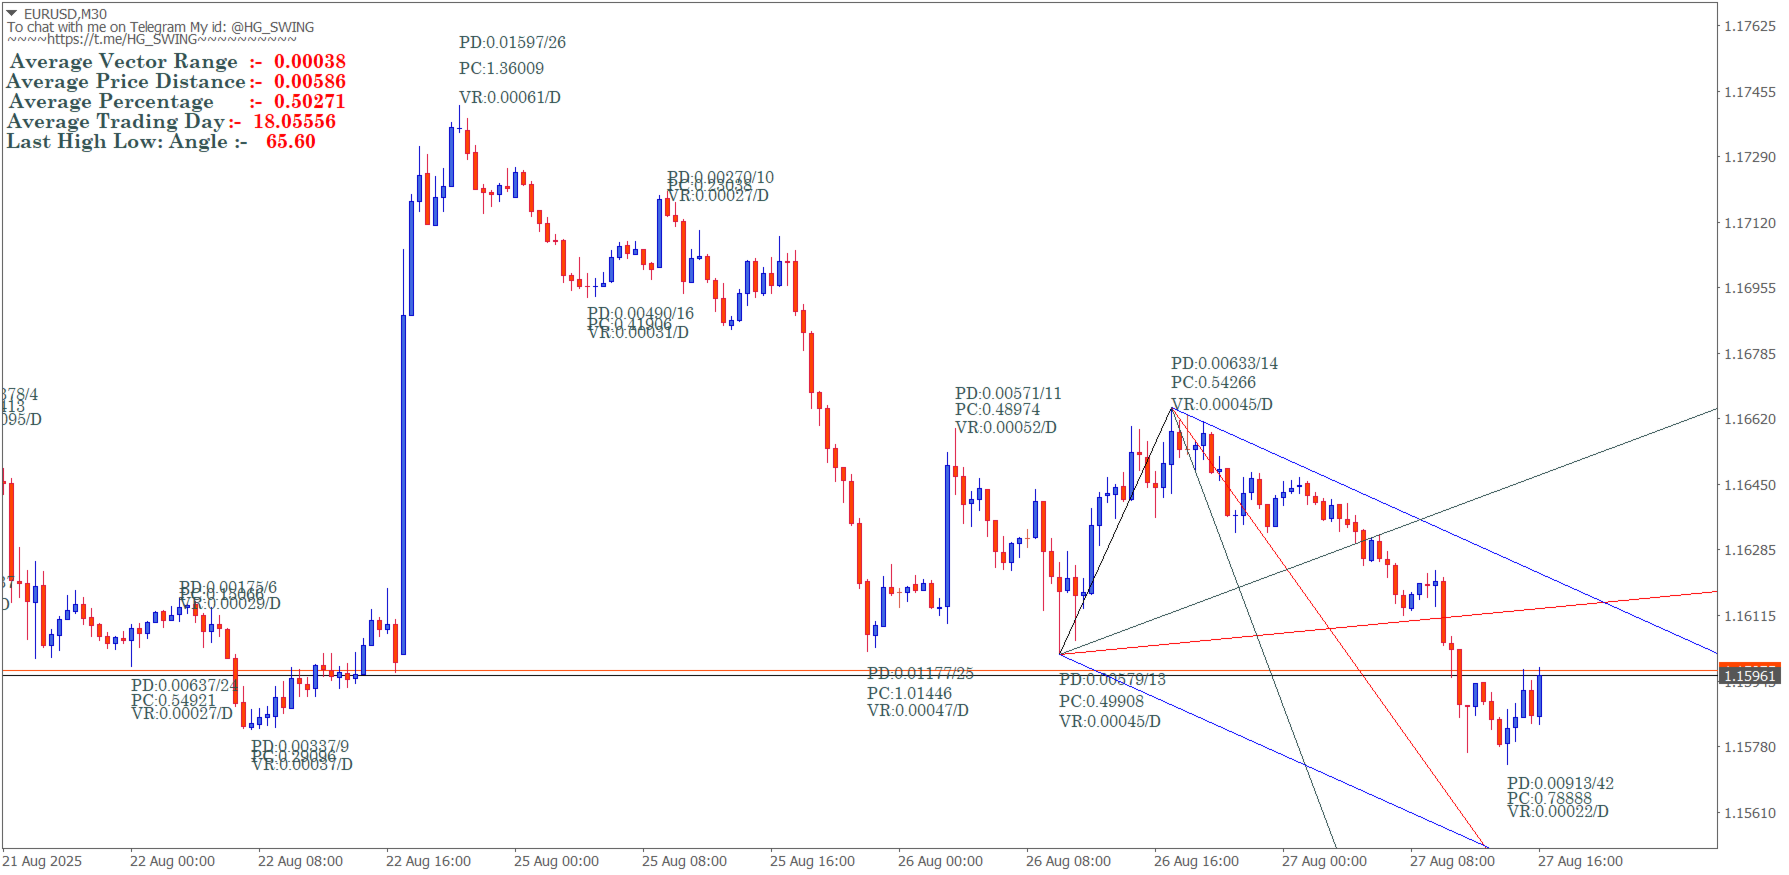
Gann Angles and Geometric Progression

Gann's angle system represents one of his most sophisticated mathematical contributions. These angles are derived from the relationship between price and time using specific geometric ratios:

Primary Gann Angles:

  • 1×1 (45-degree angle) - One unit of price per one unit of time
  • 1×2, 1×3, 1×4, 1×8 - Varying price-to-time relationships
  • 2×1, 3×1, 4×1, 8×1 - Inverse relationships

Mathematical Construction of Gann Angles

Angle Calculation = arctan(Price Movement / Time Movement)

For a 1×1 angle on a chart where 1 day = $1:

  • Slope = 1/1 = 1
  • Angle = arctan(1) = 45 degrees

The Square of Nine

This represents Gann's most complex mathematical tool, incorporating:

Spiral Mathematics: Numbers arranged in expanding squares with specific directional movements creating resistance and support calculations.

Cardinal Points: 0°, 90°, 180°, 270° positions within the square Cross Points: 45°, 135°, 225°, 315° intermediate positions

Time Cycle Calculations

WD Gann, a famous trader, believed that market movements were influenced by predictable time cycles.

Natural Time Periods:

  • Solar cycles (365 days)
  • Lunar cycles (29.53 days)
  • Seasonal cycles (90-day quarters)
  • Geometric progressions (7, 14, 21, 30, 45, 60, 90, 120, 180, 360 days)

Practical Application of Gann Swing Mathematics

Trend Confirmation Methods

To confirm a trend was in progress, he would look for lower highs and higher lows to form after a major reversal in trend.

Uptrend Confirmation:

  1. Price creates higher swing highs
  2. Price maintains higher swing lows
  3. Gann angles provide directional support

Downtrend Confirmation:

  1. Price creates lower swing highs
  2. Price maintains lower swing lows
  3. Gann angles provide directional resistance

Risk Management Through Mathematics

Gann's main trading philosophy was to trade with a close stop loss and select the most opportune trades in the direction of the main trend.

Mathematical Stop Loss Placement:

  • 3-5% below swing lows for long positions
  • 3-5% above swing highs for short positions
  • Gann angle violations as alternative stop levels

Swing Target Calculations

Primary Target Method:

Target = Entry Price ± (Previous Swing Range × 1.0)

Secondary Target Method:

Target = Entry Price ± (Previous Swing Range × 1.618)

Square Root Target Method:

Target = Next Perfect Square Root Level

Modern Implementation of Gann Mathematics

Digital Age Adaptations

Contemporary traders apply Gann's mathematical principles using:

Automated Swing Detection: Algorithms that identify swings based on percentage or point-based filters

Computer-Generated Gann Angles: Software that automatically plots angle lines based on mathematical relationships

Cycle Analysis Tools: Programs that identify time cycle confluences using Gann's natural time periods

Combining Traditional Mathematics with Modern Tools

Fibonacci Integration: Combining Gann levels with Fibonacci retracements for confluence analysis

Volume Profile Analysis: Using Gann price levels with volume-based support and resistance

Multi-Timeframe Analysis: Applying Gann swing principles across multiple time horizons

Critical Analysis and Limitations

Mathematical Precision vs. Market Reality

While Gann's mathematical approach provides structured market analysis, several considerations affect practical application:

Subjectivity in Swing Identification: Different traders may identify different swing points using identical criteria

Market Structure Changes: Modern electronic markets may not respond identically to mathematical relationships identified in Gann's era

Curve Fitting Risk: The complexity of Gann's methods can lead to retrospective optimization rather than predictive accuracy

Balancing Mathematical Rigor with Trading Psychology

Successful implementation requires understanding that mathematical precision must be balanced with:

  • Market sentiment analysis
  • Fundamental factor consideration
  • Risk management principles
  • Position sizing mathematics

Conclusion

WD Gann's swing trading and market calculation mathematics represent a sophisticated attempt to discover natural law within financial markets. W. D. Gann's legendary swing trading method has been unstoppable for the last 7 years. His geometric approach to market analysis, combining mathematical precision with natural cycles, continues to influence traders nearly a century after its development.

The enduring appeal of Gann's methods lies not just in their mathematical elegance, but in their systematic approach to market analysis that removes emotional decision-making from trading. While modern markets have evolved significantly since Gann's era, the underlying mathematical relationships he identified continue to provide valuable insights for contemporary traders willing to master their complexity.

Success with Gann's methods requires dedicated study of both the mathematical foundations and practical application techniques. The geometric precision of his approach demands disciplined implementation, but for those who master these calculations, Gann's swing trading methodology offers a unique perspective on market structure that transcends conventional technical analysis approaches.

Note: Trading based on any mathematical system involves significant risk. Historical performance of analytical methods does not guarantee future results. Proper risk management and thorough backtesting are essential before implementing any trading strategy based on Gann's mathematical principles.

link:- https://claude.ai/public/artifacts/4579f122-c256-455a-a251-a0c9f934cfd0


推荐产品
Lofi Trend
Chua Wee Kiat
用Lofi Trend v1让趋势一目了然——非重绘、超干净信号,为你的每一次交易决策赋能。 Lofi Trend v1 – 非重绘型布林带趋势指标 Lofi Trend v1,助你的趋势识别再上一个台阶。专业级、EA友好、信号真实可靠。 适用于任意周期 无论是M1短线、M15日内,还是H4和日线的波段交易,Lofi Trend v1都能灵活应用,适配你的任何交易风格。 真正的非重绘信号 所有信号均在K线收盘时产生,绝无重绘。买卖箭头与趋势线所见即所得,历史与实盘都100%一致。 高效噪音过滤 ATR与优化布林带算法协同,有效避免假信号和行情杂波,让你专注于真实转折点。 醒目的趋势线与买卖箭头 颜色区分的趋势线与直观买卖箭头,让趋势变化一目了然,关键时刻真正掌控市场。 EA可调用输出 买入箭头(缓冲区4)、卖出箭头(缓冲区5)都能被iCustom引用,让你轻松实现自定义EA、自动化信号处理。 简约、专业的图表体验 画面不繁杂,只给你最核心的信号和参考。 灵活自定义参数,适用各类市场环境 调整BB标准差即可让信号变多或变少:减小标准差获得更多信号,增加则仅留更强信号。ATR过滤及周
Seasonal Pattern Trader
Dominik Patrick Doser
Disclaimer : Keep in mind that seasonal patterns are not always reliable. Therefore, thoughtful risk management is crucial to minimize losses.  Seasonal patterns in the financial world are like a well-guarded secret that successful investors use to their advantage. These patterns are recurring price movements that occur during specific periods or around special events. Additionally, there are also intraday patterns that repeat. For example, Uncle Ted from Forex Family suggests examining previou
Trendicator
Nico Deuscher
Functions Analyzes the current market trend Displays a numbering system based on trend structure (see below) Colors the chart background depending on trend direction Displays the ZigZag indicator Display Fibonacci Retracement with custom defined levels at the lates corrective trend movement Display Fibonacci Expansions with custom defined levels at the latest progressive trend movement Buffers for all relevant Trend parameters so EAs can access the trend information Background Information The
Novato
Juan Manuel Rojas Perez
5 (1)
Descubre el poderoso aliado que te guiará en el laberinto de los mercados financieros. Este indicador revolucionario te llevará de la incertidumbre a la claridad, permitiéndote identificar con precisión los puntos de inflexión del mercado. Mejora tus decisiones de entrada y salida, optimiza tus operaciones y ¡multiplica tus ganancias con confianza. ¡Para más información, te invitamos a unirte a nuestro canal de Telegram en https://t.me/Profit_Evolution  ¡Allí encontrarás contenido exclusivo, an
FREE
Novato alertas
Juan Manuel Rojas Perez
4.75 (4)
Descubre el poderoso aliado que te guiará en el laberinto de los mercados financieros. Este indicador revolucionario te llevará de la incertidumbre a la claridad, permitiéndote identificar con precisión los puntos de inflexión del mercado. Mejora tus decisiones de entrada y salida, optimiza tus operaciones y ¡multiplica tus ganancias con confianza. Ahora con alertas en tu pc o móvil ¡Para más información, te invitamos a unirte a nuestro canal de Telegram en   https://t.me/Profit_Evolution  ¡Al
FREE
Impulse fractals indicator - is counter-trend oriented complex market fractal pattern.  Market creates bull/bear impulse, trend starts, fractals on impulsed wave are an agressive pullback signals. Buy arrow is plotted when market is bearish and it's impulse showed up-side fractal, and sell arrow is plotted when market is bullish and it's impulse showed dn-side fractal. Main indicator's adjustable inputs : impulsePeriod - main period of impulse histogram  filterPeriod  - smoothes impulse accordi
Hunttern ZigZag MT5
Hassan Gh Fakhraei
5 (1)
Hunt markets with Hunttern ZigZag . Easy to use with one parameter    You can use it for the following:       -Classic patterns       -Heads and shoulders       -Harmonic patterns       -Elliott Wave       -Support and resistance       -Supply and Demand Single parameter:      -Period (1-120) Features:        -Candle time        -Single parameter        -Light mode template This is version 1 of Hunttern ZigZag. We are very happy to receive feedback from you.
FREE
Revers Point
Vitalii Zakharuk
This indicator determines the short-term and long-term trend. The analysis is based on the selected timeframe. Indicator shows the points of opening deals for sale or purchase, and also indicates the direction of the trend at: Short term Long term This indicator not only signals an immediate purchase or sale. It indicates short term and long term trend. The indicator allows you to examine in more detail the real and historical market trends!
Reversal Composite Candles
MetaQuotes Ltd.
3.69 (16)
该系统的思路是通过计算复合蜡烛来识别反转形态。 反转形态类似日本蜡烛条分析的 "锤头" 和 "吊颈" 形态。但它使用符合蜡烛替代单一的蜡烛,并且不需要复合蜡烛的小实体来确认反转。 输入参数: Range - 最大柱线数量, 计算复合蜡烛时用。 Minimum - 最小复合蜡烛大小 (传统的点数)。 ShadowBig and ShadowSmall - 影线 (复合蜡烛单元)。 Limit, StopLoss and TakeProfit - 开盘价, 止损位和止盈位, 它们是相对于复合蜡烛的收盘价 (复合蜡烛单元)。 Expiration - 订单过期时间 (单位柱线), 用于挂单 (Limit!=0.0)。 反向蜡烛条形态的判别如下。 它计算复合蜡烛参数,其自最后的完整柱线 (索引为 1) 至由 Range 输入参数定义的柱线数量。如果复合蜡烛大小大于由 Minimum 输入参数指定的数值, 它分析复合蜡烛的影线检测反转条件。 空头能量的特征是复合蜡烛的上影线为零, 多头能量的特征是复合蜡烛的下影线为零。 为确认空头趋势反转 (且多头开始),需要以下检查: 下影线的大小 (多头能量
FREE
Envolventes con alertas
Juan Manuel Rojas Perez
MT5 Enveloping Pattern Detector: Your competitive advantage in trading Are you looking for a tool to help you accurately identify the best trading opportunities in the forex market? Our Engulfing Pattern Detector provides you with a highly reliable buy or sell signal, based on one of the most recognized and effective Japanese candlestick patterns: the engulfing pattern. With an average success rate of 70%, this indicator will allow you to make safer and more profitable investment decisions. Don'
FREE
Custom Signal Scanner MT5
Satya Prakash Mishra
Custom Indictor Signal Scanner for scan your own any custom indicator and template its one click you can open your desire signals(given time frame alert). Also can open same template with particular input indicator just type name of template your created with given indicator and enjoy all time frame scan with your logical signals  input string s2 = "====== Embedded Indicator Settings ======"; input UseEmbeddedIndicator = false; // Use embedded indicator instead of external file ( don't use its n
XFlow
Maxim Kuznetsov
XFlow shows an expanding price channel that helps determine the trend and the moments of its reversal. It is also used when accompanying transactions to set take profit/stop loss and averages. It has practically no parameters and is very easy to use - just specify an important moment in the history for you and the indicator will calculate the price channel. DISPLAYED LINES ROTATE - a thick solid line. The center of the general price rotation. The price makes wide cyclical movements around the
Anti Butterfly Harmonic Pattern Indicator MT5 The Anti Butterfly Harmonic Pattern Indicator on the MetaTrader 5 platform automatically detects harmonic pattern points X, A, B, C, and D directly on the chart. It analyzes price data and calculates Fibonacci ratios with high accuracy, enabling precise identification of potential reversal zones. «Indicator Installation & User Guide» MT5 Indicator Installation  | Anti Butterfly Harmonic Pattern Indicator MT4  | ALL Products By  TradingFinderLab  | Be
FREE
GdeAsset Position
Daniel De Almeida Galvao
免费获取! 为交易者、资本管理基金和 MQL5 开发人员建模,通过注册 Gdeasset Blackbox 获取此专家的算法。 仅为购买设置财务状况或仅为销售保护资本的基本工具。 例如:为了保护比特币的多头仓位,只需保留一小部分仓位并将 GdeAsset 配置为仅卖出,然后它将在比特币下跌期间积累收益,并通过禁用止损来维持多头仓位。 购买 GdeAsset Blackbox 30 天,到期后可免费获得 GdeAsset 的源代码。 然后您可以利用自己的洞察力改进算法。 此促销活动将根据买家对 GdeAsset Blackbox 的决定而受到限制。 与 GdeAsset BlackBox 合作:鉴于货币和金融资产交换的明显需求,该合作提案应运而生,旨在向全球市场参与者传播定价工具,以应对全球通胀贬值。 GdeAsset 正在寻求合作伙伴,在其算法内开发定价和财务结算工具,以保护需要迁移当地货币的投资者的资产。 GdeAsset Position 正在开发成为一个货币吸收平台,为加密市场提供流动性。 通过订阅我们的某个产品、开发我们的算法或提交建议来做出贡献。 社会不平等影响着世界各地人们
FREE
Functional in the Forex market. Functional in the B3 market - Bolsa Brasil Balcão. Motivation The technical Fibonacci retraction indicator for many is essential and the basis for all market movement forecasts. The name of the tool comes from the Italian mathematician Leonardo de Pisa (13th century). This DEMO version will work in Meta Trader with Demo and Strategy Tester. To purchase the Full version that works on a Real account, click on: https://www.mql5.com/en/market/product/38089 Opera
FREE
Explosive Breakout Hunter 是一款旨在通过捕捉强劲突破来最大化收益的智能交易系统(EA)。 尽管胜率约为50%,且每月的交易次数有限,但它更注重质量而非数量。 耐心等待最佳交易机会,稳步积累大幅获利。 您可以通过回测结果的截图了解该EA的潜在盈利能力。 此外,您还可以免费试用EA的演示版,亲自体验其效果。 安装非常简单,无需更改任何设置。 EA可以在大多数使用GMT+2(包括夏令时)的经纪商服务器上正常运行,且无需额外调整。如果您的经纪商服务器时间不同,也可以通过EA属性轻松调整。 必要条件: 交易货币对:   USDJPY 时间周期:   1小时图 交易时间:   东欧时间(EET)7:00至12:00 推荐条件: 最低初始资金: $1,000 杠杆: 最低1:25(推荐1:100) 使用VPS: 建议通过VPS确保EA全天候稳定运行 中长期策略: 本EA以中长期收益最大化为优势,建议至少运行1年,甚至更长时间! 回测参数: 回测时间: 2014年1月1日至2024年11月30日 初始资金: $5,000 杠杆比例: 1:100 账户资金风险比例: 5% 使用
Duende MT5
Nestor Alejandro Chiariello
交易员您好! 我提出“杜安德”战略, Duende 是一种算法,可以检测不同高位和低位的模式,在这些模式中它们保持不变以进行良好的输入,恢复系统查询各种事物,例如盈亏平衡,并在同行之间交叉 它已被证明可以毫无问题地控制多种货币,并在市场中对新闻进行强大的控制 可以使用您需要的所有符号来管理它 我的策略针对“所有外汇市场”进行了优化,但也有最好的货币对 USDCAD、EURCAD、EURCHF、USDCHF、EURJPY”,与其他 RANGED 货币相比,它是最稳定的货币,您可以找到自己的方式来使用其他符号,但是 推荐使用我设计的 Duende 它有一个内置的系统来冒险 x 金额的余额,如果市场在任何时候变得不稳定它也有恢复 它也有我的智能算法系统,当它从我的内置秘密指标中检测到正确的预测时,TP 可以关闭一些头寸而不是其他头寸。 我的策略 EA 有实时历史 现场表演 如果您想要我的信号预设,请私下询问我的客户 https://www.mql5.com/en/users/aiotrading/seller 每次收购价格都会上涨,我们将以此来保护,这
Slope Direction Line MT5
Do Kim Dang Khoi
5 (3)
If you love this indicator, please leave a positive rating and comment, it will be a source of motivation to help me create more products <3 How to use  Slope Direction Line Uptrend: When the SDL line slopes up and turns from red to green, it shows that the price is trending up. This is also considered a buy signal. Downtrend: When the SDL line slopes down and turns from green to red, it shows that the price is trending down. This is also considered a sell signal. Sideways: When the SDL line mo
FREE
Start Midas Fibo Bands
Ricardo Almeida Branco
Here we have the Start Midas Fibo Bands , I confess that it is an indicator that excited me enough to operate because I was able to find more defined rules. Well, the indicator has the functions of the other indicators of the Start line , which is a possibility to plot several Midas on the screen, you can move the anchor point using keyboard shortcuts and use the legend to differentiate one anchor from another. The rules that I have analyzed for my possible setup are recommended to the entry, st
VWAP Bands with ML
Guillermo Pineda
VWAP 机器学习波段: 交易者的预测优势 使用 VWAP 机器学习波段,解锁市场分析的下一个层次——一款创新的 MQL5 指标,旨在提供对市场趋势、动态支撑/阻力以及高概率交易信号的无与伦比的洞察力。 该指标利用专有的自适应机器学习算法与成交量加权平均价格 (VWAP) 的强大功能相结合,超越了传统分析。它旨在为您提供真正的预测优势,帮助您在价格走势完全展开之前预测其动向并抓住市场机会。 为什么 VWAP 机器学习波段将成为您的首选指标: 智能自适应 ML-VWAP 核心: 体验真正动态的 VWAP 计算。我们独特的机器学习方法会根据实时波动性和市场状况自动调整其平滑度,提供比标准 VWAP 更灵敏、更准确的趋势表示。 专有预测引擎: 使用“预测”参数获得预见性。这项尖端功能将 ML 平滑的 VWAP 向前投影,让您能够强大地洞察潜在的未来价格路径,并帮助您为即将到来的市场变化做好准备。 波动率优化波段调整: 使用“Sigma”参数微调指标的灵敏度。精确控制波动率如何影响 ML 平滑和波段扩展,确保指标完美适应任何市场环境——从平静的盘整到爆发性趋势。 多层动态标准差波段: 精确识别
Classic Shark Harmonic Pattern Indicator for MetaTrader 5 The Classic Shark Harmonic Pattern Indicator utilizes specific Fibonacci ratios—such as 88.6%, 113%, and 161.8%—to detect potential price reversal zones. By recognizing the geometric configuration of the pattern, the indicator automatically draws the Shark pattern on the chart and highlights the Potential Reversal Zone (PRZ) when conditions are met. «Indicator Installation & User Guide» MT5 Indicator Installation  |  Classic Shark Harmon
FREE
La **Media Móvil de Tercera Generación (TGMMA)** es una versión avanzada del indicador estándar de **Media Móvil (MA)**. Fue descrita por primera vez por Manfred G. Dürschner en su artículo "Gleitende Durchschnitte 3.0" (en alemán). Aquí están las características clave de la TGMMA: 1. **Reducción del Retraso**:    - A diferencia de las MAs tradicionales, la TGMMA reduce significativamente el retraso. Se adapta más rápidamente a los cambios de precios, lo que la hace ideal para traders que busc
FREE
ZP Day Trading Indicator in MT5 The ZP Day Trading Indicator is one of the tools developed based on Price Action trading style concepts in MetaTrader 5. This indicator uses color-coded boxes to identify Trading Ranges on the chart. A trading range forms when the price moves within a specific range between a resistance level (ceiling) and a support level (floor) over a period of time. In such scenarios, buyers and sellers reach equilibrium within the defined range. «Indicator Installation & User
FREE
VFI Quantum
Nikita Berdnikov
5 (1)
Introducing VFI (Volume Flow Indicator) – a trading indicator that analyzes the relationship between volume and price movement to identify key trading opportunities. The indicator displays the strength and direction of volume flow, providing clear signals about potential entry and exit points. Signals are formed based on zero line crossovers, crossovers between the VFI line and its exponential moving average (EMA), and when the indicator exits overbought and oversold zones. Attention! This stra
FREE
PZ Penta O MT5
PZ TRADING SLU
3.5 (4)
The Penta-O is a 6-point retracement harmonacci pattern which usually precedes big market movements. Penta-O patterns can expand and repaint quite a bit. To make things easier this indicator implements a twist: it waits for a donchian breakout in the right direction before signaling the trade. The end result is an otherwise repainting indicator with a very reliable trading signal. The donchian breakout period is entered as an input. [ Installation Guide | Update Guide | Troubleshooting | FAQ | A
FREE
Martillo con alertas
Juan Manuel Rojas Perez
MT5 Hammer Pattern Detector: Your guide to more profitable operations Tired of searching for the best trading opportunities? Our innovative indicator gives you a competitive advantage by automatically identifying hammer patterns on your charts. Known for its high probability of success, the hammer pattern has been a fundamental tool in the arsenal of experienced traders for decades. Our indicator, designed to accurately detect this key pattern, will allow you to: Identify trend reversals earl
FREE
Super Trend Alert
Biswarup Banerjee
Super Trend Alert Indicator for MT5 is a powerful tool designed to help traders identify and follow market trends with precision. This indicator uses a proprietary algorithm to analyze price movements and provide clear trend signals, making it suitable for traders across all experience levels. You can find the MT4 version here Key features of the Super Trend Indicator include: Advanced trend analysis with real-time market scanning to detect potential trend directions. Real-time alerts that not
FREE
Simple QM Pattern MT5
Suvashish Halder
5 (1)
Simple QM Pattern   is a powerful and intuitive trading indicator designed to simplify the identification of the Quasimodo (QM) trading pattern. The QM pattern is widely recognized among traders for effectively signaling potential   reversals   by highlighting key market structures and price action formations. This indicator helps traders easily visualize the QM pattern directly on their charts, making it straightforward even for those who are new to pattern trading. Simple QM Pattern includes d
FREE
High Low Open Close
Alexandre Borela
4.98 (41)
如果你象这个项目一样,就有5个饥饿审查。 这项指标采用了既定价格的公开、高、低价和关闭价格 可以对特定时间区加以调整。 许多机构和专业人士都认为这些是重要的。 贸易商可以为你了解他们可能更进一步的地点, 积极。 现有期间为: 前一日。 前一星期。 曾任Month。 曾任。 前一年。 或: 目前日。 目前周。 目前 Month。 目前配额。 今年。
FREE
General Description In the simplest terms this is a contrarian intra-day scalping system. Built to try and let correct trades run as far as possible and flip the trade when indicated. The indicator looks at historical daily trading ranges to lay out levels at which it takes long and short positions based on the statistical levels. The indicator is built around index futures, mainly around S&P and the DOW but can be used an any futures contract mainly using AMP Futures to trade. The indicator is
该产品的买家也购买
AriX
Temirlan Kdyrkhan
1 (2)
AriX Indicator for MT5 A powerful trend-following and signal-evaluation tool AriX is a custom MT5 indicator that combines Moving Averages and ATR-based risk/reward logic to generate clear buy/sell signals. It visualizes dynamic SL/TP levels, evaluates past trade outcomes, and displays win/loss statistics in a clean on-chart panel. Key features include: Buy/Sell signals based on MA crossovers ATR-based SL/TP1/TP2/TP3 levels with visual lines and labels Signal outcome tracking with real-time stat
ARIPoint
Temirlan Kdyrkhan
ARIPoint is a powerful trading companion designed to generate high-probability entry signals with dynamic TP/SL/DP levels based on volatility. Built-in performance tracking shows win/loss stats, PP1/PP2 hits, and success rates all updated live. Key Features: Buy/Sell signals with adaptive volatility bands Real-time TP/SL/DP levels based on ATR Built-in MA Filter with optional ATR/StdDev volatility Performance stats panel (Success, Profit/Loss, PP1/PP2) Alerts via popup, sound, push, or email Cu
Gann Zone Pro MT5
Kirill Borovskii
This indicator identifies and displays zones, as it were areas of strength, where the price will unfold. The indicator can work on any chart, any instrument, at any timeframe. The indicator has two modes. The indicator is equipped with a control panel with buttons for convenience and split into two modes. Manual mode: To work with manual mode, you need to press the NEW button, a segment will appear. This segment is stretched over the movement and the LVL button is pressed. The level is displayed
获取免费的 AUX 指标、EA 支持和完整指南,请访问 – https://www.mql5.com/en/blogs/post/763955 发现趋势。读取模式。把握入场时机。 三步只需30秒!轻松交易 — 无需分析,您的智能助手已准备好简化您的工作流程 不再因图表信息过载而困扰。 通过智能趋势偏向检测自信交易。 兼容所有货币、加密货币、股票、贵金属、指数及任意时间框架。 只需点击并执行 — 就这么简单。 非常适合希望快速清晰交易的忙碌交易者。 TPTSyncX 是一款强大的全能 MetaTrader 5 指标,可无缝同步 趋势、图形模式 与 K线触发 分析,并以清晰智能的可视化系统呈现。专为追求清晰度、精确性和速度的交易者设计,它通过结合价格行为、结构模式和市场时机工具,帮助识别高概率交易机会。 主要功能: 智能可视化显示: 自动绘制价格结构模式,并清晰标注高点高 (HH)、低点高 (HL)、高点低 (LH) 与低点低 (LL) 于图表上 — 实时展现市场结构变化与潜在反转区域,对识别趋势转换与价格突破至关重要。 动态移动平均线: 根据所选目标K线范围自动调整周期,适用于短线剥
VTrende Pro
Andrii Diachenko
5 (1)
VTrende Pro - MTF indicator for trend trading with a display panel for MT5 *** Videos can be translated into any language using subtitles (video language - Russian) Although the signals of the VTrende Pro indicator can be used as signals of a full-fledged trading system, it is recommended to use them in conjunction with the Bill Williams TS. VTrende Pro is an extended version of the VTrende indicator. Difference between Pro version and VTrende: - Time zones - Signal V - signal 1-2 waves -    S
SupportResistancePeaks Indicator indicator - is the combination of dynamic support/resitance and price action pattern. As a rule support/resistance indicators uses already calculated, history levels. The most disadvantage of this method - new(incomming) levels always are not the same as were on history, in other words accuracy is not so high as expected. My indicator is looking for dynamic/live levels that are forming right now after trend lost it's power and choppy market starts. As a rule exac
Enigmera MT5
Ivan Stefanov
3.67 (3)
ENIGMERA:市场核心 引言 该指标及交易系统为金融市场提供了一种卓越的方法。ENIGMERA 利用分形周期精确计算支撑位和阻力位,展示真实的积累阶段,并给出方向和目标——无论处于趋势还是回调,系统均能正常运行。 如何工作 指标的大部分功能由图表左侧的按钮控制,可快速应对不同的市场状况。 按钮说明 ON/OFF – 显示或隐藏整个指标。 Support – 趋势的主支撑线。 Ch – 激活支撑通道,标示可接受的偏差范围。 Dev1(第一偏差) – 显示价格在支撑偏差范围内的运动,表明市场盘整或力量积累。 Dev2(第二偏差) – 显示价格在偏差之间的运动,表明趋势正在形成及其方向。 Dev3(第三偏差) – 指示趋势显著加速和高波动性。 45deg(45度) – 显示市场节奏和相对于45线的运动稳定性。 Tgt(目标) – 趋势目标线,标示可平仓的位置。 Tgt Dev – 目标可能波动的通道范围。 Vol(成交量) – 在K线图上显示成交量点,标示市场成交量的显著变化。 X – 当价格到达目标线时显示“X”标记。 RandC(随机颜色) – 将指标线条和标签随机着色,以便更好地
Weis Wave with Alert MT5
Trade The Volume Waves Single Member P.C.
4.94 (16)
Rental/Lifetime Package Options and Privileges  Rent Monthly Six Months   Yearly/Lifetime Weis Wave with Speed with Alert+Speed Index x x x Manual  x x x Quick Set up Video x x x Blog x x x Lifetime Updates x x x Setup and Training Material x x Discord Access Channel "The SI traders"          x Rectangle Break Alert Tool      x How to trade with it:    http://www.tradethevolumewaves.com   ** If you purchase please contact me to setup your  : Training Room and  complete manual access.  Wei
Transaction Speed MT5
Ivan Stefanov
5 (2)
当然,以下是翻译成中文(简体)的版本: 该指标标出市场中显现出 交易兴趣 的区域,并随后显示 订单积累区域 。它的工作方式类似于大规模的订单簿。 这是为 大资金 打造的指标,性能卓越。市场中有任何兴趣,你都能通过它清晰看到。 (这是一个 完全重写的自动化版本 —— 不再需要手动分析。) 交易速度 是一个全新的概念指标,它显示了市场上大订单 何时 、 何地 聚集,并揭示了其背后的意义。它可以在 非常早期 就检测到趋势的变化。 在外汇市场,所谓的“交易量”实际上是误导性的,因为那指的是价格在单位时间内的变化,因此真正的名称应是“交易速度”。 一切都取决于我们如何思考、如何行动、如何分析。 改变分析范式至关重要。 该指标完全重构了外汇市场上“交易量”的概念,用逻辑方式重新定义并应用,从而成为一个 独特而精准的工具 。 使用方法: 默认情况下,指标处于 自动模式 ,可独立用于任何时间周期。如果你希望切换到手动模式,只需点击 Auto / Manual Mode 按钮即可。 在 手动模式 下,所有计算从 2025年1月1日 开始。你可以根据需要更改该日期,以查看不同的分析结果。 最优数据周期
Pantera Indicator
Temirlan Kdyrkhan
A tool for on-chart strategy backtesting and performance analysis. A utility for developing, debugging, and testing custom trading ideas and indicator functions. An indicator designed to quickly test trading concepts and visualize the effectiveness of different input parameters. An all-in-one sandbox for testing everything from simple crossovers to complex, multi-condition trading systems.
“ Dynamic Scalper System MT5 ”指标专为在趋势波内进行剥头皮交易而设计。 已在主要货币对和黄金上进行测试,并可与其他交易工具兼容。 提供顺势短线建仓信号,并提供额外的价格变动支持。 指标原理: 大箭头决定趋势方向。 在趋势波内,我们采用一种生成小箭头形式的剥头皮交易信号的算法。 红色箭头代表看涨方向,蓝色箭头代表看跌方向。 敏感的价格变动线会沿着趋势方向绘制,并与小箭头信号协同作用。 信号运作方式如下:当线在适当时刻出现时,将形成入场信号;在出现线时,持仓;线完成后,平仓。 建议的操作时间范围为M1 - H4。 箭头在当前K线上方形成,如果下一根K线已开仓,则不会重新绘制上一根K线上方的箭头。 输入参数 Trend Wave Period - 趋势方向(大箭头)的周期,改变趋势波的时间间隔。值 1 表示趋势方向的最长持续时间,参数值越大,持续时间越短。 Scalper Arrows Period - 信号箭头(小箭头)的计算周期,改变入场信号的生成频率。值 3 表示最频繁的生成频率,参数值越大,箭头频率越低,准确度越高。 这些参数可以根据不同
秒级Tick蜡烛图生成器 是一款专为高频交易和短线炒单设计的专业级MT5指标工具。它能够将原始Tick数据实时转换为高度可定制的秒级K线图,帮助交易者精准捕捉市场微观波动,优化入场和出场时机。该工具能为您提供清晰的图表展示,让您更直观地识别价格行为模式,提升交易决策效率。 核心功能亮点: 灵活的时间间隔设置:支持自定义秒级K线生成周期(如1秒、5秒、10秒等),适应不同交易策略需求,尤其适合超短线交易者。 真实的Tick数据还原:基于原始报价数据生成蜡烛图,确保数据准确性,避免因数据合成导致的信号失真。 实时买卖价显示:直接在图表上标注当前买价(Ask)和卖价(Bid),便于快速观察市场流动性及点差变化。 直观的视觉设计:采用清晰的蜡烛图配色(涨跌颜色区分)和专业的技术指标叠加,提升图表可读性。 适用场景: 高频交易(HFT):捕捉毫秒级价格变动,优化算法交易策略。 短线炒单(Scalping):快速进出场,利用微小波动获利。 为什么选择本产品? 传统分钟级或小时级图表无法满足超短线交易需求,而本工具填补了这一空白,让您能够像专业做市商一样,基于最精细的市场结构制定策略。无论是手动交易
Cycle Maestro MT5
Stefano Frisetti
5 (1)
NOTE: CYCLEMAESTRO is distributed only on this website, there are no other distributors. Demo version is for reference only and is not supported. Full versione is perfectly functional and it is supported. CYCLEMAESTRO , the first and only indicator of Cyclic Analysis, useful for giving signals of TRADING, BUY, SELL, STOP LOSS, ADDING. Created on the logic of   Serghei Istrati   and programmed by   Stefano Frisetti ;   CYCLEMAESTRO   is not an indicator like the others, the challenge was to inter
This indicator is based on the mathematics of the great trader W.D. Ganna. With its help, you can easily find strong levels by analyzing swings to find the optimal entry point. The indicator works on all instruments and all timeframes. The indicator is fully manual and has control buttons. All you need to do is press the NEW button, a segment will appear, which you can place on any movement, swing or even 1 candle that you want to analyze. By placing the segment, press the OK button. A grid (th
The indicator is designed to work on any trading platform. The program is based on proprietary algorithms and W.D.Ganna's mathematics, allowing you to calculate target levels of price movement based on three points with the highest degree of certainty. It is a great tool for stock trading. The indicator has three buttons: NEW - call up a triangle for calculation. DEL - delete the selected triangle. DELS - completely remove all constructions. The probability of achieving the goals is more than 80
SYSTEM INTRODUCTION:   The Binary Options Momentum System Is Specifically Designed For Binary Options Trading. Unlike Other Systems And Indicators That Were Adopted From Other Trading Environments For Binary Options. Little Wonder Why Many Of Such Systems Fail To Make Money . Many End Up Loosing Money For Their Users.  A Very Important Fact That Must Be Noted Is The Fact That Application Of Martingale Is not Required. Thus Making It Safer For Traders Usage And Profitability. A Trader Can Use Fi
金融指标 SolarTrade Suite:水星市场指标 - 您在金融市场世界中的可靠指南! 我们的外汇交易程序内置了强大的人工智能,实时分析市场数据。它准确预测价格变动,帮助交易者做出明智的决策。通过先进的算法,我们的指标优化策略并将风险降到最低。 这是一种移动平均线,使用特殊的创新和先进算法来计算其值,并且具有令人赏心悦目的设计。 理解此指标的读数非常简单:蓝色 - 买入,红色 - 卖出。 颜色越亮,信号越强。 在说明底部查看我们的其他 SolarTrade Suite 产品。 您想自信地驾驭投资和金融市场的世界吗? SolarTrade Suite 金融指标:水星市场指标是一款创新软件,旨在帮助您做出明智的投资决策并增加利润。 SolarTrade Suite 金融指标:水星市场指标的优势: - 准确预测:我们的指标使用先进的算法和分析方法来准确预测市场走势。 获取有关买卖资产最佳时机的信号。 - 用户友好界面:直观的界面将使您能够轻松掌握该程序并在安装后立即开始享受其好处。 您可以从设置中更改线条的颜色、粗细和样式,所有其他设置均自动完成。 - 专家支持:我们
Advance GannAngles MT5
Satya Prakash Mishra
Core Concept: Naveen Saroha's Advanced time and price angles are drawn from significant highs or lows at specific geometric ratios that represent the relationship between price movement and time. The Main Gann Angles and Percentage together Most Important: 1x1 Angle : One units of price for one unit of time  1x2 Angle : One unit of price for two units of time  1x3 Angle 1x4 Angle 1x5 Angle 1x6 Angle 1x7 Angle 1x8 Angle: (45) : Eight unit of price for one unit of time - considered the most i
TrendMaestro5
Stefano Frisetti
note: this indicator is for METATRADER4, if you want the version for METATRADER5 this is the link:  https://www.mql5.com/it/market/product/108106 TRENDMAESTRO ver 2.4 TRENDMAESTRO recognizes a new TREND in the bud, he never makes mistakes. The certainty of identifying a new TREND is priceless. DESCRIPTION TRENDMAESTRO identifies a new TREND in the bud, this indicator examines the volatility, volumes and momentum to identify the moment in which there is an explosion of one or more of these data a
Multi Currency Multi Time Market Scan Signals Multi Currency Multi Time Market Scan Signals (MT5 Dashboard) Unlock Smarter Trading with Real-Time Market Insights Across Multiple Currencies & Timeframes! The Multi Currency Multi Time Market Scan Signals dashboard is your all-in-one solution for MetaTrader 5 , designed to simplify complex market analysis and pinpoint high-probability trading opportunities. Say goodbye to manual chart hopping – this powerful tool scans multiple symbols and timef
Tragos
David Chokumanyara
TRAGOS Indicator – The GOAT of All Trading Indicators TRAGOS (Greek for “male goat”) isn’t just a name — it’s the GOAT: Greatest of All Time in trading indicators. Designed for Forex, Indices, Gold, Crypto, and Deriv Synthetic Indices (Boom & Crash, Volatility 75, Step, Jump, etc.), it gives you non-repainting buy, sell, and exit signals with unmatched clarity. Why TRAGOS? Non-Repainting Signals – 100% reliable. Audible, Email & Push Alerts – Never miss a trade. Trend Following – Rid
Jeslyn MT5
Justine Kelechi Ekweh
這是一個多用途系統,既適合外匯手動交易者,也適合作為黃牛系統或進入非常強勁勢頭的策略、二元期權交易者或由通用 EA 在自動化交易中使用。 Jeslyn頭指示器,但它具有復雜且邏輯的算法。它不會根據其他指標進行計算,而僅根據價格行為進行計算。我找到了一種方法來解釋趨勢、趨勢與動量的差異、背離與成交量價差分析之間的關係。有一些小型的供應和需求區域,其中的頭寸充滿動力,這些是我們在它們開始時想要的地方。他們還說我們無法在 Metatrader 中獲得真實交易量,好吧,我找到了一種方法來獲取它並通過價格動量操縱它。成交量、動量和分歧是這頓飯的秘訣。 Jeslyn頭指示器,但它具有復雜且邏輯的算法。它不會根據其他指標進行計算,而僅根據價格行為進行計算。我找到了一種方法來解釋趨勢、趨勢與動量的差異、背離與成交量價差分析之間的關係。有一些小型的供應和需求區域,其中的頭寸充滿動力,這些是我們在它們開始時想要的地方。他們還說我們無法在 Metatrader 中獲得真實交易量,好吧,我找到了一種方法來獲取它並通過價格動量操縱它。成交量、動量和分歧是這頓飯的秘訣。 我想要一種能夠經受住時間和所有
Viking Strategy Signal Indicator
E Bahamlong Bagoudjare
5 (1)
Viking Strategy Indicator – The Beating Heart of the BT 3.0 System The Viking Strategy Indicator is not just another indicator… It’s one of the pillars of the revolutionary BT 3.0 trading system , built to transform the trading experience for everyone — from beginners to experts . BT 3.0 is much more than a tool: It’s a complete trading solution , both semi-automated and fully automated , integrating 6 powerful indicators and a smart assistant that analyzes, detects, alerts, and executes
IVISTscalp5
Vadym Zhukovskyi
5 (6)
我们向您介绍iVISTscalp5指标,它不仅独特,而且在交易操作中也非常有效。该指标基于时间数据,是多年金融市场经验和深入分析的结果。iVISTscalp5指标是手动交易的优秀工具。便利性、简单性和可视化 - 所有的复杂性都隐藏在内部。我们将iVISTscalp5指标的设置和使用简化到了最大程度。该指标适用于MT5终端中您所拥有的所有金融工具。 操作时间为UTC+3的早上4点到晚上8点。 iVISTscalp5指标菜单(见截图1): History - 计算行情的周数 dT_min - 选择时间间隔的时间(分钟) TFline - 绘制水平成交量(时间帧) BARSline - 绘制水平成交量(条数) TFtrend1 - 绘制日线通道(时间帧) BARStrend1 - 绘制日线通道(条数) TFtrend2 - 绘制周线通道(时间帧) BARStrend2 - 绘制周线通道(条数) ALERT_TIMER - 设置闹钟 ALERT - 开启/关闭闹钟 Save - 开启/关闭将时间记录到文本文件。 图表上的红色和蓝色旗帜表示时间(VIST智能剃须系统的信号)。卖出信号为红旗,买入
Channel Trend Bands – A Comprehensive Indicator for Market Analysis MetaTrader 4 Version Simple to Use, Effective in Application User-Friendly and Suitable for All Traders This indicator stands out due to its straightforward functionality. Whether you're a beginner exploring the market or an experienced trader refining your strategy, this tool offers valuable insights. Using a   Triangular Moving Average (TMA)   with additional   ATR-based bands , it provides structured market data to support w
Reversal ALGO
Muhammad Abdullah Bhatti
Reversal Algo 是一款精心设计的技术指标,旨在帮助交易者识别市场趋势的潜在转折点。通过深入分析历史价格数据,它能够检测可能预示市场动能即将转变的重要高点和低点。该指标在您的图表上提供清晰且明确的视觉信号,使您能够精准定位趋势可能反转的关键区域。Reversal Algo 遵循严格的行业标准,提供客观且可靠的信息,而不做夸大的声明或保证。 主要特点 重要价格检测: Reversal Algo 系统地扫描历史价格数据,以识别标志潜在反转区域的显著峰值和谷值。它优先考虑统计上显著的水平,而非短暂的市场噪音,确保信号既有意义又可靠。 高级噪音过滤: 该指标采用复杂的波动性过滤器,最小化次要价格波动的影响。这种高级噪音过滤机制确保只有重要的价格运动会触发警报,从而减少误报的发生。 可定制参数: 通过广泛的可配置设置,交易者可以调整灵敏度和阈值水平,以根据特定的交易风格和市场条件定制该指标。无论您偏好保守的方法还是激进的策略,Reversal Algo 都可以根据您的个人需求进行微调。 稳健的数据分析: 通过检查广泛的历史价格数据,Reversal Algo 识别出重复的模式和关键水平
The indicator is designed to close positions on the market in time. For example: to take profits ahead of schedule if the price has not reached TakeProfit, and the market is turning around. The indicator analyzes the momentum, not the trend. He does not give any information about the trend. The indicator is well suited for finding divergence. The Ershov 38 Parrots indicator dynamically adjusts to the market and detects price movement impulses of medium and high amplitude. It almost does not rea
Trend Compass MT5
Paul Edunyu Carissimo
Trend Compass: All-in-One Trend Tracking The Trend Compass indicator is a sophisticated yet user-friendly trading tool designed for both novice and experienced traders. By combining multiple technical analysis approaches into one comprehensive package, it eliminates the need for multiple indicators cluttering your charts. Key Features: Multiple analysis modes including VSA for effort/result evaluation Dynamic trailing stops using fractal levels Seven color visualization options for clear market
XCalper TFO
Aecio de Feo Flora Neto
This oscillator was developed exclusively by xCalper in 2015 based on moving averages calculations to indicate and try predicting oversold and overbought levels. The fast line (white, by default) oscillates basically between values -0.5 (oversold) and +0.5 (overbought). Whenever this line crosses upward value -0.5, it means an oversold price level. When it crosses downward value +0.5, it means an overbought price level. When fast line crosses value 0.0 and returns, it is a strong pull-back indic
作者的更多信息
Custom Signal Scanner MT5
Satya Prakash Mishra
Custom Indictor Signal Scanner for scan your own any custom indicator and template its one click you can open your desire signals(given time frame alert). Also can open same template with particular input indicator just type name of template your created with given indicator and enjoy all time frame scan with your logical signals  input string s2 = "====== Embedded Indicator Settings ======"; input UseEmbeddedIndicator = false; // Use embedded indicator instead of external file ( don't use its n
Predictive Levels
Satya Prakash Mishra
Market predictive price levels are key technical analysis tools is my finest invention through mathematics to predict automatically next price is where to reach after break any levels. A unique name quality it automatically calculate price range its my own invention according price value to predict what's is next price came than after it not fixed levels like Fibonacci or pivots Its Naveen's Predictive Levels .used to forecast where an asset's price might find support (stop falling) or resistanc
Core Principles Swing Angle Measurement   Swing angles are calculated by measuring the degree of price movement between swing highs and lows over time. Steeper angles (typically 45+ degrees) indicate stronger momentum and potentially more profitable trading opportunities. Traders use various timeframes to identify these patterns, from intraday charts to weekly swings. Momentum Confirmation   High degree swing angles often coincide with strong momentum indicators like RSI breakouts, volume spikes
Advance GannAngles MT5
Satya Prakash Mishra
Core Concept: Naveen Saroha's Advanced time and price angles are drawn from significant highs or lows at specific geometric ratios that represent the relationship between price movement and time. The Main Gann Angles and Percentage together Most Important: 1x1 Angle : One units of price for one unit of time  1x2 Angle : One unit of price for two units of time  1x3 Angle 1x4 Angle 1x5 Angle 1x6 Angle 1x7 Angle 1x8 Angle: (45) : Eight unit of price for one unit of time - considered the most i
Core Principles Swing Angle Measurement   Swing angles are calculated by measuring the degree of price movement between swing highs and lows over time. Steeper angles (typically 45+ degrees) indicate stronger momentum and potentially more profitable trading opportunities. Traders use various timeframes to identify these patterns, from intraday charts to weekly swings. Momentum Confirmation   High degree swing angles often coincide with strong momentum indicators like RSI breakouts, volume spikes
Circle Maker MT5
Satya Prakash Mishra
Its and Circle drawer for mt4 auto scale can use multiple circles together watch my all videos based on circle get idea how to use and find out reversals of markets. Its my core concept for predict time and price levels using only Circles no other indicator needed to use with circles a complete trading strategy. https://youtu.be/VlSIur-LPUs?si=gDtioQyUtXDDw_fi https://youtu.be/-IGp7F9XINQ?si=Q2DB0qKHKQzpl4bv NOTE :- ECLIPS CENTER POINT TO PLACE HIGH LOW 
FREE
Circle Maker
Satya Prakash Mishra
Its and Circle drawer for mt4 auto scale can use multiple circles together watch my all videos based on circle get idea how to use and find out reversals of markets. Its my core concept for predict time and price levels using only Circles no other indicator needed to use with circles a complete trading strategy. https://youtu.be/VlSIur-LPUs?si=gDtioQyUtXDDw_fi https://youtu.be/-IGp7F9XINQ?si=Q2DB0qKHKQzpl4bv
FREE
Naveen Dynamic Square
Satya Prakash Mishra
The Naveen Dynamic Square is one of the best known  technical analysis tools  inspired  by WD Gann along with the Gann Fan and Gann Box. It is considered a cornerstone of his trading technique that is based on time and price symmetry. The Naveen Dynamic Square is a powerful tool in finance for determining support and resistance levels based on a stock's extreme price points. It works by extrapolating probable price levels from a central value, typically an all-time or cyclical high or low. This
Advance GannAngles
Satya Prakash Mishra
Core Concept: Naveen Saroha's Advanced time and price angles are drawn from significant highs or lows at specific geometric ratios that represent the relationship between price movement and time. The Main Gann Angles: Most Important: 1x1 Angle : One units of price for one unit of time  1x2 Angle : One unit of price for two units of time  1x3 Angle 1x4 Angle 1x5 Angle 1x6 Angle 1x7 Angle 1x8 Angle: (45) : Eight unit of price for one unit of time - considered the most important trend line Co
Advance Gann Grid and Percentage tool is world's first auto scale dynamic grid  created by Naveen Saroha will new unknown features Key Features of Modern Dynamic Gann Grid Real-time Updates : Unlike traditional static grids, dynamic versions automatically adjust as new price data comes in Multiple Timeframe Analysis : Simultaneous calculation across different timeframes Automated Scaling : Software automatically determines optimal price-to-time ratios Interactive Elements : indicator is create 1
High Gravity Reversal signals made by Naveen Saroha a completely new concept using physics universal law of speed and Gravity. Made a simple signals using complex mathematics to match trading concepts. High accurate sell signals and buy potential of reversal of market one of unique invented by core universal laws. We are working on gravity signals since 2019 consistently...high probability reversals with minimal stop losses. 100% Non repainted no legging tools for mt4/mt5 also can use in binary
Gann time and price reversal signals are sophisticated trading concepts developed by Naveen Saroha using  W.D. Gann concepts that focus on predicting market turning points through the confluence of time cycles and price movements. Here are the key elements: Time-Price Balance : Gann famously stated, "When time is up, the market will reverse regardless of the price. This emphasizes that time cycles often take precedence over price levels in determining market reversals. Key Reversal Signals Price
Gann Time Reversal Signals   are sophisticated trading concepts developed by Naveen Saroha using  W.D. Gann concepts that focus on predicting market turning points through the confluence of time cycles and price movements. Here are the key elements: Time-Balance : Gann famously stated, "When time is up, the market will reverse regardless of the price. This emphasizes that time cycles often take precedence over price levels in determining market reversals. Key Reversal Signals Price-Time Confluen
Market Turning Forecast
Satya Prakash Mishra
New idea for market turning forecasts and Swing High degree angle by Geometric and Gann methods. Developed by Naveen Saroha in 2019. to find time and angular forecaster for market direction to reversal/swing. Tool shows time vertical line on chart. Using geometric and mathematical equation to define next turning probability of market  Market swing turning points Technical analysis forecasting Trend reversal predictions
Dynamic Andrew's Pitchfork A technical analysis tool that uses three parallel trendlines to identify potential support and resistance levels. Created by selecting three significant pivot points (two lows and one high, or two highs and one low), then drawing: Median Line : The central line connecting the first point to the midpoint between the second and third points Upper Parallel : A line parallel to the median line, passing through the highest of the second two points Lower Parallel : A line p
Mac-Binary option Signals is unique mathematical concept to trade iqoptions,binary,rocketoptions specter or any other binary options company 1 min 5 expiry run robot 30min everyday and fill profit and loss ratios inside mt2iq/mt2binary and run or 1min to 5min expiry ...go to setting in mt2iq robot allow otc and digital options. and select risk 500and profit 300$ per day it can stop automatically after profit or loss... If it can close after loss restart and Reset profit and loss button run again
Dynamic Gann Box MT4
Satya Prakash Mishra
What is a Dynamic Gann Box? The Dynamic Gann Box, Designed by Mr Naveen Saroha its and  World first in class. World's First auto scale  mt4/mt5 Geometric tools... no matter screen sizes and resolutions its automatically check chart scale with different time and different trading assets like commodities and stocks futures and options.... also known as the Gann Square, is a more complex tool that combines price and time in a squared framework based on W.D. Gann's belief that market movements are
Gann Dynamic square MT4
Satya Prakash Mishra
The Naveen Dynamic Square  MT4 Lite. is one of the best known  technical analysis tools  inspired  by WD Gann along with the Gann Fan and Gann Box. It is considered a cornerstone of his trading technique that is based on time and price symmetry. The Naveen Dynamic Square MT5   is a powerful tool in finance for determining support and resistance levels based on a stock's extreme price points. It works by extrapolating probable price levels from a central value, typically an all-time or cyclical h
High Low Reversal
Satya Prakash Mishra
High low Reversal concept by Naveen saroha to find out new tops and new bottoms through mathematical calculations also can get with own calculation inputs available to increase or decrease swing potential,also can use  auto analysis function to calculate  Parameters swing heights and swing percentages. Indicator can apply all time frame and all types of market symbols..... """High-Low Market Signals Overview High-low market signals are technical indicators that analyze the relationship between r
Custom Indictor Signal Scanner for scan your own any custom indicator and template its one click you can open your desire signals(given time frame alert). Also can open same template with particular input indicator just type name of template your created with given indicator and enjoy all time frame scan with your logical signals  What is a Custom Indicator Scanner for MT4? A custom indicator scanner is an Indicator  or script that automatically scans multiple currency pairs and timeframes for
Day High Low Scanner
Satya Prakash Mishra
A day high low scanner is a stock screening tool that helps traders and investors identify stocks based on their daily price movements, specifically focusing on stocks that are hitting new highs or lows within a trading day. Here's how it typically works: Day High Scanner: Identifies stocks that are trading at or near their highest price of the current trading day Shows stocks with strong upward momentum Helps traders spot potential breakout opportunities or stocks with bullish sentiment Day Low
Core Concept: Naveen Saroha's Advanced time and price angles included percentages to find out right time and price equations   are drawn from significant highs or lows at specific geometric ratios that represent the relationship between price movement and time. The Main Gann Angles and Percentage together Most Important: 1x1 Angle : One units of price for one unit of time  1x2 Angle : One unit of price for two units of time  1x3 Angle 1x4 Angle 1x5 Angle 1x6 Angle 1x7 Angle 1x8 Angle: (45)
Multipair Range Percentage Levels Scanner - Technical Description Overview A Fibonacci levels scanner is a technical analysis tool that automatically identifies and plots key Fibonacci retracement and extension levels across multiple financial instruments or timeframes. It helps traders quickly locate potential support and resistance zones based on mathematical relationships derived from the Fibonacci sequence. Core Functionality Automatic Level Detection The scanner identifies significant pric
WD Gann Swing Trading & Market Calculation Mathematics: Decoding the Master's Geometric Approach to Market Prediction Introduction William Delbert Gann (1878-1955) stands as one of the most enigmatic and successful traders in financial history, developing a sophisticated mathematical framework that combined geometry, astronomy, and natural law to predict market movements. His theory was based upon natural geometric shapes and ancient mathematics. Gann theory states that the patterns and angles o
Naveen Dynamic Square MT5
Satya Prakash Mishra
The Naveen Dynamic Square  MT5  is one of the best known  technical analysis tools  inspired  by WD Gann along with the Gann Fan and Gann Box. It is considered a cornerstone of his trading technique that is based on time and price symmetry. The Naveen Dynamic Square MT5   is a powerful tool in finance for determining support and resistance levels based on a stock's extreme price points. It works by extrapolating probable price levels from a central value, typically an all-time or cyclical high o
Advance Gann Grid and Percentage tool is world's first auto scale dynamic grid  created by Naveen Saroha will new unknown features Key Features of Modern Dynamic Gann Grid Real-time Updates : Unlike traditional static grids, dynamic versions automatically adjust as new price data comes in Multiple Timeframe Analysis : Simultaneous calculation across different timeframes Automated Scaling : Software automatically determines optimal price-to-time ratios Interactive Elements : indicator is create 1
High Gravity Reversal signals made by Naveen Saroha a completely new concept using physics universal law of speed and Gravity. Made a simple signals using complex mathematics to match trading concepts. High accurate sell signals and buy potential of reversal of market one of unique invented by core universal laws. We are working on gravity signals since 2019 consistently...high probability reversals with minimal stop losses. 100% Non repainted no legging tools for mt4/mt5 also can use in binary
New idea for market turning forecasts and Swing High degree angle by Geometric and Gann methods. Developed by Naveen Saroha in 2019. to find time and angular forecaster for market direction to reversal/swing. Tool shows time vertical line on chart. Using geometric and mathematical equation to define next turning probability of market  Market swing turning points Technical analysis forecasting Trend reversal predictions
Equilateral Triangle MT5
Satya Prakash Mishra
Equilateral triangle trading strategy , which is a technical analysis pattern used in financial markets. To finding reversal of market see my analysis vides based on tringles only a complete tool for trading. An equilateral triangle is a triangle that has three equal sides. It is a special case of an   isosceles triangle   in the modern definition, stating that an isosceles triangle is defined at least as having two equal sides. [ 1 ]   Based on the modern definition, this leads to an equilatera
Mac-Binary option Signals is unique mathematical concept to trade iqoptions,binary,rocketoptions specter or any other binary options company 1 min 5 expiry run robot 30min everyday and fill profit and loss ratios inside mt2iq/mt2binary and run or 1min to 5min expiry ...go to setting in mt2iq robot allow otc and digital options. and select risk 500and profit 300$ per day it can stop automatically after profit or loss... If it can close after loss restart and Reset profit and loss button run again
筛选:
无评论
回复评论