 MetaTrader 5
 Эксперты
 Индикаторы
 Библиотеки
 Утилиты
 Виджеты
 Правила
Смотри обучающее видео по маркету на YouTube
Как купить торгового робота или индикатор
Запусти робота на
виртуальном хостинге
виртуальном хостинге
Протестируй индикатор/робота перед покупкой
Хочешь зарабатывать в Маркете?
Как подать продукт, чтобы его покупали
Бесплатные технические индикаторы для MetaTrader 5 - 73
 На основании сигналов технических индикаторов принимаются решения относительно открытия или закрытия сделки на фондовом и форекс-рынках. Суть индикаторов заключается в математическом преобразовании цены и/или объемов финансового инструмента для прогнозирования изменений цен в будущем.
Протестируйте технические индикаторы, чтобы лучше предсказывать поведение рынка и зарабатывать на этом.

Indicador Regressão Linear – Par de Ativos Indicador é um oscilador que faz o plot do Resíduo resultado da regressão linear entre os dois ativos inseridos como input do indicador, representado pela fórmula: Y = aX + b + R Onde Y é o valor do ativo dependente, X é o valor do ativo independente, a é a inclinação da reta entre os dois ativos, b é a intersecção da reta e R é o resíduo. O resíduo representa a quantidade da variabilidade que Y que o modelo ajustado não consegue explicar. E os resíduos
FREE

Consecutive candles can give us an indication as to the strength of a trend. With this indicator, you can set the number of consecutive bull or bear candles you wish to be present before achieving a valid signal of RSI crossing into overbought or oversold. With this information, you can better judge if a continuation or reversal situation is about to present. RSI has two settable levels
Interesting settings: Number of consecutive candles needed before a valid signal Overbought level of RSI Over
FREE

Индикатор MAPC (Moving Average Percent's Change) показывает процентное изменение скользящей средней от одного периода к другому выбранному периоду и позволяет отслеживать сглаженный темп изменения цены. Индикатор MAPC рассчитывается по формуле: MAPC[i] = 100 * (MA[i] - MA[i - n]) / MA[i], где: MA[i] - текущее значение скользящей средней; MA[i - n] - значение скользящей средней, отстоящей на n периодов от текущего значения скользящей средней.
Входные настройки Period - период скользящей средн
FREE
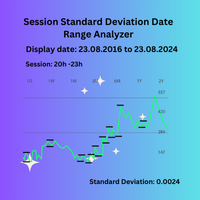
Session Standard Deviation Date Range Analyzer: Evaluate the standard deviation of each bar's price (high, low, close, open, weighted, median, and typical) within defined trading sessions and date ranges, providing detailed insights into price volatility and market behavior. **Note:** When the trading platform is closed, the indicator may not load correctly. To ensure it works, you may need to load the indicator, unload it, and then load it again. **Note:** : This indicator can only be used wit
FREE

Представляем индикатор “Информация о Стоимости Символа” – ваш незаменимый инструмент для поддержания лидерства на рынке форекс! Этот инновационный индикатор создан для того, чтобы обеспечить трейдеров информацией о реальной стоимости в режиме реального времени, непосредственно на их графиках. Вот почему каждому трейдеру необходим индикатор “Информация о Стоимости Символа” в его арсенале: Мониторинг Спреда в Реальном Времени: Внимательно следите за спредом любой валютной пары, чтобы входить на р
FREE

This is a tool to estimate your probability of bankruptcy. features. estimate a probability of bankruptcy (Nauzer J. Balsara) from your trade history usually, it is small print and never interfere with trades alert in large prints and color when it exceed the alert level you can set parameters(i.e. winning ratio) fixed and simulate freely *1: this value is for reference only and is not guaranteed to occur.
FREE

The Bull DCA SP500 Signal – WinWiFi Robot Series (Indices, Energy & Forex) Overview: Elevate your trading precision with the latest indicator from the WinWiFi Robot Series . Designed specifically for high-volatility markets like Global Indices, Energy, and Forex, "The Bull DCA SP500 Signal" helps you filter out market noise and capture major trends on the H4 timeframe . Whether you are scalping for a breakout or swing trading for long trends, this tool provides clear visual signals to simplify
FREE

Adaptive Momentum Oscillator (AMO) – Next-Gen Momentum Indicator Overview The Adaptive Momentum Oscillator (AMO) is a powerful technical analysis tool that dynamically adjusts its sensitivity to market conditions by incorporating adaptive lookback periods, noise filtering, and normalization techniques . Traditional momentum indicators use fixed lookback periods, which can lead to inefficiencies in trending and ranging markets. The AMO overcomes this limitation by adapting its calculation based o
FREE

Composite Force Index (CFI) – Multi-Dimensional Trading Indicator CFI [ Core Features ] 4-Dimensional Analysis combining: Quantum Temporal Flux (Price Dynamics) Chaos Index (Volatility Mapping) Harmonic Patterns (Cyclical Structures) Force Index (Volume + Momentum Fusion) Adaptive Logic including: Dynamic weighting based on market conditions Auto-adjusting signal threshold ( adaptive_sensitivity ) 3-bar statistical validation ( ValidateSignal ) Professional Visuals : 3-color histogram (B
FREE
NewTest https://backoffice.aurum.foundation/u/DHXP1U
Индикатор DuettoFXTompson создан для работы с двумя инструментами у которых высокий уровень корреляции, индикатор можно использовать для парного трейдинга по валютам, акциям, и др. финансовым инструментам. Индикатор показывает момент расхождения инструментов и сумму двух инструментов ( желтая линия), дополнительно рассчитывается параметр Среднего значения МА. Рекомендуемый таймфрейм для работы М5. Контакты для связи 777basil@mail.ru
FREE

MultiTimeAnchor MA — ваш новый помощник для умного и удобного анализа рынка! Этот бесплатный индикатор отображает три различных скользящих средних , каждая из которых настроена на уникальный временной период. Это значит, что вы можете видеть, как ведет себя рынок в короткосрочной, среднесрочной и долгосрочной перспективе — всё одновременно, без необходимости переключаться между графиками. Вы можете выбрать один из нескольких типов скользящих средних, таких как простая скользящая средняя, экспоне
FREE
If your strategy requires trading during a certain period of market activity - calm or turbulent, this indicator will help you find such periods of time within a week for each currency pair using statistics.
The principle of the indicator is quite simple.
The entire trading week, from Monday 00:00 to Friday 23:59, is divided into timeslots, the duration of which corresponds to the current timeframe.
For each timeslot, activity is calculated - the average value of the difference between the slow
FREE

////////////////////////////////////////////////////////////////////////////////////
Улучшенная версия стандартного индикатора Average True Range.
Теперь это адаптивная и сглаженная линия.
Настройка не совсем простая - но я надеюсь что вы справитесь. Понять показания этого индикатора очень просто, смысл такой же как и у стандартного Average True Range.
/////////////////////////////////////////////////////////////////////////////////////
Надеюсь этот индикатор очень Вам пригодится в успешно
FREE

Trader’s Cockpit is a simple non directional dashboard for MetaTrader 5 designed to give traders a quick, clear view of their trading environment directly on the chart. Creator: https://www.quant-atlas.com/ The indicator does not generate buy or sell signals, does not predict market direction, and does not perform any trading action. Its purpose is to make the trader’s daily workflow easier by centralizing useful account, symbol, spread, session, and broker condition information in one compact
FREE
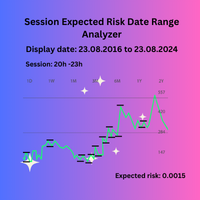
Session Expected Risk Date Range Analyzer: Analyzes price data across specified date ranges to provide detailed insights into financial risk and volatility, using each bar's price metrics for accurate risk assessment.
The Session Expected Risk Date Range Analyzer is a sophisticated tool designed to offer traders and analysts detailed insights into the expected financial risk across specific date ranges. Unlike traditional session-based analysis, this indicator focuses on calculating risk metr
FREE

This indicator shows the strength of each currency compared to the US dollar by calculating the rate of change in price over a specified time period. When you open the indicator, you'll see a list of different currencies on the price chart. Each currency will have a numerical value indicating its strength level compared to the US dollar, where: If the value is higher than the US dollar, it will be displayed in green, meaning that currency is stronger than the dollar. If the value is lower than t
FREE
Description: Candle Time is a simple and effective tool that shows the remaining time until the current candle closes — directly on your chart. Whether you’re trading fast moves or waiting for confirmations, knowing exactly when the candle ends helps you stay sharp. Main Features: Real-time countdown for the current candle Color adapts to candle direction (bullish, bearish, or neutral) Adjustable font, size, color source, position, and thickness Supports Visual Mode in the Strategy
FREE

The forex spread is the difference between a forex broker's sell rate and buy rate when exchanging or trading currencies . Spreads can be narrower or wider, depending on the currency involved, the time of day a trade is initiated, and economic conditions.
Forex Spread WatchDog :
This Forex indicator ensures that you are getting the best spreads while trading, and guards against broker spread widening.
FREE

Automate Your Strategy! Use the Daily Drop Analyzer Expert Advisor to automatically execute the strategy, with configurable filters, parameters, and order management.
Check it out here: Daily Drop Analyzer EA
The Step Analysis Indicator performs an automated backtest of a simple daily strategy: buy when the price drops a certain percentage from the previous close and sell at the same day's close (or vice versa for short strategy). It tests multiple entry percentages ("steps") and displays the
FREE

Smart Watermark Displays current symbol + timeframe Shows account name (or custom text) Customizable font/color/position One-Click Tools Timeframe Switcher: Quick-access buttons (M1 to D1) Drawing Tools: Create horizontal lines, trendlines, and Fibonacci retracements with consistent sizing Object Cleanup: "Delete" button removes all indicator-created drawings Pips Meter Real-time P/L tracking in pips Color-coded (green/red) for profit/loss Supports magic number filtering Chart Zoom Contro
FREE

CyberLab Goal Matrix is a premium, single-chart risk intelligence panel engineered for MetaTrader 5. Built specifically for disciplined manual traders, this institutional-grade workspace completely eliminates the need to constantly cycle between multiple timeframes. It streams macro-momentum trend direction while executing real-time position scaling, friction calculations, and target mapping directly onto your active execution screen.
--- THE REALITY OF TRANSACTION FRICTION --- Many retail
FREE

This ForexTrading Sessions indicator is a powerful visual tool for MetaTrader 5 that highlights the three major forex trading sessions (Asian, London, and New York) on your chart with the Asian Mid-line. 1. Trading Session Visualization Asian Session : 00:00 - 09:00 GMT (blue/aqua color) London Session : 08:00 - 17:00 GMT (magenta color) New York Session : 13:00 - 22:00 GMT (orange color) 2. Time Zone Adaptation TimeZoneShift input allows you to adjust sessions to your local time Example:
FREE

Aquí está la descripción lista para copiar en el Marketplace de MetaTrader: JGFX Funded Account Dashboard A real-time monitoring panel designed specifically for traders using funded/prop trading accounts . Keep full control of your key metrics at a glance — without leaving your chart. What it does The dashboard floats over your chart and continuously tracks the health of your funded account, showing you exactly where you stand relative to your drawdown limit and profit target — so you never g
FREE

High and Low
The indicator marks bars with a simple trend definition“ each subsequent high above/below the previous one and each subsequent low above/below the previous one ”. Charles Dow
Formula:
Max – The current maximum Min – The current minimum MaxK – Maximum per period MinK – Minimum per period
Min>MinK & Max>=MaxK – Symbol on top Max<MaxK & Min<=MinK – The symbol on the bottom
Input parameter:
Number of bars in the calculated history Period for current timeframe The distance to th
FREE

Монитор риска портфеля — это простой и мощный инструмент для отслеживания подверженности портфеля риску и остатка денежных средств в MetaTrader 5.
Индикатор показывает: • Общий баланс счета • Сумма, инвестированная в позиции на покупку (акции) • Остаток денежных средств (свободный капитал) • Процент использования портфеля • Процент денежных средств • Количество открытых позиций на покупку • Статус риска с цветовой индикацией
Индикатор предназначен для трейдеров, которые активно управляют порт
FREE
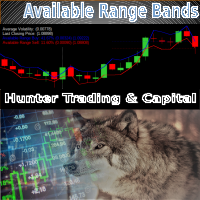
The Available Range Bands Technical Indicator draws two lines on the chart indicating the maximum limits (bands) expected for buying and selling for the current period (candle). These limits can be accessed by buffers 0 and 1 respectively.
In addition, it displays in the lower right corner the current average values of the real volatility, the last price, the predicted range of movement available for buying (% and points) and the predicted range of movement available for selling (% and points)
FREE
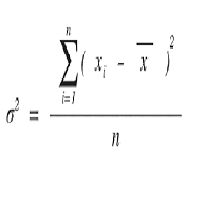
Calculate the Variance of prices on the chosen time frame and compare with the price range reached. Or in other words how mutch is price moving in the recent candles? Two impots: Candle = 4 (Default) number of previous candle to calculate Backward = 500 (Default) How many candle to go backward
Variance is calculated as follow: Variance(X) = Average(X 2 ) – [Average(X)] 2
Subsequently Variance is rapported to the price range fo the chosen period (i.e. 4 candles) Indicator = Variance(X) / (Ma
FREE

The one minute chart has a bug, but the one-day chart can still be used after deleting the bug and reloading the indicators, This indicator can be used to determine how far the indicator goes up to place an order to buy, how far it goes down to place an order to sell, and not placing an order until it reaches this distance, which is considered oscillation, open an account gift index
FREE

Пользовательский индикатор Bollinger Bands Height - высота полос Bollinger Bands.
Показывает текущее состояние индикатора Bollinger Bands: полосы удаляются друг от друга или полосы начинают сближаться.
Сжатие - сближение полос, означает, что текущий движение рынка ослабевает и указывает на скорое начало нового сильного движения.
Значит нужно искать удачный момент для входа в позицию, так как можно ожидать резкое изменение цены.
Наиболее эффективен в работе с другими трендовыми индикаторами.
FREE

A custom indicator that displays a real-time countdown showing how much time remains before the current candle closes and the next one opens. Equipped with a 10-second audio countdown , providing a visual–auditory reminder so traders don’t miss critical moments before a candle closes and can execute decisions with precision. Highly useful for traders who rely on precise timing whether for entries, exits, or analyzing momentum that forms exactly at candle open and close.
FREE

RXTL indicator Indicator is based on ATR to calculate trend and direction bias Works on all timeframes
Required for the other EA to work accordingly Download and ensure it is placed in the Indicator folder Do inbox me for any questions
installing instructions 1) Download RXTL indicator 2) If indicator does not appear, refresh indicator tab 3) Drag indicator to active chart 4) Use it alongside with other EA
FREE

The Pipsurfer Strategy indicator is designed to help traders identify trend-based trades by leveraging momentum confirmations within the market structure. It works by detecting key pullbacks and providing entry signals after a confirmed market retracement , ensuring you only enter trades with the highest probability of success. Perfect for traders looking to capitalize on trending markets, this tool simplifies your decision-making process and helps you stay on the right side of the trend. Whethe
FREE

Sometimes swaps are hidden for certain financial instruments , hence incurring unprecedented costs over night. The need to uncover hidden swap costs is vital for profitable trading. With that being said, this expert indicator helps the trader to uncover the hidden swap costs.
Features chart objects with text short and long trade swap plug and play
Advantages uncover hidden swaps plug and play, no other configurations are needed to use it. usable on all charts and symbols swaps can be easily s
FREE

3 Moving averages crossover , with customizable Notifications and pop ups. Comment for any ideas. Its a demo version , could use some work, hope you at least find it useful. Hit me up with anything or any ideas you feel might be helpful and i will try and add them in if i get the time. Thank you. This version is free as of now . I can't promise anything about the future. But enjoy and have fun. Truly PVRPLE BLVCK. PS don't forget to share and like.
FREE

ForexBob Candle Timer Is an amazing countdown time indicator which shows the time remaining for next candle to open. It can be used on any timeframe. It helps to plan your next trading action.
Inputs are simple Color - To change the color of displaying time. Size - To set the size of font Next for settings are used to set the location of time Font - To change the font type.
Please check my other products here https://www.mql5.com/en/market/my
FREE

Не каждый сам может написать индикатор. Но у кого угодно может возникнуть идея. Реализовать её самостоятельно поможет индикатор Universal Separate Window Free MT5 , принимающий в качестве входного параметра формулу, по которой и будет рисоваться линия индикатора. Данный индикатор предназначен для использования в дополнительном окне графика.
Все индикаторы серии Universal :
В главном окне В дополнительном окне Бесплатные МТ4 Universal Main Window Free МТ5 Universal Main Window Free MT5 МТ4 Univ
FREE

Индикатор имеет всего один параметр - это количество баров для анализа.
Индикатор рассчитывает статистику, когда рынок шел вниз, когда наверх, количество баров для каждого движения.
Из этих данных высчитывается средний показатель количества баров, который вырисовывается в окне индикатора.
Если значения индикатора резко понижается, то рынок готовится к движению наверх.
Если значения индикатора долго держится на высоких значениях, то рынок готовится к снижению.
FREE
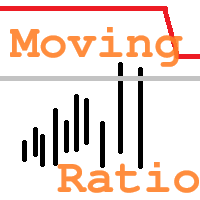
"Moving Ratio Candle" is used to check the distance of a candle to a theoretical pressure point. Furthermore, we have two points of interest, the first for the mean and the second for the median. This indicator uses the shape of bars and the line that crosses the bar from left to right is based on the calculation of the closing price for both sides. The rest follows a more standard calculation. The same could be done as a line, but I want to know the behavior of this indicator in relation to the
FREE
Этот индикатор собирает и систематизирует данные о спреде. Его код был отпрофилирован несколько раз и оптимизирован таким образом, чтобы несмотря на наличие графики не тормозить работу терминала МТ5. Кроме того в индикаторе предусмотрен режим полной невидимости (при этом индикатор продолжает собирать данные и сохранять их). Вернувшись в режим визуального отображения можно посмотреть проделанную им работу. Преимущества и возможности индикатора SpreadFix: 1. Собирает данные по максим. дневным сп
FREE

This indicator helps keep track of the number of trades taken in the day. It shows losses and potential profit then the total profits which is, profits - losses. Then total profit for the week and month. Soon the indicator will be sharing some trading tips based on your trading. It really does put necessary pressure and helps you to set a goal for yourself for the day. Familiarise yourself to draw your analysis on the same chart with the indicator because it will have to alert you if price brok
FREE
The Choppery notifier is an indicator that has been developed and tested for the purpose of alerting you that a candle is about to form, it takes away the trouble of having to play a guessing game as to when next a candle will form after a trend, therefore most of the time it eliminates the thought of having to predict which direction price will begin to move at. This indicator can be used in any timeframe, a notification will be sent out to you via email when price moves. you can start at a min
FREE

This indicator displays the Daily Range of a selected pair directly on your chart, providing a clear and concise view of the pair’s movement for the day. It simplifies tracking how far a pair has moved, offering traders a practical advantage in analyzing market activity. This feature is especially useful for making faster and more accurate trading decisions. Whether you’re a beginner or an experienced trader, it helps streamline your strategy by highlighting key market insights in real-time.
FREE

Product name Rilvanta RSI PrimeSuite
Short headline A pure RSI professional suite for overbought/oversold context, regular and hidden divergence, failure swings, RSI structure and multi-timeframe RSI alignment.
Overview Rilvanta RSI PrimeSuite is a pure RSI analysis indicator designed for traders who want a complete RSI-based view without mixing in unrelated trend, volume, VWAP, ATR, Bollinger, SMC, ICT or moving-average filters. The indicator focuses on the core tools that make RSI useful: o
FREE
Индикатор отображает изменение баланса В правом нижнем углу окна.
Отображаются следующие периоды Сегодня Вчера 3 дня Неделя 10 дней Месяц 3 месяца Полгода Год Все время Есть возможность выставить расчетное время. Удобно пользоваться для расчетов прибыли/убытков с определенного часа.
Будет полезен например ночным скальперам. Данные совпадают с расчетами отчета в терминалее.
FREE

Table Royale — Product Description The best traders know how to wait. The smartest ones know how to stay busy in the meantime. Table Royale turns your MetaTrader into a trading floor… and a gaming table. An elegant panel, a 52-card deck, and 25,000 € in virtual chips to spice up your idle hours. Hit, stand, double down — real Black Jack, right inside your chart. Available in 7 languages: Français · English · Español · Italiano · Deutsch · 日本語 · 中文 30-second set
FREE
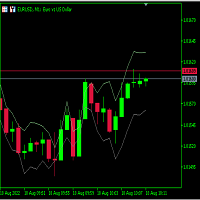
Just learning how to create an indicator from this tutorial .
its just a garbage text to fill the descriptions. Hello there. Hello there Hello there Hello there Hello there Hello there Hello there Hello there Hello there Hello there Hello there Hello there Hello there Hello there Hello there Hello there Hello there Hello there Hello there Hello there Hello there
FREE

Привет. Сегодня представляем индикатор корреляции - SynchroWindowTomson. Индикатор в одном окне показывает движение нескольких инструментов, по отношению друг к другу, удобно определять направление и изменение, особенно когда вы работаете с целым портфелем разных инструментов и нужно определить какой из них тянет результат назад и движется в другую сторону. Так же видны точки разворота спреда.
FREE

Here our more valuable tools
SMC Trend Trading , Easy SMC Trading , Institutional SMC Architect Volume Analysis Tools , Volume flow Profile , Market volume profile , FVG with Volume , Liquidity Heatmap Profile , Volume Spread Analysis
The Trading Guide MT5 Indicator is a powerful psychological trading assistant designed to keep traders disciplined, focused, and emotionally balanced. This innovative indicator displays real-time motivational messages, trading rules, and analysis
FREE

If you like this product, please give it a 5 star rating as a token of appreciation.
This indicator plots horizontal lines on the chart representing the previous year’s high and low prices . These levels are widely used in technical analysis as major support/resistance references.
Automatically identifies the previous calendar year’s high and low . Plots horizontal lines on the chart at these levels. Customizable color, width, and style of the lines. Deletes lines on deinitialization. Updates
FREE
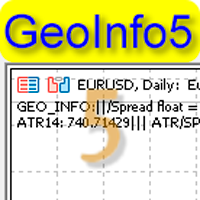
GeoInfo5 - один из наиболее информативных индикаторов, в компактном виде отображает основную информацию о торговом инструменте.
Версия для терминала МетаTrader 4 приобрела широкую популярность среди трейдеров.
Индикатор бесплатный и всегда будет бесплатным.
Теперь доступна стартовая версия и для MetaTrader 5. выводит в строку в левом верхнем углу графика в кратком виде информацию об основных параметрах инструмента: Спред, Своп для ордера Buy, своп для ордера Sell, текущий спред, залог (маржу)
FREE
Quickview The Quickview indicator instantly highlights asset variations, delivering crystal-clear market insights at a glance. Effortlessly track multiple assets with visual simplicity, enabling quicker, smarter, and more confident trading decisions daily. ️ Key Features Real-Time Asset Tracking: Instantly monitor multiple assets simultaneously, never missing a critical market move. Flexible and Intuitive Display: Personalize your view, displaying assets exactly as you want—clear, concise, c
FREE

Aureon StrataCore SMC
Overview Aureon StrataCore SMC is a MetaTrader 5 chart-context indicator designed to organize Smart Money Concepts into a clean visual framework. It displays swing structure, BOS/CHOCH events, liquidity zones, order block zones, premium/discount range context and optional closed-bar entry arrows. The indicator is a decision-support tool and does not trade automatically.
Key Features - Closed-bar swing high and swing low detection using configurable pivot depth. - Bullish
FREE

Aurexon DriftWave EMA
MetaTrader 5 Custom Indicator Overview
Aurexon DriftWave EMA is an EMA-based chart context indicator for MetaTrader 5. It is designed to give traders a clear visual overview of trend direction, impulse behavior, and volatility boundaries directly on the price chart. Instead of relying only on arrow signals, the indicator displays EMA lines, EMA cloud, ATR volatility rails, and optional closed-bar Buy/Sell confirmation arrows. Key Features Fast EMA impulse line Slow EMA t
FREE

TS Time Remaining - Indicador de Cuenta Regresiva para Velas en MetaTrader 5 El TS Time Remaining es un indicador gratuito diseñado para la plataforma MetaTrader 5 que permite a los traders visualizar en tiempo real el tiempo restante de la vela actual. Esta herramienta es especialmente útil para aquellos operadores que trabajan con estrategias basadas en la acción del precio y patrones de velas japonesas, ya que les permite anticiparse al cierre de la vela y tomar decisiones con mayor precisión
FREE

On Off Trade On Off Trade — это индикатор для MetaTrader 5, который выводит прямо на график статус рынка и расписание торговых сессий. Возможности: Показывает, открыт ли рынок сейчас ( СТАТУС: РЫНОК ОТКРЫТ / ЗАКРЫТ ). Отображает активную торговую сессию: время начала и окончания. Если рынок закрыт — указывает, когда начнётся следующая сессия. По желанию можно включить полное расписание всех сессий на неделю с подсветкой текущего дня и активной сессии. Автоматическое обновление данных кажды
FREE

Display the date, time and price according to the movement of the mouse cursor on the chart This is useful for discretionary trading.
It is an indispensable tool for verifying and studying past market prices and trades. Characteristic Date,Time and Price are displayed.
The value follows the movement of the mouse.
You can change the color of the text. Please refer to the video on youtube. For MT5 only.
FREE

HighVolume SR Boxes is a professional support and resistance zone indicator designed to identify important price areas using confirmed pivot structure and volume-based filtering. Instead of drawing simple horizontal lines, the indicator highlights market zones as dynamic boxes, helping traders see where price has previously reacted with meaningful volume participation. These zones can be used to observe potential reversals, breakouts, retests, and role-reversal behavior between support and resis
FREE

Индикатор Order Box для MetaTrader 5 Визуальное управление сделками стало простым Превратите свой торговый график в наглядное представление ваших активных позиций с помощью индикатора Order Box. Этот мощный инструмент MT5 автоматически рисует цветные прямоугольники между ценой входа и уровнями Stop Loss/Take Profit, давая вам мгновенное визуальное понимание зон риска и прибыли. Основные функции Автоматические визуальные блоки Зеленые блоки для зон Take Profit - мгновенно видите потенциал приб
FREE

IDNR4 — Indicator Description (English)
The IDNR4 (Inside Day Narrow Range 4) is a volatility-compression pattern that identifies potential breakout conditions. It combines two concepts: NR4 (Narrow Range 4)
The current bar has the smallest high–low range compared to the previous three bars. Inside Bar (ID)
The current bar’s high and low are fully contained within the range of the previous bar. Signal Logic
• When the bar is NR4 only , it is highlighted as a normal contraction pattern.
• Wh
FREE

Прекратите гадать. Начните торговать с точностью.
QTS Super Hybrid Platinum — это не просто индикатор; это полноценная торговая система, разработанная для скальперов и внутридневных трейдеров, которым важны точность и безопасность. Сочетая мощь институционального анализа ценового движения (SNR) с трендовым импульсом (тройная EMA), этот инструмент отфильтровывает рыночный шум, предоставляя вам только высоковероятные торговые возможности.
Почему именно QTS Super Hybrid Platinum? Мы создали этот
FREE

Nebryx BandPulse Matrix Professional Bollinger Bands Volatility Context Indicator for MetaTrader 5
PRODUCT OVERVIEW Nebryx BandPulse Matrix is a clean volatility-context indicator built around Bollinger Bands. It is designed for traders who want more than a standard band overlay. The indicator combines classic Bollinger Bands with volatility squeeze detection, expansion confirmation, band-walk trend context, stretch/overextension markers, and a compact chart status label.
The product focuses
FREE

Trend Regime Line Version 1.1 · algoteknik What This Indicator Is Trend Regime Line reads the trend through a triad: three Larry Williams tools that each answer their own question, and one line on the price chart that is coloured only when the answers fit together. Williams %R says which side price is thrusting to, the Ultimate Oscillator whether momentum confirms that side, and Williams Accumulation/Distribution whether buying or selling pressure still backs it. Green means the triad agrees on
FREE

QCL Momentum Candles — MT5 See momentum changes through a clear, candle-based oscillator. QCL Momentum Candles converts smoothed Stochastic RSI values into synthetic momentum candles in a separate indicator window. Green and red candles help you follow shifts in momentum, while a centered scale and highlighted extreme zones provide context for your chart analysis. Main Features Synthetic momentum candles: View oscillator movements as candle bodies and wicks. Directional colors: Green candles ind
FREE

RSI Flow Candles MT5 QCL RSI Flow Candles transforms RSI momentum into smoothed Heikin Ashi-style candles in a separate indicator window. Its candle structure, adaptive trend line and reference zones help traders assess momentum direction, pullbacks and transitions within a familiar 0–100 oscillator scale. Key Features RSI-based candles: View momentum through candle bodies and wicks instead of a conventional RSI line. Directional colors: Green candles indicate that the oscillator close is at or
FREE

Fx Gamma Profile - see where the options market is positioned, directly on your MetaTrader 5 chart. Fx Gamma Profile turns an options-chain file into a gamma-exposure (GEX) map and draws it beside price: a bar for every strike, the call wall, the put wall and the zero-gamma level, plus a status panel that explains in plain words what the numbers imply. It is a decision-support tool for discretionary traders who want options-market context for FX pairs. READ BEFORE YOU BUY - THIS INDICATOR NEE
FREE

Elsna SuperTrend is a standard SuperTrend trend-following indicator, drawn as a line on the main chart. How it works: it takes the midpoint of each bar, (high + low) / 2, and adds and subtracts the ATR (14 periods by default) times a multiplier (3.0 by default). That gives an upper and a lower band. Each band only moves toward price and never away from it, which makes them “ratchet”. What you see: Green line, below price: bullish trend. It follows the lower band and works like a trailing stop. R
FREE

Elsna Horizontal Lines is a chart indicator. It draws a grid of evenly spaced horizontal price levels across your chart, so you can see fixed-distance levels at a glance. It’s useful for grid trading, spotting support and resistance zones, and measuring price moves in pips. How it works You set the distance between lines in pips, and the indicator draws a line at every step across the visible price range. The pip size adjusts automatically for 3- and 5-digit brokers. The grid begins at a startin
FREE

Angle Channel Detector: найдите самые крутые трендовые участки без шума на графике
Angle Channel Detector анализирует цену с помощью линейной регрессии и рисует чистый канал ТОЛЬКО тогда, когда его наклон превышает заданный вами минимальный угол. Никакого визуального мусора и накладывающихся друг на друга линий: каждый канал представляет собой прямой отрезок с двумя параллельными полосами и пунктирной средней линией.
ЧТО ОН ПОКАЗЫВАЕТ
Бычьи (зеленые) и медвежьи (красные) каналы, когда угол п
FREE

Clearstop Account Monitor показывает реальное состояние вашего счёта в одной небольшой панели. Он бесплатный и работает только на чтение: никогда не открывает, не изменяет и не закрывает сделки. Что вы видите в реальном времени Эквити, баланс, плавающая прибыль и количество открытых позиций Результат за сегодня, эту неделю и этот месяц, в деньгах и в % от баланса на начало периода (закрытые сделки + плавающая прибыль) Просадка от пика эквити, с индикатором приближения к уровню оповещения Максима
FREE

Shved Supply and Demand is an automated market structure indicator that identifies and plots dynamic Support (Demand) and Resistance (Supply) zones in real time. Powered by a dual Fast and Slow Fractal algorithm combined with ATR-based (Average True Range) volatility sizing, the indicator filters out market noise and highlights high-probability liquidity zones. Designed for price action traders, scalpers, and Expert Advisor (EA) developers looking for objective key level detection. Key Features
FREE
MetaTrader Маркет - лучшее место для продажи торговых роботов и технических индикаторов.
Вам необходимо только написать востребованную программу для платформы MetaTrader, красиво оформить и добавить хорошее описание. Мы поможем вам опубликовать продукт в сервисе Маркет, где его могут купить миллионы пользователей MetaTrader. Так что занимайтесь только непосредственно своим делом - пишите программы для автотрейдинга.

Вы упускаете торговые возможности:
- Бесплатные приложения для трейдинга
- 8 000+ сигналов для копирования
- Экономические новости для анализа финансовых рынков
Регистрация
Вход
Вы принимаете политику сайта и условия использования
Если у вас нет учетной записи, зарегистрируйтесь