Currency Strength Momentum mt4
- Indicadores
- Versão: 2.0
- Atualizado: 22 setembro 2022
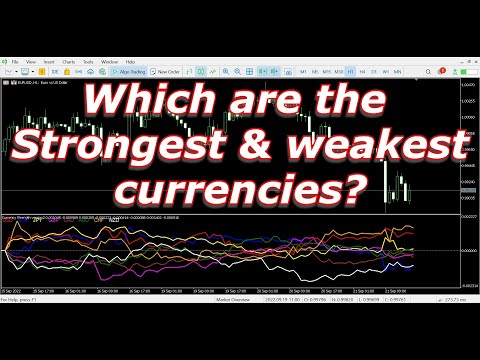
The currency strength momentum has a lot of similarities with currency strength meter presented in the previous page, but the difference are much more pronounced. You can try putting both in the same chart and see the difference in results. Currency strength momentum measures strength of a currency based on (you guess it) it's momentum relative to other currencies, while currency strength meter measures the strength of a currency based on pips it has moved in a certain direction.
N/B: All the main 28 currency charts of the above pairs must have loaded. You can do this by highlighting all major and minor currencies in Symbols lists, adding all major and minor currencies pairs in market list or opening the currencies pair charts.
How it works: https://youtu.be/2bOJnmFaKH0
Get more free stuff: https://abctrading.xyz