ATR Fractal Swings

O conceito de Fractais está em toda parte no mundo da Análise Técnica e por um bom motivo: Faz Sentido! Não é uma "profecia auto-realizável" como os níveis de Fibonacci que muitos traders respeitam incondicionalmente. Mas OK, respeitamos a fama pois ainda não exploramos o assunto suficientemente. Mas voltando ao conceito de Fractais, ele só pode ser visto visualmente em seu gráfico se realmente MOSTRARMOS isso para você, certo ?

Existem dezenas de indicadores de Zig-Zag e "Pernas" de Swing por aí, então você provavelmente deve estar se perguntando: Por que nosso indicador é diferente?

Porque somos a Minions Labs. Nós sempre trazemos a você novas ideias e pensamentos fora da caixa para permitir que você ganhe o tão sonhado: EDGE! (Diferencial)

Para começar, o ATR Fractal Swings não é baseado no cruzamento de Ticks ou Pontos fixos, é baseado no Average True Range (ATR), portanto, é totalmente adaptável às condições de volatilidade do mercado em que você está. Volatility Real = Real Swings.


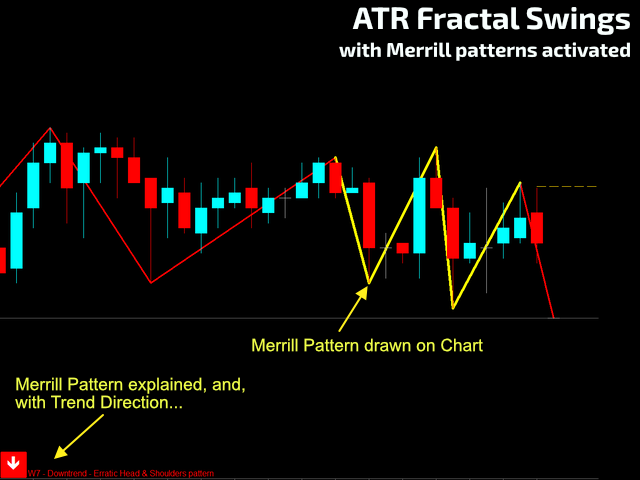
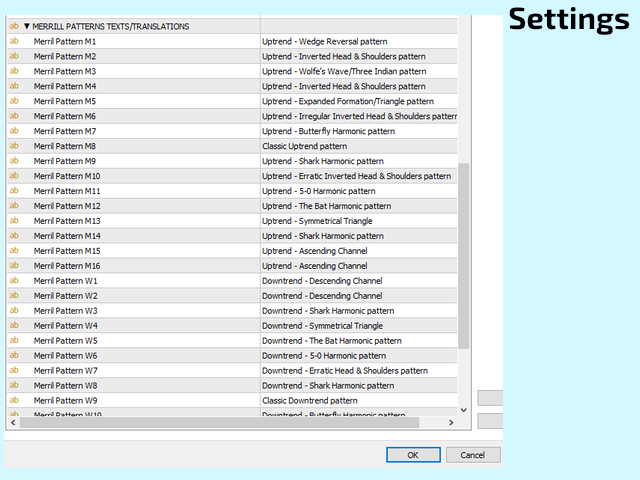
E o Plus: Adicionamos a famosa Análise de Padrões Merrill às oscilações para que traders iniciantes e intermediários possam entender visualmente a Estrutura de Mercado e para "onde ela está indo"...

Se você quiser saber mais sobre os Padrões Merrill, Arthur A. Merrill (Merrill Analysis Inc.) publicou um artigo em 1980 chamado "M&W Wave Patterns", que é um trabalho derivado de Robert A. Levy (1971 - " Predictive Significance of Five Point Chart Pattern ").


COMO LER ESTE INDICADOR

  • Os máximos e mínimos mais altos básicos = tendência de alta.
  • O mesmo para um movimento de tendência de baixa = máximos mais baixos e mínimos mais baixos.
  • Mas o mercado não é mais o mesmo, então precisamos de mais análises do que isso... Por isso adicionamos a análise Merrill Patterns.
  • Quanto maior o prazo, maior a precisão.
  • A Análise de Padrões Merrill lhe dará dicas de direções prováveis. Você tem que usar toda a sua experiência em Ação de Preço e Análise Técnica para resolver suas decisões de negociação.
  • Este indicador pode atuar como um indicador de gatilho dependendo do período de tempo e do nível de ATR que você está usando. Explorar!
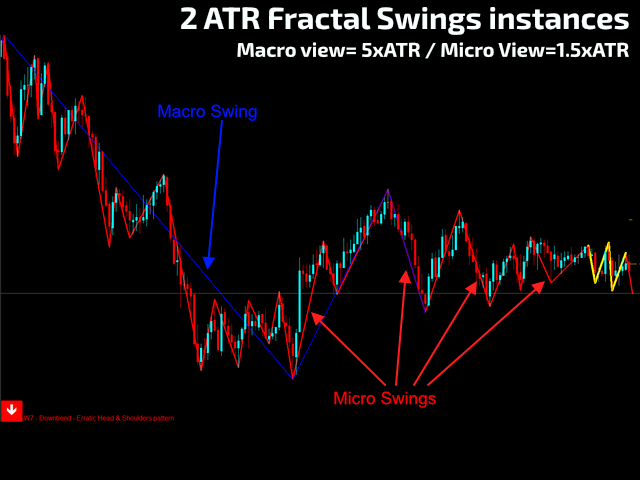
  • Usando multiplicadores de ATR mais altos, você terá a "visão geral" da tendência. Você pode usar 2 instâncias deste indicador (uma com um grande multiplicador ATR e outra com um valor menor) como uma Visualização Fractal da tendência!
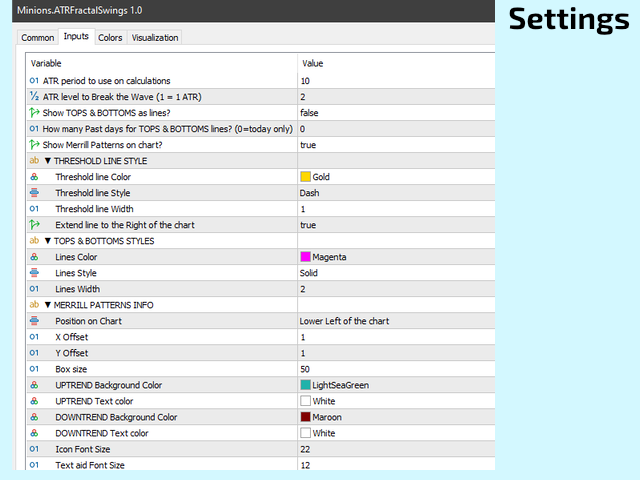

DEFINIÇÕES

  •     ATR Período de análise.
  •     Nível ATR a ser considerado um nível "Break".
  •     Mostrar as linhas Tops & Bottoms formadas pelos balanços?
  •     Há quantos dias você vai querer mostrar os Tops & Bottoms?
  •     Mostrar a análise do padrão Merrill em seu gráfico?
  •     Estilos e mais Estilos de tudo na interface! Você nos conhece, tudo é totalmente flexível! Confira o vídeo!


BUFFERS PARA USAR NO SEU EA

    #0: Vértices ZigZag (Preço). Caso contrário, valor 0.
    #1: Direção dos vértices. Acima=1 ; Baixo=-1
    #2: buffer de dados ATR.
    #3: Vértices de preço de topos e fundos. Basta ler este buffer para trás para valores >0.
    #4: Padrões Merrill - contém os últimos 5 vértices desenhados no gráfico. Basta ler este buffer para trás para valores >0.
    #5: Número do padrão Merril: 1=M1; 2=M2; 3=M3; ... 16=M16; 17=W1; 18=W2; ... 32=W16.
    #6: Direção de onda/perna atual (último elemento de buffer) - 1=UPTREND / 2=DOWNTREND.
    #7: Corrente a ser alcançada para que uma nova "perna" seja formada. Útil para posicionamento Stop Loss.


Se você quiser experimentar gratuitamente este indicador em sua conta REAL ou DEMO, leia estas instruções de nosso Blog:
https://www.mql5.com/pt/blogs/post/749794


Produtos recomendados
The indicator determines the state of the market: trend or flat. The state of the market is determined by taking into account volatility. The flat (trading corridor)is displayed in yellow. The green color shows the upward trend. The red color shows the downward trend. The height of the label corresponds to the volatility in the market. The indicator does not redraw . Settings History_Size   - the amount of history for calculation. Period_Candles  - the number of candles to calculate the indicat
A useful scanner/dashboard that shows the RSI values for multiple symbols and Time-frames. It can be easily hidden/displayed with a simple click on the scanner man top left of the dashboard. You can input upper and lower RSI values and the colours can be set to show when above/below these values. The default values are 70 and 30. There are also input colours for when the RSI is above or below 50 (but not exceeding the upper/lower levels Symbols and time-frames are input separated by commas. S
CosmiCLab SMC FIBO CosmiCLab SMC FIBO is a professional trading indicator designed for traders who use Smart Money Concepts (SMC), market structure analysis and Fibonacci retracement levels. The indicator automatically detects market swings and builds Fibonacci levels based on the latest impulse movement. It also identifies market structure changes such as BOS (Break of Structure) and CHOCH (Change of Character), helping traders understand the current market direction. CosmiCLab SMC FIBO also pr
Prime Power ML é um Currency Strength Meter avançado com dois modelos de redes neurais ONNX que filtram sinais por probabilidade de ganho antes de exibi-los. Ao contrário dos indicadores CSM tradicionais que mostram cada divergência entre moedas, o Prime Power ML destaca apenas os sinais onde a AI confirma uma vantagem estatística. Como funciona O indicador calcula em tempo real a força de 8 moedas principais (USD, EUR, GBP, JPY, AUD, CAD, CHF, NZD) usando pontuação RSI em todos os 28 pares. Qua
Introducing the Bollinger Flipper Indicator – Your Ultimate Trading Edge!   Are you tired of second-guessing your entries and exits? The Bollinger Flipper Indicator is here to flip the game in your favor.   Built with the power of Bollinger Bands + Level 3 Power System + ZigZag Fractals, this advanced tool is designed to spot high-probability buy & sell signals with precision. SPECIAL BONUS (VALID TILL JUNE 2026)- OUR DAILY SCALPER EA for BTCUSD and VIX75 •································
RBreaker
Zhong Long Wu
RBreaker Gold Indicators é uma estratégia de negociação intradiária de curto prazo para futuros de ouro que combina duas abordagens: o seguimento de tendência e as reversões intradiárias. Ela permite capturar lucros durante mercados em tendência e também realizar lucros oportunamente e operar na direção oposta quando o mercado se reverte. Esta estratégia foi classificada por 15 anos consecutivos entre as dez estratégias de negociação mais lucrativas pela revista americana Futures Truth. Ela pos
VVWAP Bandas
Edipaulo Zanella
Daily VWAP, continues for a period of hours (eg, 10 hours of history), with color to indicate change of direction and bands to map good entry and exit points. The indicator was created to map the center of the market, and find good buying moments, trend analysis or market correction points are easily detected, allowing you to understand moments of exhaustion and buying and selling points Copyright (c) <year> <copyright holders> Permission is hereby granted, free of charge, to any person obtaini
Histograma de Rendimento L&S Caicai Aviso Importante: Este indicador é uma ferramenta integrante do robô automatizado EA Caicai Long and Short Pair Trading . Este indicador exibe visualmente o desvio percentual (Yield %) do spread atual de um par em relação à sua própria média histórica. É excelente para visualizar rapidamente o potencial financeiro bruto de uma distorção. Principais Funcionalidades: Visualização em Percentual: Entenda facilmente o tamanho da distorção em termos percentuais. Múl
Holiday Sales Zones Indicator The Zones Indicator is your everyday Trading tool that  leverages advanced algorithms, including ICT institutional concepts like order blocks , engulfing candle patterns , and Level interactions , to identify critical levels of supply and demand (Resistance & Support). Visual signals are generated and clearly marked on the chart, providing a straightforward guide for traders to spot key opportunities. Key Features Advanced Algorithmic Analysis : Identifies supply
First time on MetaTrader, introducing IQ Star Lines - an original Vedic Astrology based indicator. "Millionaires don't use astrology, billionaires do" . - J.P. Morgan, Legendary American financier and banker. IQ Star Lines, an unique astrological indicator purely based on   Vedic astrology   calculations, published for the   first time on Metatrader.  This unique tool plots dynamic planetary grid lines based on real-time stars, constellations, and celestial movements, which allows you to plot t
Este indicador encontra os padrões de retração AB = CD. O padrão AB = CD Retracement é uma estrutura de preço de 4 pontos em que o segmento de preço inicial é parcialmente retraído e seguido por um movimento equidistante da conclusão da retirada, e é a base básica para todos os padrões harmônicos. [ Guia de instalação | Guia de atualização | Solução de problemas | FAQ | Todos os produtos ] Tamanhos de padrão personalizáveis Proporções AC e BD personalizáveis Períodos de interrupção personali
Better RSI With Tester
Mohammad Taher Halimi Tabrizi
Category: Trend Indicator Platform: MetaTrader 5 Type: Entry Indicator Timeframes: All Trader Styles: Scalping, Day Trading, Swing Trading, Binary Options Markets: All Description This indicator is an enhanced version of the Relative Strength Index (RSI) with additional features for visual clarity and cycle detection. It is designed to provide traders with a clearer view of momentum conditions and potential turning points. Main features: Improved RSI Visualization – The indicator displays RSI va
ATrend
Zaha Feiz
4.83 (18)
ATREND: Como Funciona e Como Usá-lo #### Como Funciona O indicador "ATREND" para a plataforma MT5 é projetado para fornecer aos traders sinais robustos de compra e venda, utilizando uma combinação de metodologias de análise técnica. Este indicador aproveita principalmente o Intervalo Verdadeiro Médio (ATR) para medir a volatilidade, juntamente com algoritmos de detecção de tendências para identificar possíveis movimentos de mercado. Deixe uma mensagem após a compra e receba um brinde especial.
SMC Buy Sell Indicator SMC Buy Sell Indicator is a price action-based trading tool designed to identify market structure using Smart Money Concepts. It focuses on detecting meaningful swing points, structural breaks, and confirmation signals directly from chart data. The indicator operates using closed candle data and does not rely on future bars. All calculations are performed on confirmed price action, which helps maintain consistent and stable signals. Key Features Market Structure Detection
Over Trend MT5
Mansour Babasafary
Trend based indicator Identify trends with this indicator A simple-to-use trend indicator No complicated settings Attributes: Can be used in all symbols Can be used in all time frames Relatively high signals No complicated settings Specific to the trend Lifetime support Settings: Alarm Show Alert: By activating these settings, after receiving the signal, you will receive an alarm in Metatrader Alarm Show Notification: By activating these settings, after receiving the signal, you will receive a
Looking for a powerful yet lightweight swing detector that precisely identifies key market structure turning points? Want clear, reliable buy and sell signals that work across all timeframes and all instruments? Buy Sell Arrow Swing   MT5  is designed exactly for that—delivering accurate and efficient swing detection without complexity. This indicator clearly identifies Higher Highs (HH), Higher Lows (HL), Lower Highs (LH), and Lower Lows (LL) , allowing traders to visualize market structure, tr
Apresentamos o Market Structure Break Out para MT5 – Seu indicador profissional de MSB e Zona Não Quebrada. A versão para MT4 também está disponível, confira aqui: https ://www .mql5 .com /en /market /product /109958 Este indicador está sendo continuamente atualizado. Nos esforçamos para fornecer pontos de entrada e saída altamente precisos com base na estrutura do mercado. Estamos agora na versão 1.1, e abaixo estão as últimas mudanças se você se juntar a nós agora: Alvos de Compra e Venda:  
Range Filtered AlgoAlpha é uma ferramenta de análise técnica desenvolvida para identificar oportunidades potenciais de negociação através da análise da volatilidade do mercado. Esta adaptação para MetaTrader do indicador original do TradingView da AlgoAlpha combina múltiplos métodos analíticos para fornecer uma avaliação visual do mercado. Características técnicas Utiliza filtro de Kalman (Kalman Filtering) para suavizar preços Incorpora bandas baseadas em ATR (ATR-based Bands) para medir volati
Fibaction
Abdelkhalek Orabi
Indicator Name: Fibaction – price action candle Detector Description: Fibo Signal Boxes is a powerful Smart Money Concept (SMC)-inspired indicator that auto-detects price action candles. bullish hammers and shooting stars, then draws precise Fibonacci entry zones and multiple take-profit levels directly on the chart. as for the SL personally i use 40 pips rules  Key Features: Detects bullish hammer and shooting star reversal candles. Automatically draws Fibonacci entry and TP boxes. as
Indicador multimoeda e multitimeframe do Canal de Desvio Padrão. Exibe a direção atual do mercado. No painel você pode ver rompimentos e toques (por preço) dos níveis do canal de regressão linear. Nos parâmetros, você pode especificar quaisquer moedas e prazos desejados. Além disso, o indicador pode enviar notificações quando os níveis são atingidos. Ao clicar em uma célula, este símbolo e ponto final serão abertos. Este é o scanner MTF. A chave para ocultar o painel do gráfico é “D” por padrã
O indicador SMC Venom Model BPR é uma ferramenta profissional para os traders que trabalham com o conceito Smart Money (SMC). Identifica automaticamente dois padrões principais no gráfico de preços: FVG   (Fair Value Gap) é uma combinação de três velas, em que existe um gap entre a primeira e a terceira velas. Forma uma zona entre níveis onde não há suporte de volume, o que geralmente leva a uma correção de preço. BPR   (Balanced Price Range) é uma combinação de dois padrões FVG que formam uma
MarketMagnet
Kelly Adediran Raymond
Are you ready to take your trading journey to new heights? Look no further than MarketMagnet, this groundbreaking indicator designed to propel your trading success with excitement and accuracy. Powered by the convergence of Momentum and CCI (Commodity Channel Index), MarketMagnet equips traders with the ultimate tool to determine direction and entry prices for a wide range of recommended currency pairs and instruments. It is designed for traders seeking to scalp for a few pips on lower timeframe
Features: Clear Buy/Sell labels with directional arrows. Automatic Take Profit (TP) & Stop Loss (SL) labels for better risk management. Easy-to-read chart signals (no messy lines). Works on any timeframe and any asset (Forex, Gold, Indices, Crypto, Stocks). Compatible with MetaTrader 5 (MT5 desktop & mobile sync) . Perfect for: Beginner traders who need straightforward signals. Experienced traders who want an extra confirmation tool. Anyone looking to simplify their chart without clutter.
Super Fibo
Pham Minh Thuan
Fibonacci retracement levels—stemming from the Fibonacci sequence—are horizontal lines that indicate where   support   and   resistance   are likely to occur. Each level is associated with a percentage. The percentage is how much of a prior move the price has retraced. The Fibonacci   retracement   levels are 23.6%, 38.2%, 61.8%, and 78.6%. While not officially a Fibonacci ratio, 50% is also used. The indicator is useful because it can be drawn between any two significant price points, such as
MACD Support–Resistance Candle Analyzer — Professional This indicator enhances the classic MACD by combining   momentum analysis   with   dynamic Support & Resistance detection , giving traders a clearer view of breakout strength and market structure. It transforms price action into   color-coded MACD candles , highlights   SnR break levels , and provides clean visual confirmation of trend continuation or reversal. Ideal for scalpers, intraday traders, and swing traders who rely on fast, structu
Double HMA MTF for MT5
Pavel Zamoshnikov
4 (4)
This is an advanced multi-timeframe version of the popular Hull Moving Average (HMA) Features Two lines of the Hull indicator of different timeframes on the same chart. The HMA line of the higher timeframe defines the trend, and the HMA line of the current timeframe defines the short-term price movements. A graphical panel with HMA indicator data from all timeframes at the same time . If the HMA switched its direction on any timeframe, the panel displays a question or exclamation mark with a tex
Three Candles Pattern
Edson Cavalca Junior
5 (1)
O indicador identifica os padrões de 3 (três) Candles: Três Soldados Brancos; Três Corvos Pretos; São padrões de reversão muito utilizados pelos Traders, pois eles tem uma   Alta   Probabilidade de mostrar a inversão do movimento atual do mercado. Exemplificando, caso em uma tendência de Alta apareça  Três Corvos Pretos há uma Alta Probabilidade de inversão do movimento Altista atual . Os Três Soldados Brancos possuem as seguintes características: São 3 candles consecutivos com um bom corpo,
ZoneSeven – Advanced Market Zone Indicator for MT5 Product Overview Zone7 is a premium MT5 indicator designed to identify high-probability price interaction zones based on time-sensitive market behavior. It provides traders with clear visual zones that help anticipate potential buy and sell reactions, while keeping the internal calculation logic fully protected. Core Functionality Zone7 automatically analyzes: Intraday price behavior Time-based market structure Session movement characteristics U
Turn your chart into a professional trading dashboard that shows where price is flowing and when the next shock is coming —without loading a single extra window. This indicator combines a price-following MA ribbon with a live news radar directly on the chart, giving you both trend and event risk in one glance. Trend Ribbon – Read the market bias instantly A smooth, step-style moving average ribbon follows price action bar by bar. Color change shows the active trend: aqua for bullish flow , gold
Yawabeh SD Pro –  Professional Supply and Demand Indicator Trade Smarter with Volume-Confirmed Supply/Demand Zones Our institutional-grade algorithm identifies high-probability reversal zones before price reacts, giving you the edge in Forex, Crypto, and Stocks. Key Features Multi-Timeframe Confirmation – View trend strength across multiple timeframes simultaneously – Align your trades with higher timeframe momentum Smart Alert System – Real-time notifications for: – Strong demand/supply zone
Os compradores deste produto também adquirem
ARIPoint
Temirlan Kdyrkhan
ARIPoint is a powerful trading companion designed to generate high-probability entry signals with dynamic TP/SL/DP levels based on volatility. Built-in performance tracking shows win/loss stats, PP1/PP2 hits, and success rates all updated live. Key Features: Buy/Sell signals with adaptive volatility bands Real-time TP/SL/DP levels based on ATR Built-in MA Filter with optional ATR/StdDev volatility Performance stats panel (Success, Profit/Loss, PP1/PP2) Alerts via popup, sound, push, or email Cu
SuperScalp Pro
Van Minh Nguyen
4.57 (21)
SuperScalp Pro – Sistema avançado de scalping com múltiplos filtros SuperScalp Pro é um indicador avançado de scalping que combina o clássico Supertrend com múltiplos filtros inteligentes de confirmação para ajudar a identificar oportunidades de trading. Funciona de forma eficiente em vários timeframes de M1 até H4, com desempenho otimizado para XAUUSD, BTCUSD e principais pares Forex. O indicador fornece sinais claros de Buy e Sell, juntamente com níveis calculados automaticamente de entrada, S
Divergence Bomber
Ihor Otkydach
4.9 (86)
Cada comprador deste indicador recebe adicionalmente, e de forma gratuita: A ferramenta exclusiva "Bomber Utility", que acompanha automaticamente cada operação, define os níveis de Stop Loss e Take Profit e fecha operações de acordo com as regras da estratégia; Arquivos de configuração (set files) para ajustar o indicador em diferentes ativos; Set files para configurar o Bomber Utility nos modos: "Risco Mínimo", "Risco Balanceado" e "Estratégia de Espera"; Um vídeo tutorial passo a passo que aju
Entry In The Zone and SMC Multi Timeframe is a real-time 2-in-1 market analysis tool that combines market structure analysis and a No Repaint BUY / SELL signal system into a single indicator, built on Smart Money Concepts (SMC) — a widely adopted framework used by professional traders to understand market structure. This indicator helps you see the market more clearly, make decisions based on structure rather than guesswork, and focus on high-probability zones where price is more likely to react
Quantum TrendPulse
Bogdan Ion Puscasu
5 (23)
Apresentando   Quantum TrendPulse   , a ferramenta de negociação definitiva que combina o poder do   SuperTrend   ,   RSI   e   Stochastic   em um indicador abrangente para maximizar seu potencial de negociação. Projetado para traders que buscam precisão e eficiência, este indicador ajuda você a identificar tendências de mercado, mudanças de momentum e pontos de entrada e saída ideais com confiança. Principais características: Integração SuperTrend:   siga facilmente a tendência predominante do
Power Candles MT5
Daniel Stein
4.75 (8)
Power Candles – Sinais de entrada baseados em força para qualquer mercado Power Candles leva a análise de força comprovada da Stein Investments diretamente para o seu gráfico de preços. Em vez de reagir apenas ao preço, cada candle é colorido com base na força real do mercado, permitindo identificar instantaneamente a construção de momentum, aceleração de força e transições limpas de tendência. Uma única lógica para todos os mercados Power Candles funciona automaticamente em todos os símbolos de
Se você comprar este indicador, receberá meu Gerenciador de Operações Profissional + EA  GRATUITAMENTE. Primeiramente, vale ressaltar que este Sistema de Trading é um Indicador Não Repintado, Não Redesenho e Não Atrasado, o que o torna ideal tanto para o trading manual quanto para o automatizado. Curso online, manual e download de predefinições. O "Sistema de Trading Inteligente MT5" é uma solução completa de trading projetada para traders novos e experientes. Ele combina mais de 10 indicadores
Gann Made Easy   é um sistema de negociação Forex profissional e fácil de usar, baseado nos melhores princípios de negociação usando a teoria do sr. W. D. Gann. O indicador fornece sinais precisos de COMPRA e VENDA, incluindo níveis de Stop Loss e Take Profit. Você pode negociar mesmo em movimento usando notificações PUSH. Entre em contato comigo após a compra para receber instruções de negociação e ótimos indicadores extras gratuitamente! Provavelmente você já ouviu muitas vezes sobre os método
Azimuth Pro
Ottaviano De Cicco
5 (7)
Azimuth Pro V2: Estrutura Fractal Sintética e Entradas Confirmadas para MT5 Visão geral Azimuth Pro é um indicador de estrutura swing multinível da Merkava Labs . Quatro camadas de swing aninhadas, VWAP ancorado em swings, detecção de padrões ABC, filtragem estrutural de três timeframes e entradas confirmadas em barra fechada — um gráfico, um fluxo de trabalho dos micro-swings aos macro-ciclos. Este não é um produto de sinais cegos. É um fluxo de trabalho baseado em estrutura para traders que v
OmniSync Projection
Antonio-alin Teculescu
5 (1)
Chronos Fractal Engine is an innovative price projection indicator for MetaTrader 5, designed to transform your technical analysis by intelligently identifying and projecting historical price patterns. Built upon an advanced correlation algorithm and the fractal principles of the market, this powerful tool visualizes potential future price movements, giving you a unique edge in your trading decisions. What is Chronos Fractal Engine? At its core, the Chronos Fractal Engine employs a sophisticat
FX Trend MT5 NG
Daniel Stein
5 (4)
FX Trend NG: A Nova Geração de Inteligência de Tendência Multi-Mercado Visão Geral FX Trend NG é uma ferramenta profissional de análise de tendências e monitoramento de mercado em múltiplos períodos de tempo. Permite compreender a estrutura completa do mercado em segundos. Em vez de alternar entre vários gráficos, você visualiza instantaneamente quais ativos estão em tendência, onde o momentum está enfraquecendo e onde existe alinhamento forte entre diferentes timeframes. Oferta de Lançamento
Trend Screener Pro MT5
STE S.S.COMPANY
4.85 (104)
Desbloqueie o poder da negociação de tendências com o indicador Trend Screener: sua solução definitiva de negociação de tendências, alimentada por lógica difusa e sistema de múltiplas moedas! Eleve sua negociação de tendências com o Trend Screener, o revolucionário indicador de tendências alimentado por lógica difusa. É um poderoso indicador de acompanhamento de tendências que combina mais de 13 ferramentas e recursos premium e 3 estratégias de negociação, tornando-o uma escolha versátil para to
Grabber System MT5
Ihor Otkydach
4.83 (23)
Apresento a você um excelente indicador técnico: Grabber, que funciona como uma estratégia de trading “tudo incluído”, pronta para usar. Em um único código estão integradas ferramentas poderosas de análise técnica de mercado, sinais de entrada (setas), funções de alertas e notificações push. Cada comprador deste indicador também recebe gratuitamente: Utilitário Grabber: ferramenta para gerenciamento automático de ordens abertas Vídeo tutorial passo a passo: como instalar, configurar e operar com
Vamos ser honestos primeiro. Nenhum indicador sozinho vai te tornar lucrativo. Se alguém te disser o contrário, está te vendendo um sonho. Qualquer indicador que mostre setas perfeitas de compra/venda pode ser feito para parecer impecável — basta dar zoom na parte certa da história e tirar um print das operações vencedoras. Nós não fazemos isso.  SMC Intraday Formula é uma ferramenta. Ela lê a estrutura do mercado para você, identifica as zonas de maior probabilidade de preço e mostra exatament
Veja qual estrategia realmente funciona no seu simbolo - antes de arriscar dinheiro real. Power Bar detecta barras de preco extremas em qualquer simbolo e qualquer timeframe, e entao faz backtest instantaneo de 3 estrategias de trading diferentes para que voce possa comparar taxas de acerto, fatores de lucro e P&L lado a lado. Tudo em um unico painel interativo. Sem suposicoes. Sem curve-fitting. Apenas dados. O que torna o Power Bar unico? A maioria dos indicadores fornece um sinal e deixa voc
CGE Trading Suite
Carl Gustav Johan Ekstrom
5 (2)
Institutional-Grade Analytics for MT5 C GE Trading Suite delivers the analytical edge typically reserved for professional trading desks. The platform integrates a full suite of analytical tools into one seamless workflow: dynamic grid mapping, liquidity behavior analysis, ECM, trend lines, MIDAS, trade cycles, and directional channel projections. Together, these provide a unified view of market structure and momentum. Directional clarity is further enhanced by the capital flow index, which meas
SignalTech MT5 is a trading system for EURUSD, USDCHF, USDJPY, AUDUSD, NZDUSD, EURJPY, AUDJPY, NZDJPY, CADJPY H2 and H3 Timeframe.  It can generate signals with Buy/Sell Arrows and Pop-Up/Sound Alerts. Each signal has clear Entry and Stop Loss levels, which should be automatically flagged on the chart, as well as potential Targets 1, 2, and 3. The Entry and TP levels are fixed after the trade is taken. The exit level is dynamic. If there are signs of a potential short-term trend reversal, the
Atomic Analyst MT5
Issam Kassas
3.94 (31)
Primeiramente, vale ressaltar que este Indicador de Negociação não repinta, não redesenha e não apresenta atrasos, tornando-o ideal tanto para negociação manual quanto automatizada. Manual do utilizador: configurações, entradas e estratégia. O Analista Atômico é um Indicador de Ação de Preço PA que utiliza a força e o momentum do preço para encontrar uma vantagem melhor no mercado. Equipado com filtros avançados que ajudam a remover ruídos e sinais falsos, e aumentam o potencial de negociação.
FX Power MT5 NG
Daniel Stein
5 (31)
FX Power: Analise a Força das Moedas para Decisões de Negociação Mais Inteligentes Visão Geral FX Power é a sua ferramenta essencial para compreender a força real das principais moedas e do ouro em quaisquer condições de mercado. Identificando moedas fortes para comprar e fracas para vender, FX Power simplifica as decisões de negociação e revela oportunidades de alta probabilidade. Quer você prefira seguir tendências ou antecipar reversões usando valores extremos de Delta, esta ferramenta adap
Btmm state engine pro
Garry James Goodchild
5 (4)
BTMM State Engine Pro is a MetaTrader 5 indicator for traders who use the Beat The Market Maker approach: Asian session context, kill zone timing, level progression, peak formation detection, and a multi-pair scanner from a single chart. It combines cycle state logic with a built-in scanner dashboard so you do not need the same tool on many charts at once. What it does Draws the Asian session range; session times can follow broker server offset or be set in inputs. Tracks level progression (L
Apresentando       Quantum Breakout PRO   , o inovador Indicador MQL5 que está transformando a maneira como você negocia Breakout Zones! Desenvolvido por uma equipe de traders experientes com experiência comercial de mais de 13 anos,       Quantum Breakout PRO       foi projetado para impulsionar sua jornada comercial a novos patamares com sua estratégia de zona de fuga inovadora e dinâmica. O Quantum Breakout Indicator lhe dará setas de sinal em zonas de breakout com 5 zonas-alvo de lucro e su
Bill Williams Advanced
Siarhei Vashchylka
5 (11)
Bill Williams Advanced is designed for automatic chart analysis using Bill Williams' "Profitunity" system. The indicator analyzes four timeframes at once. Manual (Be sure to read before purchasing) Advantages 1. Analyzes the chart using Bill Williams' "Profitunity" system. Signals are displayed in a table in the corner of the screen and on the price chart. 2. Finds all known AO and AC signals, as well as zone signals. Equipped with a trend filter based on the Alligator. 3. Finds "Divergence Bar
Berma Bands
Muhammad Elbermawi
5 (8)
O indicador Berma Bands (BBs) é uma ferramenta valiosa para traders que buscam identificar e capitalizar tendências de mercado. Ao analisar a relação entre o preço e os BBs, os traders podem discernir se um mercado está em uma fase de tendência ou de variação. Visite o [ Blog Berma Home ] para saber mais. As Bandas de Berma são compostas por três linhas distintas: a Banda de Berma Superior, a Banda de Berma Média e a Banda de Berma Inferior. Essas linhas são plotadas em torno do preço, criando u
Auto Optimized Parabolic RSI: Avançado Motor de Momentum 3D A maioria dos indicadores de varejo falha porque depende de parâmetros estáticos que quebram no momento em que a volatilidade do mercado muda. O Auto Optimized Parabolic RSI resolve o problema de "obsolescência do indicador" recalculando continuamente a sua própria vantagem matemática, trazendo uma adaptação quantitativa de nível institucional diretamente para o seu terminal MT5. A Vantagem Principal: Otimização 3D em Memória Personaliz
Meridian Pro
Ottaviano De Cicco
5 (1)
Meridian Pro: Matriz Profissional de Tendência Multi-Timeframe para MT5 Visão geral Meridian Pro é uma matriz de tendência multi-timeframe da Merkava Labs que comprime estado direcional, força, condição de momentum e concordância da matriz em um painel compacto. Um motor adaptativo, aplicado consistentemente de M1 a W1. Sem ajuste por símbolo. Sem acúmulo de indicadores. Uma leitura estruturada em todos os ativos e todos os timeframes. Oferta de lançamento — Obtenha o Meridian Pro por USD 99 (in
Crystal Heikin Ashi Signals
Muhammad Jawad Shabir
5 (2)
Crystal Heikin Ashi Signals - Professional Trend & Signal Detection Indicator Advanced Heikin Ashi Visualization with Intelligent Signal System for Manual & Automated Trading Final Price: $149 ---------> Price goes up $10 after every 10 sales . Limited slots available — act fast . Overview Crystal Heikin Ashi Signals is a professional-grade MetaTrader 5 indicator that combines pure Heikin Ashi candle visualization with an advanced momentum-shift detection system. Designed for both manual traders
Market Structure Order Block Dashboard MT5 é um indicador MT5 desenvolvido para traders que querem ler a estrutura de mercado e as principais zonas de reação do preço diretamente no gráfico. Ele combina BOS, ChoCH, Order Blocks, Fair Value Gaps (FVG), Liquidity, Kill Zones, Volume Profile e um dashboard compacto para uma análise rápida. Este indicador foi pensado para traders que usam estrutura de mercado, conceitos ICT e Smart Money como base para tomada de decisão. Ele pode ajudar a identifica
IX Power MT5
Daniel Stein
4.92 (13)
IX Power: Descubra informações de mercado para índices, commodities, criptomoedas e forex Visão Geral IX Power é uma ferramenta versátil projetada para analisar a força de índices, commodities, criptomoedas e símbolos de forex. Enquanto o FX Power oferece a máxima precisão para pares de moedas ao utilizar dados de todos os pares disponíveis, o IX Power foca exclusivamente nos dados do mercado do símbolo subjacente. Isso torna o IX Power uma excelente escolha para mercados fora do forex e uma o
ARICoins
Temirlan Kdyrkhan
ARICoin is a powerful trading companion designed to generate high-probability entry signals with dynamic TP/SL/DP levels based on volatility. Built-in performance tracking shows win/loss stats, PP1/PP2 hits, and success rates all updated live. Key Features: Buy/Sell signals with adaptive volatility bands Real-time TP/SL/DP levels based on ATR Built-in MA Filter with optional ATR/StdDev volatility Performance stats panel (Success, Profit/Loss, PP1/PP2) Alerts via popup, sound, push, or email Cust
Meravith Scanner
Ivan Stefanov
5 (1)
O MERAVITH SCANNER é um indicador profissional de mercados financeiros para MetaTrader 5 que consolida várias ferramentas analíticas em um único sistema integrado. Ele realiza todos os cálculos automaticamente usando uma metodologia proprietária de preço médio ponderado por volume (VWAP), eliminando completamente a interpretação subjetiva. O indicador funciona em todas as classes de ativos (Forex, Ações, Índices, Commodities, Criptomoedas) e em todos os prazos, de M1 a Mensal. O princípio fundam
Mais do autor
Mini POC
Flavio Javier Jarabeck
4.93 (29)
For those who struggle with overbloated Volume Profile/Market Profile indicators, here is a solution that contains only the Point of Control (POC) information. Super-fast and reliable, the Mini POC indicator presents this vital information visually within your chart. Totally customizable in splittable timeframes, type of Volume, calculation method, and how many days back you need. SETTINGS Timeframe to split the POCs within the day. Volume type to use: Ticks or Real Volume. Calculation method .
FREE
Auto Support and Resistances
Flavio Javier Jarabeck
4.57 (70)
Are you tired of drawing Support & Resistance levels for your Quotes? Are you learning how to spot Support & Resistances? No matter what is your case, Auto Support & Resistances will draw those levels for you! AND, it can draw them from other timeframes, right into you current chart, no matter what timeframe you are using... You can also Agglutinate regions/zones that are too much closer to each other and turning them into one single Support & Resistance Level. All configurable. SETTINGS Timefr
FREE
Closing Price Reversal
Flavio Javier Jarabeck
5 (11)
Closing Price Reversal is a very well known and traded candlestick pattern. This little indicator paints with specific (user-selected) colors the Closing Price Reveral Up and Down patterns, as well as the Inside Bars (as a bonus). Higher timeframes are more effective  as with all other candlesticks patterns. Do NOT trade solely on this indicator. Search the web for "Closing Price Reversal" to learn about the several approaches that can be used with this pattern. One of them is combining short/me
FREE
Inside Bar Radar
Flavio Javier Jarabeck
4.67 (6)
The Inside Bar pattern is a very well known candlestick formation used widely by traders all over the world and in any marketplace. This approach is very simple and adds a little confirmation candle, so it adds a third past candlestick to the count to confirm the direction of the move (upward or downward). Obviously, there is no power on this candlestick formation if the trader has no context on what it is happening on the market he/she is operating, so this is not magic, this "radar" is only a
FREE
Tabajara V5
Flavio Javier Jarabeck
4.83 (36)
Metatrader 5 version of the famous Andre Machado's Tabajara indicator. If you don't know Andre Machado's Technical Analysis work you don't need this indicator... For those who need it and for those several friend traders who asked this porting from other platforms, here it is... FEATURES 8-period Moving Average 20-period Moving Average 50-period Moving Average 200-period Moving Average Colored candles according to the inflexion of the 20-period MA SETTINGS You can change the Period of all MA's
FREE
Economic Markers
Flavio Javier Jarabeck
4.79 (14)
Easily get all relevant economic events of the current day right into your chart, as markers. Filter what kind of markers do you want: by country (selected individually) and by Importance (High relevance, Medium, Low or any combination of these). Configure the visual cues to your liking. If there is more than one event set to the very same time, their Names will be stacked and you will see the messages merged with the plus (+) sign on the marker. Obviously that long or too much events on the sam
FREE
Aggression Volume
Flavio Javier Jarabeck
4.29 (17)
O Indicador de Volume de Agressão é o tipo de indicador que raramente é encontrado na comunidade MQL5 porque não é baseado nos dados de Volume padrão fornecidos pela plataforma Metatrader 5. Ele requer a análise de todos os Ticks de tráfego solicitados na plataforma... Dito isso, o indicador de Volume de Agressão solicita todos os Dados de Tick do seu Broker e os processa para construir uma versão muito especial de um Indicador de Volume, onde as agressões de Compradores e Vendedores são plotada
FREE
Weis Waves
Flavio Javier Jarabeck
2.83 (18)
The original author is David Weis, an expert in the Wyckoff Method. The Weis Wave is a modern adaptation of the 1930's Wyckoff Method, another expert in Tape Reading techniques and Chart Analysis. Weis Waves takes market volume and stacks it into waves according to price conditions giving the trader valuable insights about the market conditions. If you want to learn more about this subject you can find tons of videos in YouTube. Just look for "The Wickoff Method", "Weis Wave" and "Volume Spread
FREE
Big Player Candles
Flavio Javier Jarabeck
4.91 (23)
If you heard about The Wyckoff Method, Volume Spread Analysis, etc... You are probably searching for the candlestick indicator that shows you the Volume spread all over the current bar, signaling every types of market status... You can control the several Market Levels with custom colors... It is up to you to decide how to use it. Our job is provide you with the indicator... If you like this indicator, all I am asking is a little Review (not a Comment, but a REVIEW! )...    This will mean A LO
FREE
Symbol Watermark
Flavio Javier Jarabeck
4.57 (14)
Another request from my brotherhood was putting the name of the Symbol being seen - a little bigger - on the Chart, just to get sure that they are seeing the correct one... Mistakes pay a high price on the market... It is a very effective, and almost resource-null-consuming indicator that displays the current Symbol Name and Timeframe in almost any position of your Chart, with any color, and any Font Size... And also you can change the divisor character that is presented between the Symbol Name
FREE
Market Momentum
Flavio Javier Jarabeck
4.43 (7)
O indicador de Momento do Mercado é baseado no Oscilador de Zona de Volume (VZO), apresentado por Waleed Aly Khalil na edição de 2009 do jornal da Federação Internacional de Analistas Técnicos , e apresenta uma nova visão desses valiosos dados de mercado que muitas vezes são mal compreendidos e negligenciados: o VOLUME. Com essa nova abordagem de "ver" os dados de Volume, os traders podem inferir de maneira mais adequada o comportamento do mercado e aumentar suas chances em uma negociação bem-su
FREE
VWAP and MVWAP
Flavio Javier Jarabeck
3.88 (8)
Volume Weighted Average Price (VWAP) is a trading benchmark commonly used by Big Players that gives the average price a Symbol has traded throughout the day. It is based on both Volume and price. Additionally we put in this indicator the MVWAP (Moving Volume Weighted Average Price). For those who do not know the usage and the importance od this indicator I recommend a great article about this subject at Investopedia ( https://www.investopedia.com/articles/trading/11/trading-with-vwap-mvwap.asp )
FREE
MIDAS Super VWAP
Flavio Javier Jarabeck
4.27 (11)
Imagine VWAP, MVWAP and MIDAS in one place... Well, you found it! Now you can track the movement of Big Players in various ways, as they in general pursue the benchmarks related to this measuring, gauging if they had good execution or poor execution on their orders. Traders and analysts use the VWAP to eliminate the noise that occurs throughout the day, so they can measure what prices buyers and sellers are really trading. VWAP gives traders insight into how a stock trades for that day and deter
FREE
Force Numbers
Flavio Javier Jarabeck
5 (1)
Several assets in several markets have the behavior of using specific numbers as Force Numbers, where support, resistance and price thrust is created. Let this indicator draw those levels of support and resistance for you. You can also stack it to show different level of Prices! This technique is being used by Tape Readers and Order Flow traders all over the world for a long time. Give it a try. Challenge yourself to study new ways of Price Action! SETTINGS What Price reference to use in the c
FREE
Stackable VWAP
Flavio Javier Jarabeck
3.5 (4)
Volume Weighted Average Price (VWAP) is a trading benchmark commonly used by Big Players that gives the average price a Symbol has traded throughout the day. It is based on both Volume and price. Additionally we put in this indicator the MVWAP (Moving Volume Weighted Average Price). For those who do not know the usage and the importance od this indicator I recommend a great article about this subject at Investopedia ( https://www.investopedia.com/articles/trading/11/trading-with-vwap-mvwap.asp
FREE
Money Flow Index EA Friendly
Flavio Javier Jarabeck
3.67 (3)
O indicador tradicional Money Flow Index, desta vez, compatível com EAs . Existem 3 buffers expostos que podem ser usados por EAs para analisar automaticamente as condições de sobrecompra e sobrevenda da cotação. Basta usar a função tradicional iCustom() para obter esses sinais. Este cálculo do Money Flow Index é baseado no indicador MFI tradicional da Metaquote. CONFIGURAÇÕES Período do MFI Tipo de volume para analisar (Volume Real ou Ticks) Início da região de sobrecompra Início da região de
FREE
Server Clock
Flavio Javier Jarabeck
5 (5)
Many friends asked me for a simple, non-obtrusive, resource-friendly clock to track the time during their trades. It seems pretty obvious, but it is a must-have for those trading the market manually, waiting for the Market News, or just to visually know what time it is... Trading is an absorbing endeavor! So, here it is... Totally configurable, including Font Type, Font Size and Chart Location: Upper Left/Center/Right OR Lower Left/Center/Right, with a little twist of adjusting the Offset, just
FREE
Flux Diffuser
Flavio Javier Jarabeck
4.33 (6)
Based on Brazilian trader André Moraes' Difusor de Fluxo theory, the indicator is a more reliable version of the original MACD. It is a great confirmation indicator for Swing Trading and also can be used as a Day Trading tool. If you are not familiar with the concept or André's trading strategies, I strongly recommend his excelent book named "Se Afastando da Manada" in which he explains in detail how this indicator is used. Even if you don't know the Portuguese language it is not difficult to un
FREE
Price Momentum
Flavio Javier Jarabeck
4.92 (12)
Value Chart indicator presents the Price evolution in a new form. This indicator, Price Momentum , was developed taking all the calculations presented in the book " Dynamic Trading Indicators " by Mark W. Helweg and David Stendahl (2002). The technique involves de-trended Prices from a user-defined Period of analysis and the addition of a Volatility index correction. The result is an Oscillator with 3 zones: Fair Price Value, Overbought/Oversold and Extremely Overbought/Oversold zones. Adding th
FREE
Price Trail Chart
Flavio Javier Jarabeck
5 (2)
For those who hate candlesticks in lower timeframes (M1 through M15) we "invented" a clean new way to follow Price movement and displacement (volatility) called Price Trail Chart . The big "secret" is to get rid of those annoying candle wicks and draw the whole complete candle without them, this way we get a cleaner chart and a new view of the Price Path. No Open or Close markings, just LOW's and HIGH's, full body candle. Additionaly we inserted a Volume monitor from our Best Downloaded indicato
FREE
Waves Sizer
Flavio Javier Jarabeck
3.86 (7)
Wyckoff fans, enjoy! Ideally to be used with the Weis Waves indicator, but it can be easily used alone, the Waves Sizer puts the range (in resulting Price movement) done by the Price on its market swings. You can control how accurate or loose will be the swings. This tool is very helpful for visually know how much the Price has traveled in your Timeframe. This way you can confront this level of effort with the resulting Volume, etc... Weis Waves indicator: https://www.mql5.com/en/market/produc
FREE
Time Spaced Moving Averages
Flavio Javier Jarabeck
5 (3)
The concept is simple: Plotting Price behavior within several periods of time. Some Symbols behave very well during the trading day - with this I mean Intraday trading - and this behavior ends up plotting effectively well with the proposed Exponential Moving Averages in this indicator... Obviously that this behavior could not be seen in all Symbols, but you can give it a try... Just drop this indicator in a chart and you will see for yourself... This indicator is intended for "Feeling the Trend"
FREE
ATR Monitor
Flavio Javier Jarabeck
4.8 (5)
O ATR é uma medida de volatilidade introduzida pelo famoso autor J. Welles Wilder Jr. em seu livro "New Concepts in Technical Trading Systems". Em geral, os traders estão acostumados a ver o ATR na forma de um indicador em uma sub-janela do gráfico. O que estou apresentando aqui é uma versão simplificada do ATR - apenas contendo o número atual do ATR - muito útil para monitorar apenas o momento atual do mercado. Se você quiser monitorar vários tempos gráficos dentro do gráfico corrente, bast
FREE
Candle Zones
Flavio Javier Jarabeck
You probably heard about Candlesticks behaviors, which in most of the times could denote and trace Volume behaviors even if you are not watching Volume itself... Well, this indicator will do this. Naked traders love to rely solely on candlesticks patterns and with Candle Zones you can trap special patterns and DRAW THEM on your chart. As simple as that. There are several filters you can tweak in order to achieve the analysis you want. Just give it a try. After several months of testing, we think
FREE
ATR Monitor EA Friendly
Flavio Javier Jarabeck
ATR Monitor ATR is a measure of volatility introduced by market technician J. Welles Wilder Jr. in his book, "New Concepts in Technical Trading Systems". In general, traders are accustomed to seeing the ATR in the form of a sub-window indicator. What I am presenting here is a simplified version of ATR - just the current ATR number - very useful for monitoring just the very moment of the current chart. And, by default, this indicator will not show up on screen, you can just use the buffers thems
FREE
Arrows Cleaner
Flavio Javier Jarabeck
5 (4)
For those who use the Trading Arrows on the chart for later study, but use the Triple Screen approach and got all those arrows everywhere on all additional charts, here it is: Arrows Cleaner! Just drop it on the chart and leave it there. When needed, just with 1-click you get rid of all those annoying arrows... SETTINGS You can position the little Button on any corner of the chart. Additionally you can displace it with the Offset settings. You can enlarge or shrink its size, as well as the text
FREE
Candlestick Pattern Teller
Flavio Javier Jarabeck
5 (1)
Minions Labs' Candlestick Pattern Teller It shows on your chart the names of the famous Candlesticks Patterns formations as soon as they are created and confirmed. No repainting. That way beginners and also professional traders who have difficulties in visually identifying candlestick patterns will have their analysis in a much easier format. Did you know that in general there are 3 types of individuals: Visual, Auditory, and Kinesthetic? Don't be ashamed if you cannot easily recognize Candlesti
Economic Markers PRO
Flavio Javier Jarabeck
4 (1)
Easily get all relevant economic events of the current day right into your chart, as markers. Filter what kind of markers do you want: by country (selected individually) and by Importance (High relevance, Medium, Low or any combination of these). Configure the visual cues to your liking. Additionaly you have the ability to add up to 5 personal markers of your own agenda. With Alerts and/or with blackout periods, if you are using it within an Expert Advisor! All in one Economic Calendar indicator
Mini Chart Indicators
Flavio Javier Jarabeck
The Metatrader 5 has a hidden jewel called Chart Object, mostly unknown to the common users and hidden in a sub-menu within the platform. Called Mini Chart, this object is a miniature instance of a big/normal chart that could be added/attached to any normal chart, this way the Mini Chart will be bound to the main Chart in a very minimalist way saving a precious amount of real state on your screen. If you don't know the Mini Chart, give it a try - see the video and screenshots below. This is a gr
Market Momentum PRO
Flavio Javier Jarabeck
The Market Momentum indicator is based on the Volume Zone Oscillator (VZO), presented by Waleed Aly Khalil in the 2009 edition of the International Federation of Technical Analysts journal, and presents a fresh view of this market valuable data that is oftenly misunderstood and neglected: VOLUME. With this new approach of "seeing" Volume data, traders can infer more properly market behavior and increase their odds in a winning trade. "The VZO is a leading volume oscillator; its basic usefulness
Filtro:
Sem comentários
Responder ao comentário