Candle Close Time Ind

Contact us for any custom order, CodeYourTrade.com.

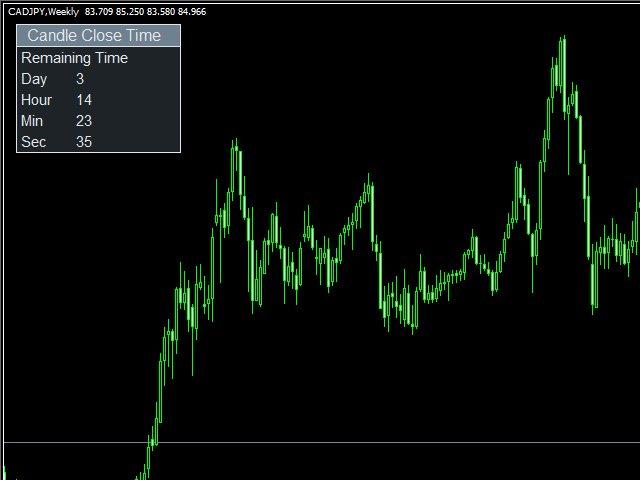
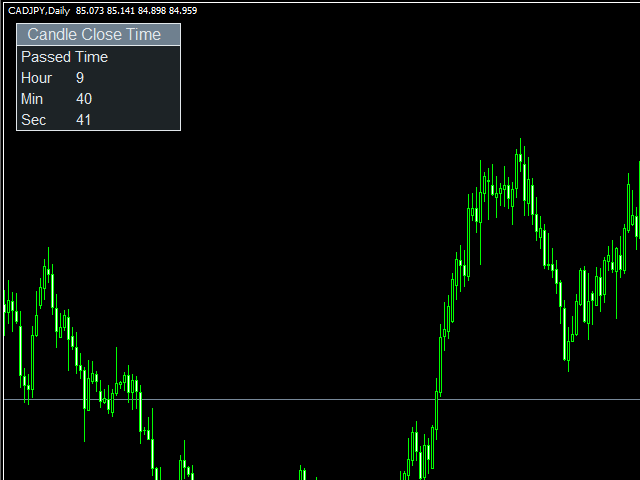
Candle Close Time indicator is used to track the time remaining or passed on a current candle at any point of time. To get notified set the time in format DD:HH:MM:SS.

For example:

EnableNotify = true & (Day Left : Hour Left : Minute Left : Second Left) = 00:02:20:20.

Let’s say remaining time to close candle is 00:03:23:21 (DD:HH:MM:SS).

Now, when the time remaining reaches below 00:02:20:20, it shows an Alert box.

You can hide all the information displayed in the chart by setting false to Show On Chart.
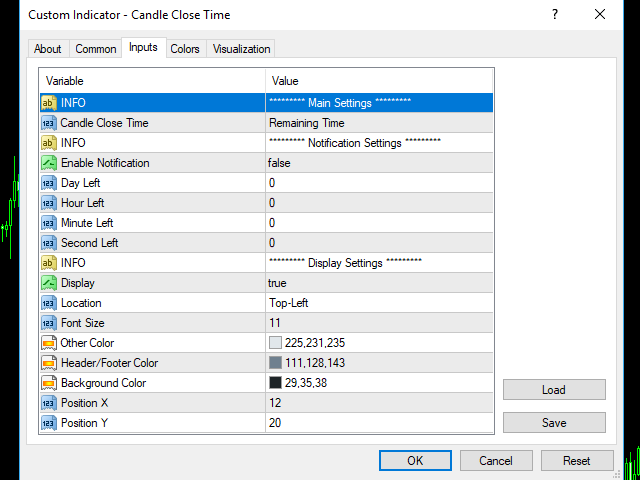
Indicator Settings:

Main Setting

  • Candle Close Time: To show the time remaining or passed on a current candle
    • Remaining Time: Shows the remaining time
    • Passed Time: Shows the passed time

Notification Setting

  • Enable Notification: Enable the notification setting
  • Day Left: Days left for notify
  • Hour Left: Hour left for notify
  • Minute Left: Minute left for notify
  • Second Left: Second left for notify

Display Setting

  • Display: Shows the indicator information on chart
  • Location: Location of the display window
    • Top-Left: Display all the details in top-left place
    • Bottom-Left: Display all the details in bottom-left place
  • Font Size: Size of the font
  • Other Color: General Color
  • Header/Footer Color: Header and footer color of display window
  • Background Color: Background color of display window
  • Position X: X-axis position of display window
  • Position Y: Y-axis position of display window
Produtos recomendados
Indicador único que implementa uma abordagem profissional e quantitativa para significar negociação de reversão. Ele capitaliza o fato de que o preço desvia e retorna à média de maneira previsível e mensurável, o que permite regras claras de entrada e saída que superam amplamente as estratégias de negociação não quantitativas. [ Installation Guide | Update Guide | Troubleshooting | FAQ | All Products ] Sinais de negociação claros Incrivelmente fácil de negociar Cores e tamanhos personalizáveis
Shark Deal Book
Philip Pankaj Suthagar
4 (3)
Term  "shark"  in the business world denotes a high volume investor who just made a good investment in a highly Potential business deal.So, sharks are the ones who make the market move. In our case, if an American shark bought a Japanese company, he/she has to convert American dollars into Japanese yen to make the deal. So, the demand for the Japanese yen will increase sharply. Thus USD/JPY will go short rapidly if the deal was from the shark. Another example, In the case of forex, if fed increa
O indicador SMC Venom Model BPR é uma ferramenta profissional para os traders que trabalham com o conceito Smart Money (SMC). Identifica automaticamente dois padrões principais no gráfico de preços: FVG   (Fair Value Gap) é uma combinação de três velas, em que existe um gap entre a primeira e a terceira velas. Forma uma zona entre níveis onde não há suporte de volume, o que geralmente leva a uma correção de preço. BPR   (Balanced Price Range) é uma combinação de dois padrões FVG que formam uma “
O indicador Crypto_Forex "Auto FIBO Pro" é uma ótima ferramenta auxiliar na negociação! - O indicador calcula e coloca automaticamente no gráfico os níveis de Fibonacci e as linhas de tendência locais (cor vermelha). - Os níveis de Fibonacci indicam áreas-chave onde o preço pode reverter. - Os níveis mais importantes são 23,6%, 38,2%, 50% e 61,8%. - Pode utilizá-lo para scalping de reversão ou para negociação de grelha de zona. - Existem muitas oportunidades para melhorar o seu sistema atual u
Super Reversal Pattern
Parfait Mujinga Ndalika
Super Reversal Pattern Indicator Unlock the power of advanced pattern recognition with our Super Reversal Pattern Indicator. Designed for traders seeking precision and reliability, this indicator identifies one of the most effective reversal patterns in technical analysis, offering a significant edge in your trading strategy. Key Features: Non-Repainting Accuracy: Enjoy the confidence of non-repainting technology. Once a Super Reversal Pattern is detected, it remains static, providing consiste
Introducing the Range Predictor : Your Ultimate Guide to Future Trading Ranges! Imagine having the power to see into the future of market moves— Range Predictor brings this dream to life. Designed to deliver real-time, predictive support and resistance levels , this tool goes beyond standard indicators, offering trend direction insights and precise range forecasts . Whether you're a day trader or a swing trader, the Range Predictor is your all-in-one toolkit for mastering the markets. MT5 Ver
This is a new strategy for SUPPLY DEMAND areas It is based on a calculation using the tick volume to detect the big price action in market for both bear /bull actions this smart volume action candles are used to determine the supply and demand areas prices in between main supply and demand lines indicate sideway market  up arrows will be shown when prices moves above the main supply and the secondary supply lines Down arrows will be shown when prices moves below the main demand and the secondary
Escalpelador de Tendências Diárias (DTS) Este indicador faz parte dos sistemas RPTrade Pro Solutions. DTS é um indicador de tendência diária usando Price Action, Dynamic Support e Resistances. Ele foi projetado para ser usado por qualquer pessoa, mesmo o iniciante absoluto na negociação pode usá-lo. NUNCA repinta. As indicações são dadas de perto para perto. Projetado para ser usado sozinho, nenhum outro indicador é necessário. Dá-lhe a tendência e potencial Take Profit no início do dia. Com
The Supply and Demand Zone Indicator is a powerful and easy-to-use tool designed to help traders identify critical supply and demand zones on the chart. These zones can provide valuable insight into potential market reversals, breakouts, and important price levels where buyers or sellers are likely to take control. The best   FREE Trade Manager . If you want to create your own Hedging or Grid strategies without any coding make sure to check out the   ManHedger Key Features: Automatic Zone Detect
FREE
Royal Dutch Skunk
Sayan Vandenhout
ROYAL DUTCH SKUNK USES THE TREND WAVE INDICATOR AND IT CAN IDENTIFY THE BEGINNING AND THE END OF A NEW WAVE TREND MOVEMENT. AS AN OSCILLATOR, THE INDICATOR IDENTIFIES THE OVERBOUGHT AND OVERSOLD ZONES. IT WORKS GREAT TO CATCH THE SHORT TERM PRICE REVERSALS AND USES A MARTINGALE STRATEGY TO CLOSE ALL TRADES IN PROFIT. USE DEFAULT SETTINGS ON H1 OR HIGHER TIME FRAME ON ANY PAIR FOR MORE ACCURATE TRADES WHY THIS EA : Smart entries calculated by 6 great strategies The EA can be run on even a $20000
PZ Harmonacci Patterns
PZ TRADING SLU
3.17 (6)
Este é sem dúvida o indicador de reconhecimento automático de formação de preço harmônico mais completo que você pode encontrar para a MetaTrader Platform. Ele detecta 19 padrões diferentes, leva as projeções de Fibonacci tão a sério quanto você, exibe a Zona de Reversão Potencial (PRZ) e encontra níveis adequados de stop loss e take-profit. [ Guia de instalação | Guia de atualização | Solução de problemas | FAQ | Todos os produtos ] Detecta 19 formações harmônicas de preços diferentes Traça
Trend Ray
Andriy Sydoruk
The indicator shows the potential trend direction by cyclical-wave dependence. Thus, all the rays of the intersection will be optimal rays, in the direction of which the price is expected to move, taking into account the indicator period. Rays can be used as a direction for potential market movement. But we must not forget that the approach must be comprehensive, the indicator signals require additional information to enter the market.
VR Cub
Vladimir Pastushak
VR Cub é um indicador para obter pontos de entrada de alta qualidade. O indicador foi desenvolvido para facilitar cálculos matemáticos e simplificar a busca por pontos de entrada em uma posição. A estratégia de negociação para a qual o indicador foi escrito tem provado a sua eficácia há muitos anos. A simplicidade da estratégia de negociação é a sua grande vantagem, o que permite que até mesmo os comerciantes novatos negociem com sucesso com ela. VR Cub calcula os pontos de abertura de posição e
RSI Speed mp
DMITRII GRIDASOV
Indicador Crypto_Forex "RSI SPEED" para MT4 - ótima ferramenta preditiva, sem necessidade de repintura. - O cálculo deste indicador é baseado em equações da física. O RSI SPEED é a primeira derivada do próprio RSI. - O RSI SPEED é bom para entradas de scalping na direção da tendência principal. - Use-o em combinação com um indicador de tendência adequado, por exemplo, HTF MA (como nas imagens). - O indicador RSI SPEED mostra a rapidez com que o próprio RSI muda de direção - ele é muito sensíve
Trend Flasher Trend is your friend is the age old saying quote in trading arena, there are though many ways to gauge the trend and its direction, more scientific measure and logically meaningful will be an ATR break outs to identify and spot the trend and its acceleration, so we created this easy to use trend identification panel and optimized super trend based multi time frame panel entry system to aid and help the traders to make their trading decision. Unique Features of Trend Flasher 1. H
Indicador Crypto_Forex "Morning Star pattern" para MT4. - O indicador "Morning Star pattern" é um indicador muito poderoso para negociação de Price Action: sem repintura, sem atraso. - O indicador detecta padrões Morning Star otimistas no gráfico: sinal de seta azul no gráfico (veja as imagens). - Com alertas para PC, celular e e-mail. - Também seu irmão - o indicador bearish "Evening Star pattern" está disponível (siga o link abaixo). - O indicador "Morning Star pattern" é excelente para comb
We present you the indicator "Candle closing counter", which will become your indispensable assistant in the world of trading. That’s why knowing when the candle will close can help: If you like to trade using candle patterns, you will know when the candle will be closed. This indicator will allow you to check if a known pattern has formed and if there is a possibility of trading. The indicator will help you to prepare for market opening and market closure. You can set a timer to create a pre
Delta Pairs
Anatolii Zainchkovskii
Delta Pairs is an indicator for pair trading, it displays the divergence of two currency pairs. Does not redraw. A useful tool for the analysis of the behavior of two currency pairs relative to each other. Purpose The Delta Pairs indicator is designed for determining the divergences in the movements of two currency pairs. This indicator is displayed as two line charts and the difference (delta) between these charts in the form of a histogram. The Delta Pairs indicator will be useful for those w
EARLY REMINDER: The Starting price is 65 price will rise soon up to 365$ and then 750$ after first 10 copies of sales. Grab this offer now! Introduction Hello, traders! Welcome to the demonstration of the Forex Beast Indicator , a comprehensive tool designed to assist aspiring traders in navigating the complexities of the forex market. This indicator incorporates seven essential components to provide a well-rounded trading experience: Moving Averages Colored Zones Support and Resistance Levels
KT Renko Patterns MT4
KEENBASE SOFTWARE SOLUTIONS
2.33 (3)
O KT Renko Patterns analisa o gráfico Renko tijolo por tijolo para identificar padrões gráficos conhecidos que são amplamente utilizados por traders em diversos mercados financeiros. Em comparação com gráficos baseados em tempo, os gráficos Renko tornam a identificação de padrões muito mais fácil e visualmente clara, graças à sua aparência limpa e objetiva. O KT Renko Patterns possui vários padrões Renko, muitos dos quais são explicados com profundidade no livro "Profitable Trading with Renko
Price Magnet — Price Density and Attraction Levels Indicator Price Magnet is a professional analytical tool designed to identify key support and resistance levels based on statistical Price Density. The indicator analyzes a specified historical period and detects price levels where the market spent the most time. These zones act as “magnets,” attracting price action or forming a structural base for potential reversals. Unlike traditional Volume Profile tools, Price Magnet focuses on price-time d
This EA is an extension for the free trade indicator Trend Mate . https://www.mql5.com/en/market/product/50082 The main idea is to support your decision to  trade  according to the current trend. It is possible to configure alert and push notification to receive when entering to first candle for bull / bear trend. For this extension of the free indicator now it is possible to filter the current trend info with other timeframes. For example show trend for timeframe M5 considering also timeframe
Happy Scalping Indicator
Leandro Bernardez Camero
Este indicador foi projetado para scalping agressivo e entradas rápidas em opções binárias , gerando sinais em toda vela , para que você saiba exatamente o que está acontecendo o tempo todo. Junte-se ao canal Happy Scalping: MQL5 Não repinta : o sinal da vela atual é gerado em TEMPO REAL , o que significa que pode mudar enquanto a vela ainda está em formação, dependendo se o preço sobe ou desce em relação ao fechamento da vela anterior. Mas uma vez que a vela fecha , a cor do sinal fica comple
ForexGumpXL
Andrey Kozak
5 (1)
ForexGumpXL é uma nova geração na linha de indicadores forex gump. Mais preciso, mais rápido, menos complicado nas configurações é tudo sobre o novo indicador ForexGumpXL. Na nova versão do indicador, aplicamos um algoritmo de trabalho verdadeiramente novo. Agora ele não apenas analisa o mercado para uma reversão de preços, mas com a ajuda de um algoritmo de adaptação, determinar a volatilidade atual no indicador de mercado com um alto grau de probabilidade é capaz de antecipar falsas reversões
Indicador. "Onda indicadora ou Indicador Ma". Usando 23 indicadores padrão e o algoritmo do autor, os níveis de compras (de 0 a +100) e vendas (de 0 a -100) são calculados. Em seguida, usando os níveis calculados, o "Indicador de onda" desenha uma onda com 21 médias móveis. O número da onda é igual ao período médio dos níveis calculados. Ondas # 1 - 7 médias móveis rápidas Ondas das médias móveis 8 -14 médias Ondas das médias móveis lentas nº 15-21 Olhando para os números desenhados pelo indi
MajorAlert
Sergei Vassunov
MajorAlert - is a professional trading indicator for MetaTrader 4 that combines two distinct market analysis approaches into one powerful tool. By integrating a counter‑trend entry logic (upper block) with a trend‑following filter (lower block), the indicator generates high‑probability signals on the chart with clearly separated arrow colors. Key Features Fully self‑contained   – no external indicators required; all calculations are built‑in. Versatile inputs   – adjust all parameters to suit a
Daily Candle Predictor é um indicador que prevê o preço de fechamento de uma vela. O indicador destina-se principalmente ao uso em gráficos D1. Este indicador é adequado tanto para negociação forex tradicional quanto para negociação de opções binárias. O indicador pode ser usado como um sistema de negociação autônomo ou pode atuar como um complemento ao seu sistema de negociação existente. Este indicador analisa a vela atual, calculando certos fatores de força dentro do próprio corpo da vela, be
Gyroscopes
Nadiya Mirosh
Gyroscope        professional forex expert   (for EURUSD, GBPUSD, USDJPY, AUDUSD, USDCHF, EURGBP, EURJPY, NZDUSD, USDCAD, EURCHF, AUDJPY, CADJPY pairs)   alyzing the market using the Elliot Wave Index. Elliott wave theory is the interpretation of processes in financial markets through a system of visual models (waves) on price charts. The author of the theory, Ralph Elliott, identified eight variants of alternating waves (of which five are in the trend and three are against the trend). The mov
Trade History Drawer
David Leander Tschacher
Trade History Drawer is an indicator for MetaTrader 4. It shows trades on the chart and draws them in customized colors. Furthermore, the indicator shows a trade summary and saves a CSV history file for either one selected pair or all pairs. Inputs General Settings Number Trades : Number of trades to be drawn on the chart, if -1 then all trades Magic Number : Only trades with this magic number, if -1 then ignore Line Style : Line Style Line Thickness : Line Thickness Arrow Size : Arrow Size
Please follow the "How To Trade" instructions exactly for best results Wycoff theory is vastly used by institutional traders but when it comes to retail traders the concept isn't well understood by most. It is even more difficult to implement in intraday & swing trading. This No REPAINT indicator helps you in analyzing the market cycles and plots buy/sell signals at the start of trending phase. It studies the market strength of bulls and bears and does a effort Vs reward matrix calculation befor
Os compradores deste produto também adquirem
Gann Made Easy
Oleg Rodin
4.83 (162)
Gann Made Easy é um sistema de negociação Forex profissional e fácil de usar, baseado nos melhores princípios de negociação usando a teoria do sr. W. D. Gann. O indicador fornece sinais precisos de COMPRA e VENDA, incluindo níveis de Stop Loss e Take Profit. Você pode negociar mesmo em movimento usando notificações PUSH. Entre em contato comigo após a compra para receber instruções de negociação e ótimos indicadores extras gratuitamente! Provavelmente você já ouviu muitas vezes sobre os métodos
The Propfolio Master Suite is the ultimate all-in-one analytical workstation for professional traders. Combining the power of the Beat The Market Maker (BTMM) methodology, Smart Money Concepts (SND/Liquidity), and Advanced Volume Profile, this suite replaces multiple different indicators with one optimized engine. Monitor up to 14 pairs simultaneously from a single chart, instantly identify market cycles, and seamlessly map institutional footprints with the click of a button. The Command Center
M1 Sniper
Oleg Rodin
5 (23)
O M1 SNIPER é um sistema indicador de negociação fácil de usar. É um indicador de seta projetado para o período M1. O indicador pode ser usado como um sistema independente para scalping no período M1 e pode ser usado como parte do seu sistema de negociação existente. Embora este sistema de negociação tenha sido projetado especificamente para negociação no M1, ele também pode ser usado em outros períodos. Originalmente, desenvolvi este método para negociar XAUUSD e BTCUSD. Mas considero-o útil ta
Auto Optimized Parabolic RSI: Avançado Motor de Momentum 3D A maioria dos indicadores de varejo falha porque depende de parâmetros estáticos que quebram no momento em que a volatilidade do mercado muda. O Auto Optimized Parabolic RSI resolve o problema de "obsolescência do indicador" recalculando continuamente a sua própria vantagem matemática, trazendo uma adaptação quantitativa de nível institucional diretamente para o seu terminal MT5. A Vantagem Principal: Otimização 3D em Memória Personaliz
Scalper Inside PRO
Alexey Minkov
4.74 (69)
Scalper Inside PRO – Since 2020. An exclusive indicator that utilizes an innovative algorithm to swiftly and accurately determine the market trend. The indicator automatically calculates opening, closing, and profit levels, providing detailed trading statistics. With these features, you can choose the most appropriate trading instrument for the current market conditions. Additionally, you can easily integrate your own arrow indicators into Scalper Inside Pro to quickly evaluate their statistics
O sistema PRO Renko é um sistema de negociação altamente preciso especialmente concebido para a negociação de gráficos RENKO. Trata-se de um sistema universal que pode ser aplicado a vários instrumentos de negociação. O sistema neutraliza eficazmente o chamado ruído de mercado, dando-lhe acesso a sinais de inversão precisos. O indicador é muito fácil de usar e tem apenas um parâmetro responsável pela geração de sinal. Você pode facilmente adaptar a ferramenta a qualquer instrumento de negocia
Quants HL Break
Ferhat Mutlu
5 (2)
Cálculo avançado feito por pura ação de preço para encontrar breakouts LH e HL. Isso lhe dará ótimos pontos de reversão no mercado. Os sinais LH e HL também podem ser usados ​​para os rompimentos do traingle. Uma vez que o rompimento acontece, ele indica uma forte reversão. Bom filtro para médias móveis. Eu sugiro usar isso com indicadores de tendência. Pode ser usado como uma confirmação extra para suporte e resistência, indicadores de oferta e demanda. Mais detalhes podem ser encontrados no
Quantum Breakout Indicator PRO
Bogdan Ion Puscasu
4.96 (26)
Apresentando       Quantum Breakout PRO   , o inovador Indicador MQL5 que está transformando a maneira como você negocia Breakout Zones! Desenvolvido por uma equipe de traders experientes com experiência em negociação de mais de 13 anos,   o Quantum Breakout PRO   foi projetado para impulsionar sua jornada comercial a novos patamares com sua estratégia inovadora e dinâmica de zona de rompimento. O Quantum Breakout Indicator lhe dará setas de sinal em zonas de breakout com 5 zonas-alvo de lucro
RFI levels PRO
Roman Podpora
5 (1)
O indicador mostra com precisão os pontos de reversão e as zonas de retorno de preço onde o   Principais players . Você identifica onde novas tendências estão se formando e toma decisões com máxima precisão, mantendo o controle sobre cada negociação. VERSION MT5     -     Revela seu potencial máximo quando combinado com o indicador   TREND LINES PRO. O que o indicador mostra: Estruturas de reversão e níveis de reversão com ativação no início de uma nova tendência. Exibição dos níveis de   TAKE
O Apollo SR Master é um indicador de Suporte/Resistência com recursos especiais que tornam a negociação com zonas de Suporte/Resistência mais fácil e confiável. O indicador calcula as zonas de Suporte/Resistência em tempo real, sem qualquer atraso, detectando topos e fundos de preço locais. Em seguida, para confirmar a área de Suporte/Resistência recém-formada, o indicador exibe um sinal especial que indica que a zona pode ser considerada e usada como um sinal de VENDA ou COMPRA. Nesse caso, a f
Se você comprar este indicador, receberá meu Gerenciador de Operações Profissional   + EA  GRATUITAMENTE. Primeiramente, vale ressaltar que este Sistema de Trading é um Indicador Não Repintado, Não Redesenho e Não Atrasado, o que o torna ideal tanto para o trading manual quanto para o automatizado. Curso online, manual e download de predefinições. O "Sistema de Trading Inteligente MT5" é uma solução completa de trading projetada para traders novos e experientes. Ele combina mais de 10 indicador
ACTUALMENTE COM 40% DE DESCONTO A melhor solução para qualquer novato ou comerciante especializado! Este Indicador é uma ferramenta comercial única, de alta qualidade e acessível, porque incorporámos uma série de características proprietárias e uma nova fórmula. Com apenas UM gráfico, pode ler a força da moeda para 28 pares de Forex! Imagine como a sua negociação irá melhorar porque é capaz de apontar o ponto exacto do gatilho de uma nova tendência ou oportunidade de escalada? Manual do util
Sinal de tendência GoldRush Arrow O indicador Sinal de tendência GoldRush Arrow fornece uma análise precisa e em tempo real das tendências, adaptada para scalpers de alta velocidade e curto prazo em XAU/USD. Criada especificamente para o intervalo de tempo de 1 minuto, esta ferramenta exibe setas direcionais para pontos de entrada claros, permitindo que os scalpers naveguem em condições de mercado voláteis com confiança. O indicador consiste em setas de alerta PRIMÁRIAS e SECUNDÁRIAS. Os sin
Day Trader Master é um sistema de negociação completo para day traders. O sistema é composto por dois indicadores. Um indicador é um sinal de seta para comprar e vender. É o indicador de seta que você obtém. Eu fornecerei o segundo indicador gratuitamente. O segundo indicador é um indicador de tendência especialmente projetado para ser usado em conjunto com essas setas. OS INDICADORES NÃO SE REPETEM E NÃO SE ATRASAM! A utilização deste sistema é muito simples. Você só precisa seguir os sinais de
Market Structure Patterns MT4
Samuel Manoel De Souza
5 (18)
Market Structure Patterns   é um indicador baseado em   smart money concepts   que apresenta elementos de   SMC/ICT   capazes de elevar suas decisões de negociação a um novo patamar. Aproveite os   alertas ,   notificações   push   e   mensagens  por  e-mail   para ser informado sobre quando um elemento se forma no gráfico, o preço cruza um nível e/ou entra em uma região delimitada por uma retângulo. Desenvolvedores podem acessar valores dos elementos do indicador por meio de   variáveis globais
Advanced Supply Demand
Bernhard Schweigert
4.91 (300)
Atualmente com 40% de desconto! A melhor solução para qualquer Trader Novato ou especialista! Este indicador é uma ferramenta de negociação exclusiva, de alta qualidade e acessível porque incorporamos uma série de recursos proprietários e uma nova fórmula. Com esta atualização, você poderá mostrar fusos horários duplos. Você não só será capaz de mostrar um TF mais alto, mas também mostrar ambos, o TF do gráfico, MAIS o TF mais alto: MOSTRANDO ZONAS ANINHADAS. Todos os traders de Oferta e Demanda
CRT Candle Range Theory HTF MT4.   Ultimate CRT Indicator: Advanced ICT Concepts and Malaysian SnR Trading System Discounted   Price   $50  !!     Secure your lifetime access   now   before it switches to   subscription-only ! Master the Market Maker's Footprints with the Most Advanced Candle Range Theory Indicator Unlock the true power of   Smart Money Concepts (SMC)   and trade precisely like the institutions with the   Ultimate CRT Indicator . Built exclusively for serious traders, this indic
Este indicador examina a estrutura de preços de fractais de diferentes períodos para determinar possíveis pontos de reversão no mercado, proporcionando tempo aos traders posicionais que já possuem um modelo de avaliação fundamental ou técnico. Diferentemente de seu irmão mais novo, Reversal Fractals , esse indicador não perde reversões por causa do período selecionado e encontra fractais de reversão em zigue-zague, ignorando as reversões que não possuem impulso suficiente para iniciar um movime
O indicador " Dynamic Scalper System " foi desenvolvido para o método de scalping, operando dentro de ondas de tendência. Testado nos principais pares de moedas e ouro, é possível a compatibilidade com outros instrumentos de negociação. Fornece sinais para a abertura de posições de curto prazo ao longo da tendência, com suporte adicional para o movimento dos preços. O princípio do indicador: As setas grandes determinam a direção da tendência. Um algoritmo para gerar sinais de scalping sob a fo
Se você negocia Forex, ter informações detalhadas sobre a força das moedas e a correlação entre os pares pode levar suas operações a um novo patamar. A correlação ajudará a reduzir o risco pela metade, enquanto a análise de força ajudará a maximizar os lucros. Este indicador oferece uma abordagem híbrida para selecionar os pares de moedas mais adequados, combinando análise de força e correlação entre pares de moedas. Como usar a Análise de Força das Moedas Suponha que sua estratégia de negociaç
ACTUALMENTE COM 26% DE DESCONTO!! Este indicador é uma super combinação dos nossos dois principais indicadores ( Advanced Currency Strength 28   &  Advanced Currency IMPULSE with ALERT ). Mostra valores de Força da Moeda para TICK-UNITS e sinais de alerta para 28 pares de Forex. Podem ser usadas 11 Tick-Units diferentes. Estas são 1, 2, 3, 4, 5, 6, 10, 12, 15, 20, e 30 segundos. A barra de Tick-Unit na sub-janela será mostrada e deslocada para a esquerda quando houver pelo menos 1 tick dentro
KURAMA GOLD SIGNAL PRO (MT4) — Sistema Completo de Trading XAUUSD com Filtro de 7 Camadas, TP/SL Automático e Pontuação de Qualidade SEM REPINTURA. SEM REDESENHO. SEM ATRASO. Cada sinal é permanente. O que você vê é o que recebe. BÔNUS: Compre a licença vitalícia e receba AI Zone Radar (valor $59) + manual PDF completo GRÁTIS. Me envie uma mensagem após a compra. AI Zone Radar: https://www.mql5.com/en/market/product/175834 CONFIADO POR TRADERS: Já utilizado por uma comunidade ativa de trader
Um padrão de cabeça e ombros é uma formação de gráfico que se assemelha a uma linha de base com três picos, os dois externos têm altura próxima e o meio é o mais alto. Ele prevê uma reversão de tendência de alta para baixa e acredita-se ser um dos padrões de reversão de tendência mais confiáveis. É um dos vários padrões principais que sinaliza, com diferentes graus de precisão, que uma tendência está chegando ao fim. [ Guia de instalação | Guia de atualização | Solução de problemas | FAQ | Todo
Atomic Analyst
Issam Kassas
5 (5)
Primeiramente, vale ressaltar que este Indicador de Negociação não repinta, não redesenha e não apresenta atrasos, tornando-o ideal tanto para negociação manual quanto automatizada. Manual do utilizador: configurações, entradas e estratégia. O Analista Atômico é um Indicador de Ação de Preço PA que utiliza a força e o momentum do preço para encontrar uma vantagem melhor no mercado. Equipado com filtros avançados que ajudam a remover ruídos e sinais falsos, e aumentam o potencial de negociação.
PZ Double Top Bottom
PZ TRADING SLU
5 (1)
Esse indicador encontra padrões duplos de reversão superior e dupla e gera sinais de negociação usando breakouts. [ Guia de instalação | Guia de atualização | Solução de problemas | FAQ | Todos os produtos ] Sinais de negociação claros Cores e tamanhos personalizáveis Implementa estatísticas de desempenho Níveis personalizáveis de retração de fibonacci Ele exibe níveis adequados de stop-loss e take-profit Implementa alertas de email / som / visuais Esses padrões podem se expandir e o indicado
Gold Scalper Super
Aleksandr Makarov
5 (2)
Gold Scalper Super is an easy-to-use trading system. The indicator can be used as a standalone scalping system on the M1 time frame, as well as part of your existing trading system. Bonus: when purchasing an indicator, Trend Arrow Super is provided free of charge, write to us after purchase. The indicator 100% does not repaint!!! If a signal appears, it does not disappear! Unlike indicators with redrawing, which lead to the loss of a deposit, because they can show a signal and then remove it.
Um indicador técnico que estrutura gráficos e identifica movimentos cíclicos de preços. Pode funcionar em qualquer gráfico. Vários tipos de notificações. Existem setas adicionais no próprio gráfico. Sem redesenhar a história, trabalha no fecho da vela. TF recomendado a partir de M5 e superior. Parâmetros fáceis de utilizar e configurar. Ao utilizar 2 indicadores com parâmetros diferentes, pode utilizá-los sem outros indicadores. Tem 2 parâmetros de entrada Ciclicidade e duração do sinal Estes
KuKl
IGOR KIRIANEN
The indicator is built on a non-standard Zig Zag, it draws accumulations after which if the price leaves this zone and a test of this zone occurs, then a sound signal is given and an arrow appears - after the test candle closes.The indicator does not redraw its signals, it is very easy to use, there are only three settings 1- this is the zig zag parameter 2- this is the minimum price exit from the zone 3- this is the maximum price exit from the zone. The lower the parameter for Zig Zag, the more
Trend Screener
STE S.S.COMPANY
4.79 (95)
Indicador de tendência, solução única inovadora para negociação e filtragem de tendências com todos os recursos de tendências importantes construídos dentro de uma ferramenta! É um indicador multi-timeframe e multi-moedas 100% sem repintura que pode ser usado em todos os símbolos/instrumentos: forex, commodities, criptomoedas, índices e ações. OFERTA POR TEMPO LIMITADO: O indicador Support and Resistance Screener está disponível por apenas US$ 65 vitalício. (Preço original US$ 250) (oferta esten
Advanced UT BOT ALERTS for MT4 Sistema profissional de detecção de tendência com múltiplos filtros | Motor UT BOT aprimorado Nós fornecemos apenas indicadores de alta qualidade. Advanced UT BOT foi desenvolvido para uso profissional, com lógica de sinal estável e cálculo seguro que evita atrasos ou atualizações incorretas. Ele não redesenha, remove nem altera sinais passados. Todos os sinais de BUY e SELL são gerados somente após o fechamento da vela , garantindo estabilidade e precisão. No modo
Mais do autor
This indicator provides the technical overview using following tools: Pivot Points Technical Indicators Moving Averages Pivot Points are calculated using five different methods: Classic Fibonacci Camarilla Woodie DeMark With the technical indicator , you can find the trading signals using the combination of different indicators. It supports the following technical indicators: RSI Stochastic Stochastic RSI MACD ADX CCI ATR Ultimate Oscillator ROC Bull/Bear Power Moving Averages is used to find th
Contact us for any custom order,   CodeYourTrade.com . Channel Breakout indicator shows the channels based on the number of bars. It is used to trades the breakouts or reversals. Breakout is quite efficient, since it tries making profit when the market crashes!! You can also invent your own technique out of it. After you attach the indicator to a chart it will show the following information on the chart: 1.     Channel 1 and channel 2 information 2.     Alert and email information   You can hid
Continuous Bars indicator is used to track the continuous bars closed in one direction. For example : Continuous Bars = 3 (we are looking for 3 continuous bars) Now, if (Open > Close) or (Close > Open) for 3 continuous bars it is notified via email or alert. You can hide all the information displayed in the chart by setting  false  to  Show On Chart . Indicator Settings: Main Setting Bars : Number of continuous bars we are looking Price Setting Use M1 Timeframe: Look for continuous bars in M1 ti
Contact us for any custom order,   CodeYourTrade.com . Currency Sessions Highlight indicator is used to highlight the sessions. The maximum number of sessions visible at a time is 3. A user has to input the input the start and end time of the session in the format HH:MM. You can hide all the information displayed in the chart by setting  false  to  Show On Chart . Indicator Settings: Main Setting Show Session 1 : Draw Session 1 on chart or not Session 1 Start : Start time of the session 1 Sessi
Contact us for any custom order,   CodeYourTrade.com . Keltner Channels are volatility-based envelopes. Moving average dictates direction and the ATR sets the channel width. It’s a trend following indicator used to identify reversals. Channels can also be used to identify overbought and oversold levels when the trend is flat. Trading Strategy We have created 2 zones SELL ZONE and BUY ZONE using the Keltner channels. In SELL ZONE (upper) we take only sell orders and in BUY ZONE (lower) we take
Contact us for any custom order,   CodeYourTrade.com . The MACD Histogram measures the distance between the MACD line and the MACD signal line. Two important terms are derived from the MACD histogram are: ·          Convergence : The MACD histogram is shrinking in height. This occurs because there is a change in direction or a slowdown in the trend. When that occurs, the MACD line is getting closer to the MACD signal line. ·          Divergence : The MACD histogram is increasing in height (eith
Contact us for any custom order,   CodeYourTrade.com . Multiple Moving Average (MA) indicator is used to find the direction of the trend using multiple Moving Average indicators. It calculates using the following rules: ·          Ask < MA, it is SELL ·          Bid > MA, it is BUY ·          Ask > MA > Bid, it is None (no signal) After you attached the indicator to a chart it will show the following information on the chart: Multiple MAs arranged by their method Buy and Sell count Summary: Con
Contact us for any custom order,   CodeYourTrade.com . This indicator is used to calculate the pivot points using 5 different methods: Classic Fibonacci Camarilla Woodie DeMark After you attached the indicator to a chart it will show the following information on the chart: Pivot points levels of the current chart using different methods. Indicator Setting Pivot Point Calculator Show Pivot Point Calculator: Show all pivot points on chart Pivot Points Timeframe: It tells which time is used to cal
Contact us for any custom order,   CodeYourTrade.com . The Stochastic RSI indicator is essentially an indicator of an indicator. It is used in technical analysis to provide a stochastic calculation to the RSI indicator. This means that it is a measure of RSI relative to its own high/low range over a user-defined period of time. This indicator is primarily used for identifying overbought and oversold conditions. You can hide all the information displayed in the chart by setting  false  to  Show
Spread & Swap Indicator is used to check the spread and swap for the current pair. You can hide all the information displayed in the chart by setting  false  to  Show On Chart . Indicator Settings: Main Setting Display Spread : Shows the spread of the current pair. Display Swap (per lot) : Show the swap charges per lot for the current pair. Display Setting Display : Shows the indicator information on chart Location : Location of the display window Top-Left : Display all the details in top-left p
With the Technical Analysis indicator, you can find the trading signals using the combination of different technical indicators. It supports the following technical indicators: 1.     RSI 2.     Stochastic 3.     Stochastic RSI 4.     MACD 5.     ADX 6.     CCI 7.     ATR 8.     Ultimate Oscillator 9.     ROC 10.   Bull/Bear Power After you attached the indicator to a chart it will show the following information on the chart: 1.     Technical indicators, their values and the signal generated fro
Contact us for any custom order,   CodeYourTrade.com . With the Technical Indicator Multi-Timeframe, you can easily identify the oversold/overbought levels or buy/sell levels points on several different timeframes by using only one chart. You can confirm Short Term trades by higher timeframe Levels. It supports 4 technical indicators as of now Stochastic, RSI, Parabolic SAR & Heiken Ashi. After you attached the indicator to a chart it will show the following information on the chart: Timeframe:
Contact us for any custom order,   CodeYourTrade.com . Trade Notifier indicator is used to notify opening or closing of the trades via email or alert. It can also send regular trade updates via email. After you attached the Indicator to a chart, it will show the following information on the chart: 1.     Alert information 2.     Email information 3.     Details to include in email body You can hide all the information displayed in the chart by setting  false  to  Display . Indicator Settings Al
Contact us for any custom order,   CodeYourTrade.com . Trend Direction indicator finds the direction of the trend using 2 indicators ADX and Parabolic SAR. Change the color of the Sell and Buy strength from the Colors tab in indicator settings. After you attached the indicator to a chart it will show the following information on the chart: 1.     Parabolic SAR: Input values of Parabolic SAR Indicator 2.     ADX: Input values of ADX Indicator 3.     Trend Strength: Direction of the trend
Contact us for any custom order,   CodeYourTrade.com . Martingale EA is a multicurrency Expert Advisor using martingale or grid technique to trade the market. Trading strategy: Manual Entry + Automated Trade Management Manual Entry : User can input the starting trade type in the EA based on their analysis. The EA has no intelligence of its own to decide the entry trade type. Intelligence can be added in the EA upon request. Automated Trade Management : It manages the trade using martingale or gr
Contact us for any custom order, CodeYourTrade.com . Timed Close EA is used to close all the trades automatically at your specific time. You can set the EA using any of the 3 options: 1.     OneTime: In this option EA will run only once. Execute at that date-time and stops. 2.     Weekly: In this option EA will run at specific day-time every week. For example if you wanted to close all the trades before market close at Friday, you can use this option. 3.     Daily: In this option EA will run da
Straddle EA
HITESH ARORA
5 (2)
Contact us for any custom order,   CodeYourTrade.com . The main use of Straddle EA is to trade at the major fundamental news events. It opens 2 pending orders Buy Stop and Sell Stop to capture the market single direction movements at the time of news. The EA will run from "News Time – Seconds before News Time" to "Expiration Time". These are the sequence of states in the EA: Waiting : Before "News Time – Seconds before News Time". The EA is waiting to start. Passed : The EA started and trade ex
Contact us for any custom order,   CodeYourTrade.com . Profit and Loss Manager EA is to close the running or pending trades when reached to a specified profit or loss. EA works fully on virtual mode i.e. no hard Stop Loss or Take profit set. You can run the EA in any of the 3 modes: 1.     Per Trade : In this mode, actions are applied to all the trades separately. Rules are applied on a single trade separated, it’s profits/loss not combined with any other trades. 2.     Per Pair : In this mode
Contact us for any custom order,   CodeYourTrade.com . Partial Close EA is used to partially close running trades. EA has an option to filter out the trades and works only on specific trades. Following are the filters for the EA: 1.     Magic Number: Have an option to works on all orders with the given magic number 2.     Order Number: Can work specifically on the single order with the given order number 3.     Chart: Can work for all the trades of the current attached chart Example : Let’s say
Contact us for any custom order,   CodeYourTrade.com . Brent Wti spread indicator shows the difference of Brent and Wti value. Trading Strategy: Identify the range of spread movement. To buy the difference execute these 2 trades “Buy BRENT and Sell WTI” To sell the difference execute these 2 trades “Sell WTI and Buy BRENT”   Indicator Settings: Main Setting Indicator Maximum : Maximum level to show in indicator Indicator Minimum : Minimum level to show in indicator Brent Symbol Name : Symbol na
Filtro:
Sem comentários
Responder ao comentário