Price Data Record into EXCEL per Tick

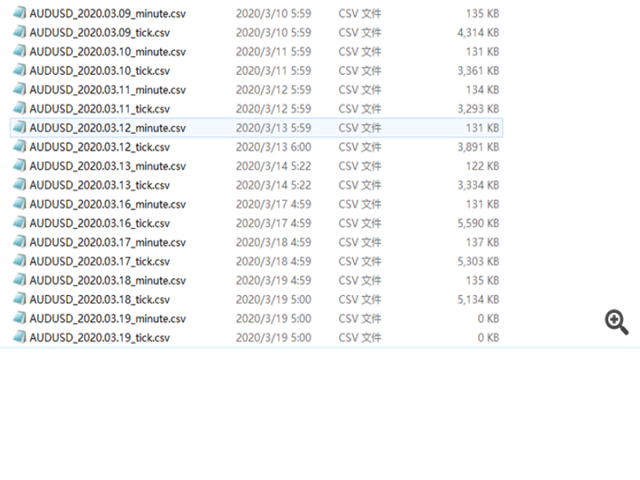
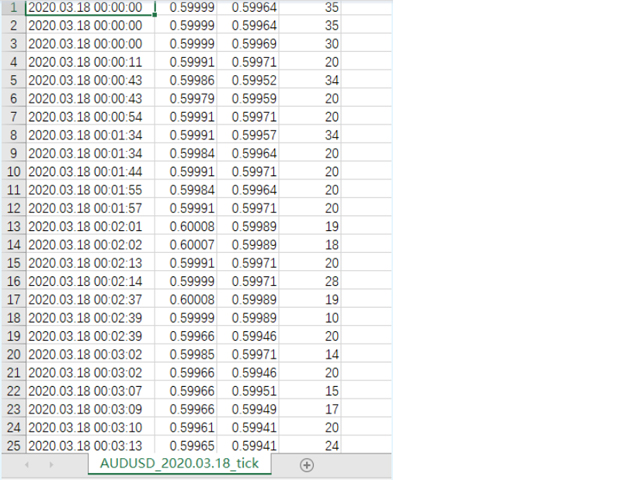
1. Record the price data for each Tick transaction.

Data file contents: "Tick time", "ASK price", "BID price", "SPREAD SPREAD", "Tick quoted quantity".

2. Meanwhile, generate a quotation data file with a 1-minute period.

Content of 1min data file: "ASK time", "ASK OPEN price", "ASK HIGH price", "ASK LOW price", "ASK CLOSE price", "BID time", "BID OPEN price", "BID HIGH price", "BID LOW price", "BID CLOSE price", "Tick quoted quantity".

3. Save all quotation data in one file every day, which is convenient for users to conduct data analysis and data sorting.

4. This EA program, any time it is loaded into the MT5 chart, can directly start the recording of price data.Be sure to record every quote that appears in the market.

5.File storage location: MQL4/Files/
Produtos recomendados
VP hidden
Emr Aljnaby
4.33 (12)
The indicator works to convert normal volume into levels and determine financial liquidity control points. It is very similar in function to Fixed Volume Profile. But it is considered more accurate and easier to use than the one found on Trading View because it calculates the full trading volumes in each candle and in all the brokers present in MetaTrade, unlike what is found in Trading View, as it only measures the broker’s displayed prices. To follow us on social media platforms: telegram
FREE
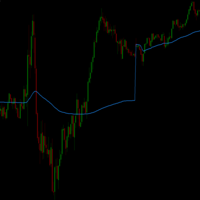
THV Daily VWAP MT5 – Daily Volume Weighted Average Price THV Daily VWAP MT5 is a technical indicator designed to display the Daily Volume Weighted Average Price (VWAP) directly on your MetaTrader 5 chart. Unlike traditional VWAP indicators that may only display limited session data or reset at specific trading sessions, this indicator plots a continuous VWAP line throughout the trading day, making it easy to observe how price behaves relative to the daily volume-weighted average price. The VWAP
FREE
Neon Profile
Manuel Fernandez Barranco
XBK Neon Profile MT5 Developed by XBK Systems. XBK Neon Profile is an advanced technical indicator for MetaTrader 5 that combines smoothed trend analysis and a dynamic volume profile within a single chart window. The indicator is designed to provide a clear view of market structure and significant volume levels without cluttering the screen. Key Features Smoothed Trend Bands (Neon Trend Bands) Identifies the current trend direction using a custom smoothing algorithm designed to filter out market
FREE
HTF Candles Nika sobrepõe velas em tamanho real de qualquer timeframe superior diretamente no gráfico atual do MetaTrader 5, oferecendo uma visão multi-timeframe sem sair do gráfico. Funcionalidades principais - Desenha velas do timeframe superior como retângulos preenchidos com pavios no gráfico atual - Suporta modos de exibição: velas padrão e Heiken Ashi - Temporizador de contagem regressiva em tempo real até o fechamento da vela HTF atual - Cores personalizáveis para velas de alta e de bai
FREE
Smart FVG Stats
- Md Rashidul Hasan
5 (1)
The  Smart FVG Statistics Indicator  is a powerful MetaTrader 5 tool designed to automatically identify, track, and analyze Fair Value Gaps (FVGs) on your charts. Love it? Hate it? Let me know in a review! Feature requests and ideas for new tools are highly appreciated. :) Try "The AUDCAD Trader": https://www.mql5.com/en/market/product/151841 Key Features Advanced  Fair Value Gap  Detection Automatic Identification : Automatically scans for both bullish and bearish FVGs across specified histo
FREE
(Special New Year promotion - free price!) The indicator displays the actual 'Scale in points per bar' (identical to the manual setting in the Terminal, see screenshot) in the upper right corner of the chart. The displayed value changes INSTANTLY whenever the chart scale is changed! (This is very convenient when planning screenshots). In Settings: Change language (Russian/English), font size of the displayed text, text label offset coefficient from the graph corner, equally in X and Y directi
FREE
Mirror Chart MT5
Andrej Hermann
5 (1)
The Mirror Chart MT5 is a overlay indicator specifically designed to project a second financial instrument directly onto the main chart window. This tool is invaluable for traders who rely on correlation analysis, as it visualizes the price movements of two different instruments in real time. Unlike traditional overlays, this indicator utilizes intelligent, dynamic centering and scaling logic. It continuously analyzes the visible price range in the current window for both symbols and calculates
FREE
Fixed Volume Profile
Carlos Pascual Perez Maturano
This indicator, titled "Fixed Volume Profile.mq5", is a custom tool for MetaTrader 5 (MQL5) designed to calculate and display a Volume Profile over a user-defined fixed time range. The Volume Profile shows the distribution of trading volume at different price levels during a specific period, helping to identify areas of high activity (such as Points of Control or POCs) and volume-based support/resistance areas. Main Functionality: Interactive Range: The indicator creates two vertical lines on
FREE
VWAP_PC_MQL5 — a simple home-built VWAP indicator showing real-time volume-weighted price levels directly on your MT5 chart. TF: Works on all timeframes. Pair: Compatible with all symbols — Forex, indices, commodities, and stocks. Settings: Applied Price – price type used for VWAP calculation (Close, Typical, Weighted, etc.) Line Color / Width / Style – customize VWAP line appearance Session Reset – optional reset per day or continuous mode How it works (VWAP principle): VWAP (Volume Weighted
FREE
Global Market Sessions – Visual Analyzer for MT5 A lightweight MT5 indicator that visually maps Tokyo, London and New York sessions, auto-detects broker timezone & DST, and highlights the best liquidity windows for smarter trading. See the market’s rhythm at a glance. Trade with clarity, precision, and confidence. Overview Global Market Sessions is a powerful yet easy-to-use MT5 indicator that visually displays the world’s major trading sessions (Tokyo, London, New York) directly on your chart
FREE
Value Chart Candlesticks
Flavio Javier Jarabeck
4.57 (14)
The idea of a Value Chart indicator was presented in the very good book I read back in 2020 , " Dynamic Trading Indicators: Winning with Value Charts and Price Action Profile ", from the authors Mark Helweg and David Stendahl. The idea is simple and the result is pure genius: Present candlestick Price analysis in a detrended way! HOW TO READ THIS INDICATOR Look for Overbought and Oversold levels. Of course, you will need to test the settings a lot to find the "correct" one for your approach. It
FREE
Dual Scale Candles
Mohamed Amr Mohamed Osama Abdelwahab
Dual Scale Candles sobrepõe os candles reais de um segundo símbolo diretamente no seu gráfico, com sua própria escala de preços independente no eixo esquerdo. Compare ouro com uma moeda, petróleo com um índice ou quaisquer dois instrumentos em um único gráfico - cada um mantém seus preços reais. As duas séries são alinhadas no ponto que você escolher: a primeira barra do dia atual exibida no gráfico, a primeira barra da semana atual ou a barra mais antiga exibida - na barra de alinhamento, as d
FREE
O Delta Aggression Volume mostra, candle a candle, se os compradores agressores ou os vendedores agressores negociaram mais, em ativos com negócios reais, como os da B3 e os futuros da CME. O QUE FAZ Calcula o saldo de agressão de cada candle: volume das compras agressoras menos volume das vendas agressoras. Plota o saldo de cada candle em uma janela separada, colorido pelo lado que venceu. REQUISITOS Ativos de bolsa com negócios reais: futuros e ações da B3 (WIN, WDO, PETR4 …) e futuros da CME
FREE
Weis Waves
Flavio Javier Jarabeck
2.83 (18)
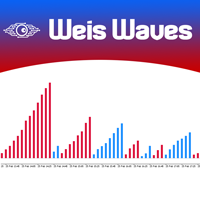
The original author is David Weis, an expert in the Wyckoff Method. The Weis Wave is a modern adaptation of the 1930's Wyckoff Method, another expert in Tape Reading techniques and Chart Analysis. Weis Waves takes market volume and stacks it into waves according to price conditions giving the trader valuable insights about the market conditions. If you want to learn more about this subject you can find tons of videos in YouTube. Just look for "The Wickoff Method", "Weis Wave" and "Volume Spread
FREE
Adaptive Volume Profile desenha o Perfil de Volume das últimas barras diretamente no gráfico: o Point of Control (POC), a Value Area (VAH / VAL), os nós de volume alto (HVN), os nós de volume baixo (LVN) e um histograma de volume opcional. O tamanho das linhas de preço adapta-se à volatilidade atual (ATR), por isso o perfil permanece legível em qualquer símbolo e período. Recursos POC - o nível de preço com o maior volume negociado na janela Value Area (VAH / VAL) - a faixa de preço que contém a
FREE
AD Pro
Ola Marten Hamberg
A/D Pro is a modern version of the classic Accumulation/Distribution indicator. It keeps the standard MetaTrader 5 A/D calculation and adds new display modes, automatic divergence detection, alerts and a live status panel, so you can see buying and selling pressure at a glance. The A/D indicator measures where each bar closes within its range and weights it by volume. A rising line shows accumulation (buying pressure), a falling line shows distribution (selling pressure). Divergences between A
FREE
The indicator highlights the points that a professional trader sees in ordinary indicators. VisualVol visually displays different volatility indicators on a single scale and a common align. Highlights the excess of volume indicators in color. At the same time, Tick and Real Volume, Actual range, ATR, candle size and return (open-close difference) can be displayed. Thanks to VisualVol, you will see the market periods and the right time for different trading operations. This version is intended f
FREE
INTRODUCING MML Data Bridge The demand for bridging external data and machine learning with trading platforms is higher than ever. MetaTrader 5 is a powerful environment for trading and back testing, but without a data bridge, MT5 is largely isolated from using any external data. MML Bridge is a developer tool that allows users to bridge external data into MT5 for back testing, live trading, and optimization. It's built for ease of use, providing users with a simple function API that drip-feeds
FREE
Alphabet SMC Terminal Pro
Layth Adil Khalaf Khalaf
ALPHABIT SMC TERMINAL PRO The Ultimate All-in-One Institutional Trading Suite: Pure Price Action, Dynamic News Alerts, Candle Timer & Smart Liquidity Tired of cluttered charts, dead zones, and overlapping lines? Missing high-probability setups due to unannounced high-impact economic news? ALPHABIT SMC TERMINAL PRO is not just an ordinary SMC indicator—it is a complete trading command center . Engineered for modern price action traders, it blends advanced Smart Money Concepts (SMC) with rea
Smart Trendline Detector Smart Trendline Detector is an automatic multi-timeframe trendline analysis indicator for MetaTrader 5 that detects and ranks rising support and falling resistance structures using market swing points. Instead of filling the chart with every possible trendline, the indicator evaluates qualifying structures and displays only a controlled number of the strongest candidates according to configurable ranking criteria. The result is a cleaner chart with relevant trendline str
FREE
Friend of the trend : Seu Rastreador de Tendências Domine o mercado com o Friend of the trend , o indicador que simplifica a análise de tendências e te ajuda a identificar os melhores momentos para comprar, vender ou esperar. Com um design intuitivo e visualmente impactante, o Trend Analisa os movimentos de preço e entregar sinais através de um histograma colorido: Barras Verdes : Sinalizam uma tendência de alta, indicando oportunidades de compra. Barras Vermelhas : Alertam para uma tendência de
FREE
LM Volume Profile MT5 LM Volume Profile MT5 displays the distribution of calculated volume across price levels directly on the MetaTrader 5 chart. The indicator divides the selected price range into configurable price rows and displays the volume distribution as a horizontal histogram. It also calculates the Point of Control, Value Area High, Value Area Low, average profile price, and optional VWAP reference. Four profile modes are available: - Visible Range - Fixed Range - Session - Daily
FREE
Easy SMC Trading
Israr Hussain Shah
3 (3)
Análise de Tendência Estrutural com Auto RR e Scanner de BOS Versão: 1.0 Visão Geral A Análise de Tendência Estrutural com Auto RR é um sistema de negociação abrangente, concebido para traders que dependem da Ação do Preço e da Estrutura de Mercado. Combina um filtro de tendência suavizado com a deteção de Pontos de Oscilação e sinais de Ruptura de Estrutura (BOS) para gerar configurações de negociação de alta probabilidade. O principal diferencial desta ferramenta é a sua Gestão de Risco Aut
PositionMap Pro — Account Overview Panel for MT5 A real-time panel that groups all open positions by symbol and shows Buy lots, Sell lots and net profit/loss directly on your chart — the whole account at a glance. Instead of counting lots symbol by symbol in the Terminal tab, PositionMap Pro groups everything automatically. You instantly see how much exposure you have on each symbol, split by direction. Panel example Symbol Buy Lot Sell Lot Net P/L EURUSD 0.50 — +12.30 XAUUSD — 1.00 −45.00 GBPUS
FREE
Aggression Volume
Flavio Javier Jarabeck
4.29 (17)
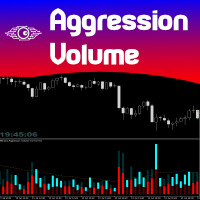
O Indicador de Volume de Agressão é o tipo de indicador que raramente é encontrado na comunidade MQL5 porque não é baseado nos dados de Volume padrão fornecidos pela plataforma Metatrader 5. Ele requer a análise de todos os Ticks de tráfego solicitados na plataforma... Dito isso, o indicador de Volume de Agressão solicita todos os Dados de Tick do seu Broker e os processa para construir uma versão muito especial de um Indicador de Volume, onde as agressões de Compradores e Vendedores são plotada
FREE
JT360 DNA Mini PnL Pointer V1.04 Public Compacto. Claro. Sempre à vista. O JT360 DNA Mini PnL Pointer é um indicador leve para MetaTrader 5 que apresenta o lucro ou prejuízo flutuante agregado de todas as posições abertas no símbolo do gráfico atual. O seu design compacto combina o PnL baseado no risco, expresso em R, uma pequena barra visual e uma matriz de cores configurável. As cores características da JT360 — turquesa e magenta — destacam os valores extremos e facilitam a identificação rápid
FREE
Volume Profile Density V2.40 Mostra a distribuição do volume por nível de preço, revelando áreas de interesse institucional. Diferente do volume clássico (por tempo), mostra onde o volume realmente se concentrou. Conceitos principais: Barras horizontais = volume negociado em cada preço Barra mais longa → maior volume Zonas vermelhas = suportes e resistências fortes Principais usos: Identificar suportes e resistências reais Determinar o POC (Ponto de Controle) Definir a Área de Valor (70 % do vol
FREE
Weis Waves é um indicador técnico desenvolvido por David Weis, inspirado nos princípios de Richard Wyckoff. Diferente do volume tradicional, que é exibido barra a barra, o Weis Waves acumula o volume em “ondas” de alta ou de baixa, reiniciando a contagem sempre que ocorre uma mudança na direção do preço. Esse método permite que o trader visualize de forma clara a força real do movimento do mercado, já que cada onda reflete a intensidade do volume que sustenta a sequência de candles. Principai
FREE
Esse robô envia notificações no Telegram baseado nas regras de coloração do indicador Platinum Candle. Exemplo de mensagem para venda de ativos: [WING21][M15] PLATINUM DE VENDA 11:45. Exemplo de mensagem para compra de ativos : [PETR4][M15] PLATINUM DE COMPRA 11:45. Antes de habilitar as notificações por Telegram, você precisa criar um bot, obter a API Key e descobrir qual o chatId do seu usuário no Telegram. Não é possível enviar mensagens para grupos ou canais. Você só pode enviar mensagens p
FREE
Volume By Color RSJ pinta a barra de volume com uma cor mais escura quando o volume negociado está acima da sua própria média móvel, destacando os candles com atividade fora do comum. Um modo opcional de quatro cores mostra em níveis a força do volume de cada candle. Por padrão, o indicador compara cada barra com a média simples de 20 períodos do volume. O tipo e o período da média podem ser alterados nos parâmetros de entrada. Como usar As barras coloridas facilitam identificar rompimentos, rej
FREE
Os compradores deste produto também adquirem
Farmed Hedge Yield Farming | All Markets (Manual - Hybrid - Semi/Automated EA) VERIFIED TRADING RESULTS - Farmed Hedge Yield Axi Copy:  https://www.mql5.com/en/signals/2356376 - Farmed Hedge Yield Exn Copy:   https://www.mql5.com/en/signals/2356404 - Farmed Hedge Yield V Copy:  https://www.mql5.com/en/signals/2357156 IMPORTANT NOTICE: FarmedHedge is a MANUAL-FOCUSED TRADING UTILITY ,not a fully automated EA. Results shown on this Signal include manual trades and overall strategic management.
Master Your Trading Discipline   Stop losing your hard-earned gains to overtrading and emotional decisions. The Discipline Tool is your ultimate trading assistant, ensuring strict risk management in real-time. Key Protection Features: Advanced Drawdown Defense : Automatically halts trading if your daily drawdown exceeds a preset threshold (percentage or dollar amount). Real-Time Equity Lock : Safeguard profits by referencing peak equity, ensuring drawdown stays within control. Hard Profit Target
Dealer's Panel No signal decides anything here — a hand does. One click, and the panel calculates what's underneath: lot size from risk, target from a 30-step balance ladder that remembers exactly how far an account has climbed. Toggle between market and pending without touching an input field. Set a stop, and the take-profit can write itself — a fixed share of the balance, translated into price with no arithmetic left for the trader to get wrong. One trade live at a time; it won't let a seco
REVDEN AI Desk: Conduza Seu Trading a Partir de Uma Conversa com Sua Própria IA, sobre o Contexto de Mercado do REVDEN Imagine conduzir seu trading a partir de uma única conversa. O REVDEN AI Desk traz isso para o MetaTrader 5: você pergunta à sua própria IA como ela lê o mercado, e ela responde a partir do contexto completo do REVDEN sobre os símbolos que você opera, com o estado de cada um, o quadro de risco e as divulgações que vêm pela frente. As propostas dela chegam com entrada, stop, alvo
The Patch
Mian Rameez Ali
The Patch It never opens a trade. It walks behind the ones that did. Every open position, every pending order — checked twice a second for the one thing that's easy to forget: a stop, a target. Found bare, it doesn't ask. It writes the missing number in, measured in points from wherever the position began, and moves on to the next. No strategy, no opinion on direction. Just the quiet assumption that nothing should ever sit on the market unprotected — not because someone decided it shouldn't,
Floor Watch
Syed Tauqeer Hussain Shah
Floor Watch One number, watched every thirty seconds: how far equity has fallen since the day began — or since its highest point, if it's told to trail the peak instead of the open. Cross the line and it doesn't argue. Every open position closes, every pending order vanishes, and anything that slips through afterward gets shut the moment it appears. Not asked. Removed. The floor holds until the clock turns 5 AM Pakistan time — then, and only then, does the day start over. One rule. No except
Uma única compra. Todos os meus indicadores e robôs de negociação (EAs) para MT4 e MT5, atuais e futuros, sem custo adicional. Após a compra, entre em contato comigo para saber como recebê-los. Está previsto aumentar o preço em 50$ a cada 10 compras, até 999$. Vale o preço do Market no momento do pagamento. Mantenha o indicador em que você confia. Automatize o trabalho ao redor dele. Seu sinal. Suas regras. Sua execução. Você já tem um indicador MT5 em que confia, mas ainda precisa acompanhar o
Adam FTMO MT5
Vyacheslav Izvarin
5 (2)
ADAM EA Special Version for FTMO Please use ShowInfo= false for backtesting ! Our 1st EA created using ChatGPT technology Trade only GOOD and checked PROP FIRMS  Default parameters for Challenge $100,000 Tested on EURUSD and GBPUSD only  Use 15MIN Time Frame Close all deals and Auto-trading  before Weekend at 12:00 GMT+3  Friday For Prop Firms MUST use special Protector  https://www.mql5.com/en/market/product/94362 --------------------------------------------------------------------------------
AI Arbitron — an MT5 Spot vs Future Gold Arbitrage Bot designed to capture price discrepancies between correlated Spot and Future instruments through hedged, non-directional trading. Platform: MT5 Use Swap Free Accounts, many of the regulated broker gives swap free accounts for 7 days, make use of it by only buying lower price asset and selling higher price asset, hold your position for 2-3 days. Asset: Mainly Gold (XAUUSD) using Spot + Future/CFD price feeds. Core strategy: It monitors the p
The new version of  MirrorSoftware 2021  has been completely rewriten and optimized.  This version requires to be loaded only on a single chart because  it can detect all actions on every symbol and not only the actions of symbol where it is loaded. Even the  graphics and the configuration mode  have been completely redesigned. The MirrorSoftware is composed of two components (all components are required to work):  MirrorController  (free indicator): This component must be loaded into the MASTER
Mt5BridgeBinary
Leandro Sanchez Marino
Automatizei as suas estratégias comerciais para o uso do binário em MT5 e com o nosso Mt5BridgeBinary enviei as ordens à sua conta Binária e inclino-me: comece a fazer funcionar este caminho do fácil! Os aconselhadores peritos são fáceis formar, otimizar e realizar testes de robustez; também no teste podemos projetar a sua rentabilidade de longo prazo, por isso criamos Mt5BridgeBinary para unir as suas estratégias melhores ao Binário. Características: - Pode usar tantas estratégias como desej
FiboPlusWaves MT5
Sergey Malysh
5 (1)
Uma série de produtos sob marca FiboPlusWave Um sistema comercial pronto baseado nas  ondas de Elliott e níveis de Fibonacci . Simples e de fácil acesso. Exibição de marcação das ondas de Elliott (opção geral ou alternativa) em um gráfico. Construção dos níveis horizontais, linhas de apoio e resistência, canal. Sobreposição dos níveis de Fibonacci para as ondas 1, 3, 5, A Sistema de alerta (no ecrã, E-Mail, Push notificações).    Particularidade s : sem se aprofundar na teoria das ondas de Ellio
Xrade EA
Yao Maxime Kayi
Xrade EA is an expert advisor as technical indicator. For short period trade it's the best for next previsions of the trend of the market. +--------------------------------------------------------------------------------------- Very Important Our robot(data anylizer) does'nt take a trade procedure. If using only our robot you must take positions by yoursels +--------------------------------------------------------------------------------------- The technical indiator provide for a given sma
News: IDEA 2.0 is out with lot of features, like telegram bot notifications and Limits order! Check the changelog at bottom of page (*). Hi all, here you can find my Expert Advisor, called IDEA  (Intelligent Detection & managEr Algorithm) . In short, with this software you can: Have   a clear view of market status , with an indication of current trend. Simply add symbols you want to monitor to your market watch, and IDEA will notify you if some of them are in trend; Have an   automatic lots ca
Gold Macro Desk
Massimiliano Tuzzolino
INTRODUCING GOLD MACRO DESK - The Next Level of Gold Market Intelligence. What if you could look beyond the chart and understand the forces driving Gold? Introducing GOLD MACRO DESK for MetaTrader 5 — an advanced analytical environment designed for traders who want to approach XAUUSD with a broader, more informed perspective. Gold doesn't move in isolation. The US Dollar, Treasury Yields, market volatility, economic releases and global events all contribute to the dynamics of the precious metals
PROMOTION!! $499 until 1 Mar. After that, EA will be $1,050 Developed and tested for over 3 years, this is one of the safest EAs on the planet for trading the New York Open. Trading could never be easier.  Trade On NASDAQ US30 (Dow Jones Industrial Average) S&P 500  What Does The EA do? The EA will open a Buy Stop Order and a Sell Stop Order(With SL and TP) on either side of the market just a few seconds before the NY Open.  As soon as 1 of the 2 trades is triggered, the EA automatically delete
Salvando dados do livro de pedidos. Utilitário de repetição de dados: https://www.mql5.com/pt/market/product/71640 Biblioteca para uso no testador de estratégia: https://www.mql5.com/pt/market/product/81409 Talvez, então, apareça uma biblioteca para utilizar os dados salvos no testador de estratégia, dependendo do interesse neste desenvolvimento. Agora, há desenvolvimentos desse tipo usando memória compartilhada, quando apenas uma cópia dos dados está na RAM. Isso não apenas resolve o problema
All in one Keylevel
Trinh Minh Tung
5 (1)
Instead of sticking to the Charts,let's use ALL IN ONE KEYLEVEL Announcement: We are pleased to announce the latest version 14.02 of the One In One Keylevel product. This is a reliable product that has been upgraded with many new features and improvements to make your work easier and more efficient. Currently, we have a special promotion for this new version. The current discounted price is $500, and there are only 32 units left. After that, the price will increase to $1000, and will continue to
The EA Protection Filter ( MT4 version here ) provides a news filter as well as a stock market crash filter, which can be used in combination with other EAs. Therefore, it serves as an additional protective layer for other EAs that do provide such filters.  During backtest analysis of my own night scalpers, which already use a stock market crash filter, I noticed that the historic drawdown,  especially during stock market crash phases like 2007-2008, was reduced significantly by using such a fil
Hedge Ninja
Robert Mathias Bernt Larsson
3 (2)
Make sure to join our Discord community over at www.Robertsfx.com , you can also buy the EA at robertsfx.com WIN NO MATTER IN WHICH DIRECTION THE PRICE MOVES This robot wins no matter in which direction the price moves by following changing direction depending on in which direction price moves. This is the most free way of trading to this date. So you win no matter which direction it moves (when price moves to either of the red lines as seen on the screenshot, it wins with the profit target you
Best for Technical Analysis You can set from one key shortcut for graphical tool or chart control for technical analysis. Graphic design software / CAD-like smooth drawing experience. Best for price action traders. Sync Drawing Objects You don’t need to repeat drawing the same trend line on the other charts. Shortcuts do that for you automatically. Of course, any additional modifications of the object immediately apply to the other charts too. Colors depend on Timeframe Organize drawings with
Gold instrument scanner is the chart pattern scanner to detect the triangle pattern, falling wedge pattern, rising wedge pattern, channel pattern and so on. Gold instrument scanner uses highly sophisticated pattern detection algorithm. However, we have designed it in the easy to use and intuitive manner. Advanced Price Pattern Scanner will show all the patterns in your chart in the most efficient format for your trading. You do not have to do tedious manual pattern detection any more. Plus you
Gold Wire Trader MT5 trades using the RSI Indicator. It offers many customizable RSI trading scenarios and flexible position management settings, plus many useful features like customizable trading sessions, a martingale and inverse martingale mode. The EA implements the following entry strategies, that can be enabled or disabled at will: Trade when the RSI Indicator is oversold or overbought Trade when the RSI comes back from an oversold or overbought condition Four different trading behavio
Gold trend scanner MT5 a multi symbol multi timeframe dashboard that monitors and analyzes Average True Range indicator value in up to 28 symbols and 9 timeframes  in 3 modes :  It shows the ATR indicator value in all pairs and timeframes and signals when the ATR value reaches a maximum or minimum in a given duration. Short term ATR/Long term ATR ratio: It shows ratio of 2 ATRs with different periods. It's useful in detecting short term volatility and explosive moves. ATR Value/Spread ratio: S
Attention: this is a multicurrency EA, which trades by several pairs from one chart!  Therefore, in order to avoid duplicate trades, it is necessary to attach EA only to one chart, ---> all trading in all pairs is conducted only from one chart! we can trade simultaneously in three different pairs, as by default (EURUSD + GBPUSD + AUDUSD), which take into account the correlation when entering the market for all three; we can trade only EURUSD (or any currency pair) and at the same time take into
A triangular arbitrage strategy exploits inefficiencies between three related currency pairs, placing offsetting transactions which cancel each other for a net profit when the inefficiency is resolved. A deal involves three trades, exchanging the initial currency for a second, the second currency for a third, and the third currency for the initial. With the third trade, the arbitrageur locks in a zero-risk profit from the discrepancy that exists when the market cross exchange rate is not aligned
Gold index expert MT5 Wizard uses Multi-timeframe analysis. In simpler terms, the indicator monitors 2 timeframes. A higher timeframe and a lower timeframe. The indicator determines the trend by analyzing order flow and structure on the higher timeframe(4 hour for instance). Once the trend and order flow have been determined the indicator then uses previous market structure and price action to accurately determine high probability reversal zones. Once the high probability reversal zone has bee
Golden Route home MT5 calculates the average prices of BUY (LONG) and SELL (SHORT) open positions, taking into account the size of open positions, commissions and swaps. The indicator builds the average line of LONG open positions, after crossing which, from the bottom up, the total profit for all LONG positions for the current instrument becomes greater than 0. The indicator builds the average line of SHORT open positions, after crossing which, from top to bottom, the total profit for all SH
Do you want an EA with small stoploss? Do you want an EA that is just in and out of market? Gold looks at several MT5 It is ONLY buying when the market opens and with a window of 10 minutes or less. It uses pre-market price so be sure your broker has that.   This strategies (yes, it is 2 different strategies that can be used with 3 different charts) have tight stoplosses and a takeprofit that often will be reached within seconds! The strategies are well proven. I have used them manually for
Bionic Forex
Pablo Maruk Jaguanharo Carvalho Pinheiro
Bionic Forex - Humans and Robots for profit. Patience is the key. The strategies are based on: - Tendency - Momentum + High Volatility - Dawn Scalper + Support Resistence. Again, patience is the key. No bot is flawless, sometimes it will work seamlessly, sometimes it simply won't.  it's up to you manage its risk and make it a great friend to trade automatically with fantastic strategies. Best regards, Good luck., Pablo Maruk.
Mais do autor
1. Record the price data for each Tick transaction. Data file contents: "Tick time", "ASK price", "BID price", "SPREAD SPREAD", "Tick quoted quantity". 2. Meanwhile, generate a quotation data file with a 1-minute period. Content of 1min data file: "ASK time", "ASK OPEN price", "ASK HIGH price", "ASK LOW price", "ASK CLOSE price", "BID time", "BID OPEN price", "BID HIGH price", "BID LOW price", "BID CLOSE price", "Tick quoted quantity". 3. Save all quotation data in one file every day, which is c
Pivot Point Indicator (Poivt) ClassicMode indicator calculation formula (ClassicMode): pp=(High+Low+Close)/3.0         s1=2*pp-High         s2=pp-(High-Low)         s3=Low-2*(High-pp)         r1=2*pp-Low         r2=pp+(High-Low)         r3=High+2*(pp-Low) Woodie Mode indicator calculation formula (WoodieMode): pp=(High+Low+2*Close)/4.0         s1=2*pp-High         s2=pp-(High-Low)         s3=Low-2*(High-pp)         r1=2*pp-Low                 r2=pp+(High-Low)         r3=High+2*(pp-Low) Fibo
Filtro:
Sem comentários
Responder ao comentário