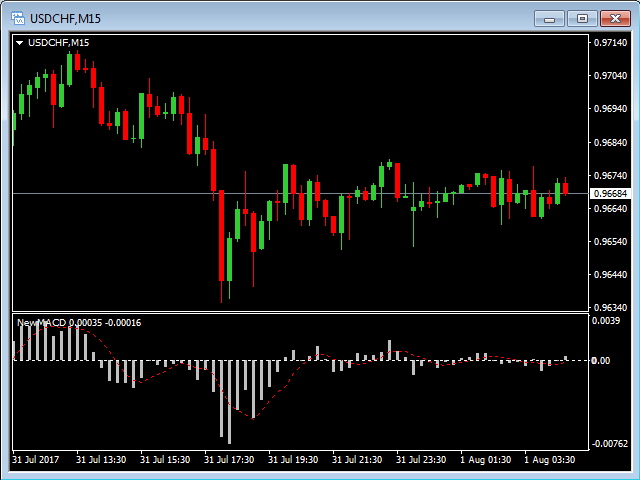
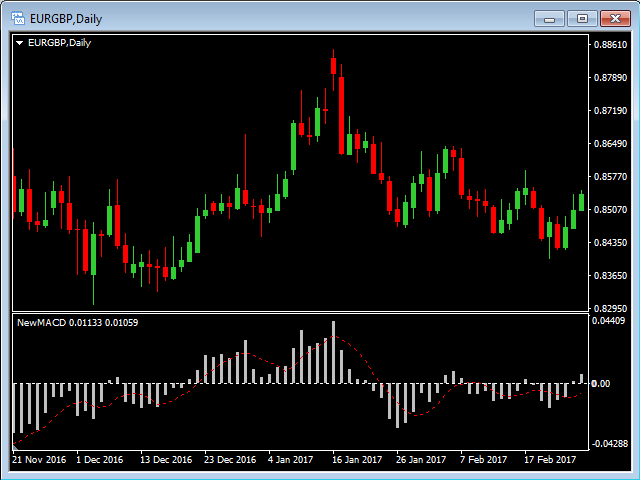
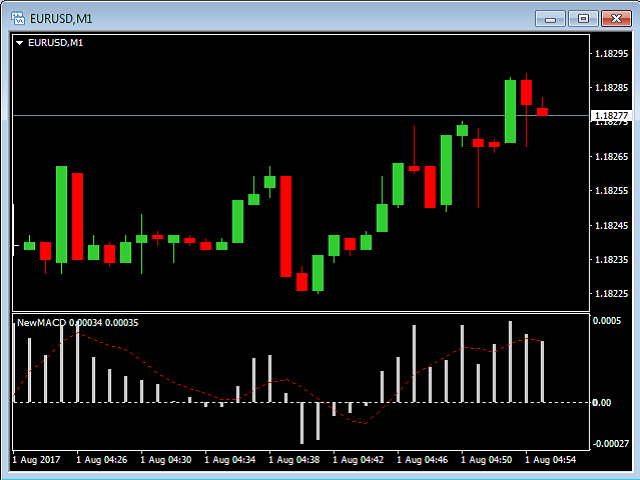
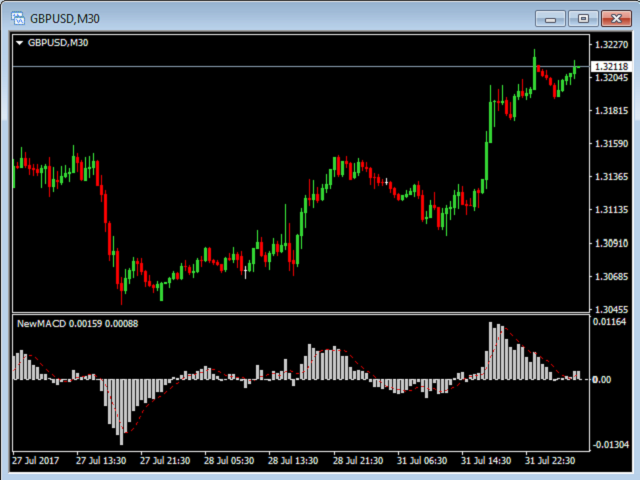
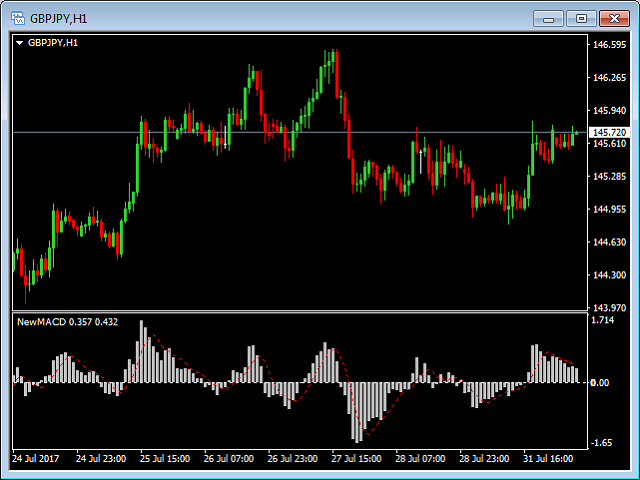
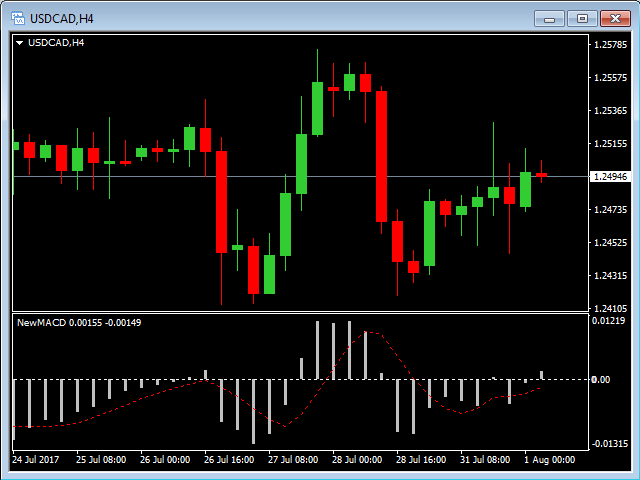
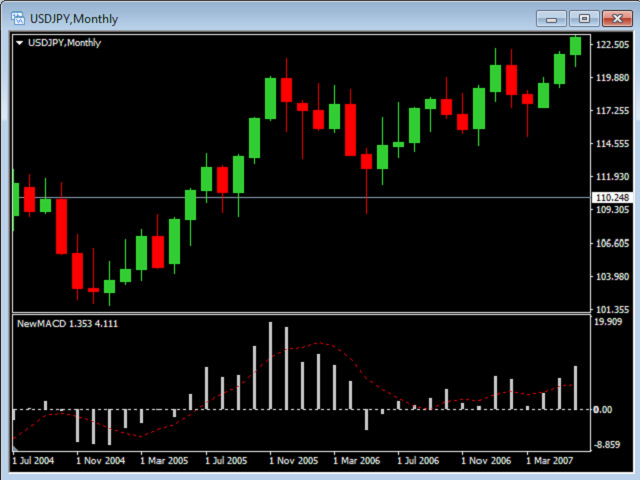
New MACD

MACD (Moving Average Convergence/Divergence) is a classical trading indicator used in technical analysis from late 1970s.

It is supposed to reveal changes in the strength, direction, momentum, and duration of a trend currencies price (also stocks, commodities etc).

The New MACD indicator is an advanced model of the standard MACD indicator. You may use the New MACD absolutely the same way as classical.

The main difference is that New MACD is working faster (in case of similar input parameters).


Input parameters

  • InpFastPeriod = 5; - Period for Moving Average #1
  • InpSlowPeriod = 14; - Period for Moving Average #2
  • maMethod = MODE_SMA; - The smoothing type as an input parameter
  • appliedPrice = PRICE_CLOSE; - There are 7 predefined identifiers, used to specify the desired price base for calculations
Produtos recomendados
Lyne
Maksim Kalachev
About the Lyne indicator Lyne is a Metatrader 4 (MT4) indicator, the essence of which is to transform the accumulated historical data. The Lyne indicator makes it possible to detect various features and patterns in price dynamics that are invisible to the naked eye. Based on this information, traders can anticipate further price movement and adjust their strategy accordingly. This indicator has proven itself in the scalping strategy. The indicator works without repainting.
This product is a part of  ON Trade Waves Patterns Harmonic Elliot Wolfe you can test free version on EURJPY from this link  Wolf Waves Indicator Descubra as Wolf Waves - Sua Ferramenta de Negociação Definitiva! Você está em busca de uma ferramenta poderosa para identificar facilmente as Wolf Waves em qualquer período de tempo? Não procure mais! Nosso indicador de Wolf Waves faz esse trabalho com facilidade. Veja por que ele é perfeito para você: Recursos Principais: Detecção Automática: Nosso
Super Reversal Pattern
Parfait Mujinga Ndalika
Super Reversal Pattern Indicator Unlock the power of advanced pattern recognition with our Super Reversal Pattern Indicator. Designed for traders seeking precision and reliability, this indicator identifies one of the most effective reversal patterns in technical analysis, offering a significant edge in your trading strategy. Key Features: Non-Repainting Accuracy: Enjoy the confidence of non-repainting technology. Once a Super Reversal Pattern is detected, it remains static, providing consiste
The Stochastic Oscillator is a momentum indicator that uses support and resistance levels. The term "stochastic" refers to the point of a current price in relation to its price range over a period of time. You can use a New Stochastic in the same way as classical one: Overbought and Oversold areas to make a Buy or Sell orders. This new indicator shows all variety of Fibonacci Levels (from 23.6 to 76.4) which can be used as Overbought and Oversold levels as well as points to close an open positio
Os indicadores [ZhiBiCCI] são adequados para todo o ciclo de uso e também são adequados para todas as variedades do mercado. [ZhiBiCCI] Linha sólida verde é uma inversão da divergência de alta. A linha pontilhada verde é uma divergência de alta clássica. [ZhiBiCCI] A linha sólida para o vermelho é uma divergência de baixa reversa. A linha pontilhada vermelha é uma divergência clássica de baixa. [ZhiBiCCI] pode ser definido nos parâmetros (Alerta, Enviar e-mail, Enviar notificação), definido c
We present you the indicator "Candle closing counter", which will become your indispensable assistant in the world of trading. That’s why knowing when the candle will close can help: If you like to trade using candle patterns, you will know when the candle will be closed. This indicator will allow you to check if a known pattern has formed and if there is a possibility of trading. The indicator will help you to prepare for market opening and market closure. You can set a timer to create a pre
Trend Oscillator - é um indicador Crypto_Forex personalizado avançado, uma ferramenta de negociação eficiente! - É utilizado um novo método de cálculo avançado - 20 opções para o parâmetro "Preço para cálculo". - O oscilador mais suave alguma vez desenvolvido. - Cor verde para tendências ascendentes, cor vermelha para tendências descendentes. - Valores de sobrevenda: abaixo de 5, Valores de sobrecompra: acima de 95. - Existem muitas oportunidades para atualizar até mesmo as estratégias padrão
Wave Wolf MT4
Andrei Salanevich
O indicador Forex Wave Wold MT4 é projetado para procurar as ondas de Wolfe e exibi-las na janela atual do terminal de negociação. Um excelente indicador para os traders que usam as ondas de Wolf. Sua aplicação em estratégias de negociação aumentará significativamente sua eficiência e lucratividade. INFORMAÇÃO DO INDICADOR Ao contrário de outros indicadores de ondas de Wolfe, o indicador forex Wave Wold MT4 tem uma série de características que aumentam significativamente a sua eficiência: O p
HMA Trend Professional MT4
Pavel Zamoshnikov
4.57 (7)
Improved version of the free HMA Trend indicator (for MetaTrader 4) with statistical analysis. HMA Trend is a trend indicator based on the Hull Moving Average (HMA) with two periods. HMA with a slow period identifies the trend, while HMA with a fast period determines the short-term movements and signals in the trend direction. The main differences from the free version: Ability to predict the probability of a trend reversal using analysis of history data. Plotting statistical charts for analyzi
TWO PAIRS SQUARE HEDGE METER INDICATOR Try this brilliant 2 pairs square indicator It draws a square wave of the relation between your two inputs symbols when square wave indicates -1 then it is very great opportunity to SELL pair1 and BUY Pair2 when square wave indicates +1 then it is very great opportunity to BUY pair1 and SELL Pair2 the inputs are : 2 pairs of symbols         then index value : i use 20 for M30 charts ( you can try other values : 40/50 for M15 , : 30 for M30 , : 10 for H1 ,
Daily Candle Predictor é um indicador que prevê o preço de fechamento de uma vela. O indicador destina-se principalmente ao uso em gráficos D1. Este indicador é adequado tanto para negociação forex tradicional quanto para negociação de opções binárias. O indicador pode ser usado como um sistema de negociação autônomo ou pode atuar como um complemento ao seu sistema de negociação existente. Este indicador analisa a vela atual, calculando certos fatores de força dentro do próprio corpo da vela, be
Infinity Trend Pro
Yaroslav Varankin
1 (1)
This is a trend indicator without redrawing Developed instead of the binary options strategy (by the color of the Martingale candlestick) Also works well in forex trading When to open trades (binary options) A signal will appear in the place with a candle signaling the current candle It is recommended to open a deal for one candle of the current timeframe M1 and M5 When a blue dot appears, open a deal up When a red dot appears, open a trade down. How to open trades on Forex. When a signal is rec
Garuda Fire MT4
Maldini Yoga Pratama
EA Garuda Fire MT4 .This is the logical development of EA Dragon Fire ultimate, with the addition of better logic and confirmation than before.   EA Garuda Fire MT4   is a trend following system for swing trading based on PLT indicator filtered by I-gentor LSMA. no need to add any indicators because everything is included in this EA code, so the trading decisions are simple and immediate without confusion that can result from the use of many indicators Only   10 download  of the EA left  at $69
FXC iDeM-DivergencE MT4 Indicator This is an advanced DeMarker indicator that finds trend-turn divergences on the current symbol. The indicator detects divergence between the DeMarker and the price movements as a strong trend-turn pattern. Main features: Advanced divergence settings Price based on Close, Open or High/Low prices Give Buy/Sell open signals PUSH notifications E-mail sending Pop-up alert Customizeable Information panel Input parameters: DeM Period: The Period size of the DeMarker in
The indicator detects and displays Shark harmonic pattern (see the screenshot). The pattern is plotted by the extreme values of the ZigZag indicator (included in the resources, no need to install). After detecting the pattern, the indicator notifies of that by a pop-up window, a mobile notification and an email. The indicator highlights the process of the pattern formation and not just the complete pattern. In the former case, it is displayed in the contour triangles. After the pattern is comple
The indicator displays the data of the Stochastic oscillator from a higher timeframe on the chart. The main and signal lines are displayed in a separate window. The stepped response is not smoothed. The indicator is useful for practicing "manual" forex trading strategies, which use the data from several screens with different timeframes of a single symbol. The indicator uses the settings that are identical to the standard ones, and a drop-down list for selecting the timeframe. Indicator Paramet
Power Renko is an indicator which plots Renko bricks underneath the chart using a histogram. You can select the brick size and the timeframe of the Renko bricks as well as whether or not to use the close price or the high/low price of the candles. Renko bricks are based on price alone, not time, therefor the Renko bricks will not be aligned with the chart's time. They are extremely useful for trend trading and many different strategies can be formed from them. Buffers are provided allowing you t
EZZ Zig Zag MT4
Paulo Rocha
5 (1)
EZZ Elite Zig Zag is an indicator for the MetaTrader 4 terminal. This indicator traces the peak of the trend based on the market reversal, thus showing various opportunities in the financial market. EZZ Elite Zig Zag is a visual tool, intuitive, and easy to understand and use.  Test it Yourself by Downloading it for Free. Author Paulo Rocha all rights reserved
SuperTrend MT4
KEENBASE SOFTWARE SOLUTIONS
KT SuperTrend is a modified version of the classic SuperTrend indicator with new useful features. Whether its Equities, Futures, and Forex, the beginners' traders widely use the Supertrend indicator.  Buy Signal: When price close above the supertrend line. Sell Signal: When price close below the supertrend line. Features A multi-featured SuperTrend coded from scratch. Equipped with a multi-timeframe scanner. The last signal direction and entry price showed on the chart. All kinds of MetaTrader
Noize Absorption Index MT4
Ekaterina Saltykova
5 (1)
Noize Absorption Index - is the manual trading system that measures the difference of pressure between bears forces and bulls forces. Green line - is a noize free index that showing curent situation. Zero value of index shows totally choppy/flat market.Values above zero level shows how powerfull bullish wave is and values below zero measures bearish forces.Up arrow appears on bearish market when it's ready to reverse, dn arrow appears on weak bullish market, as a result of reverse expectation. S
Binary Options Assistant (BOA) Multi Currency Dashboard for Binary Options (MT4) . You can use any of the BOA Signals Indicators with the dashboard. Just change the BOA Signals Indicator Name in the dashboard settings to the indicator you want to get signals from. For example: CHILL. BOA_BURN_Indicator_v1   Strategy :   Ana Trader Binary Options Strategy (MACD & Stochastic) BOA_COLD_Indicator_v1   Strategy :  Amalia Trader Binary Options Strategy (Keltner & Stochastic) BOA_CHILL_Indicator_v1  
The indicator depends on the price action's analysis how is based on the rsi indicator and the moving average line from a platform containing multi symbols and different time-frames with the possibility to select your desired symbols and time-frames . Special Characteristics :  *  Real time analysis or at price close .  * The possibility to open several windows with the selected symbols .   *     Different alert systems .    Indicator  Characteristics :  * Multiple symbol and time frame with t
Color Stochastic Enhanced Stochastic Oscillator with Cross Detection and Visual Signal Support Overview Color Stochastic is a customized version of the classic Stochastic Oscillator designed for momentum analysis and crossover visualization. The indicator provides color-based signal marking and configurable crossover detection at user-defined overbought and oversold levels. It can be used as part of: Momentum analysis Mean reversion workflows DCA-based strategies Multi-indicator confirmation sys
This indicator presents an alternative approach to identify Market Structure. The logic used is derived from learning material created by   DaveTeaches (on X) Upgrade v1.10: add option to put protected high/low value to buffer (figure 11, 12) When quantifying Market Structure, it is common to use fractal highs and lows to identify "significant" swing pivots. When price closes through these pivots, we may identify a Market Structure Shift (MSS) for reversals or a Break of Structure (BOS) for co
This indicator is based on the MACD on one or more timeframes and on any Currency Cross Pair. The indicator generates an alert message when it detects a buy or sell signal. It also draws a vertical bar on the price chart: green for buy or red for sell, yellow if flat. Alert messages and Vertical bars for BUY or SELL, are generated when the MACD is consistent for all chosen timeframes else a FLAT signal is generated. Features Easy flexible settings: Detection of the MACD signal for one or more t
An indicator of pattern #31 ("Long Island") from Encyclopedia of Chart Patterns by Thomas N. Bulkowski. The second gap is in the opposite direction. Parameters: Alerts - show alert when an arrow appears   Push - send a push notification when an arrow appears (requires configuration in the terminal) GapSize - minimum gap size in points ArrowType - a symbol from 1 to 17 ArrowVShift - vertical shift of arrows in points   ShowLevels - show levels ColUp - color of an upward line ColDn - color of a
The input parameter  counted_bars  determines on how many bars the indicator lines will be visible. The input parameter  barsNum is the period for bands calculation. When PriceClose for previous bar is above upper band a Long position may be opened. When PriceClose for previous bar is under lower band a Short position may be opened. If the current Price is between bands it is time to wait.
Indicador Crypto_Forex "Cruzamento de Médias Móveis HTF" para MT4. - Aprimore seus métodos de negociação com o poderoso indicador Cruzamento de Médias Móveis HTF para MT4. HTF significa - período de tempo mais longo. - Este indicador é excelente para traders de tendências com entradas de Ação de Preço. - Ele permite anexar Médias Móveis Rápidas e Lentas de períodos de tempo mais longos ao seu gráfico atual --> este é um método profissional. - O Cruzamento de Médias Móveis HTF possui alertas in
The   Trend Duration Forecast MT4   indicator is designed to estimate the probable lifespan of a bullish or bearish trend. Using a Hull Moving Average (HMA) to detect directional shifts, it tracks the duration of each historical trend and calculates an average to forecast how long the current trend is statistically likely to continue. This allows traders to visualize both real-time trend strength and potential exhaustion zones with exceptional clarity. KEY FEATURES Dynamic Trend Detection:   Uti
O indicador "Two Moving Average Crossover" para MetaTrader 4 (MT4 é uma ferramenta de análise técnica que apresenta duas médias móveis e notifica quando as médias móveis se cruzam. O indicador calcula e traça duas médias móveis, uma das quais é mais rápida e a outra é mais lenta. Quando a média móvel mais rápida se cruza acima da média móvel mais lenta, é considerada um sinal de alta, indicando uma potencial inversão de tendência ou o início de uma nova tendência de alta. Pelo contrário, quando
Os compradores deste produto também adquirem
Gann Made Easy
Oleg Rodin
4.83 (162)
Gann Made Easy é um sistema de negociação Forex profissional e fácil de usar, baseado nos melhores princípios de negociação usando a teoria do sr. W. D. Gann. O indicador fornece sinais precisos de COMPRA e VENDA, incluindo níveis de Stop Loss e Take Profit. Você pode negociar mesmo em movimento usando notificações PUSH. Entre em contato comigo após a compra para receber instruções de negociação e ótimos indicadores extras gratuitamente! Provavelmente você já ouviu muitas vezes sobre os métodos
M1 Sniper
Oleg Rodin
5 (23)
O M1 SNIPER é um sistema indicador de negociação fácil de usar. É um indicador de seta projetado para o período M1. O indicador pode ser usado como um sistema independente para scalping no período M1 e pode ser usado como parte do seu sistema de negociação existente. Embora este sistema de negociação tenha sido projetado especificamente para negociação no M1, ele também pode ser usado em outros períodos. Originalmente, desenvolvi este método para negociar XAUUSD e BTCUSD. Mas considero-o útil ta
Auto Optimized Parabolic RSI: Avançado Motor de Momentum 3D A maioria dos indicadores de varejo falha porque depende de parâmetros estáticos que quebram no momento em que a volatilidade do mercado muda. O Auto Optimized Parabolic RSI resolve o problema de "obsolescência do indicador" recalculando continuamente a sua própria vantagem matemática, trazendo uma adaptação quantitativa de nível institucional diretamente para o seu terminal MT5. A Vantagem Principal: Otimização 3D em Memória Personaliz
PZ Harmonacci Patterns
PZ TRADING SLU
3.17 (6)
Este é sem dúvida o indicador de reconhecimento automático de formação de preço harmônico mais completo que você pode encontrar para a MetaTrader Platform. Ele detecta 19 padrões diferentes, leva as projeções de Fibonacci tão a sério quanto você, exibe a Zona de Reversão Potencial (PRZ) e encontra níveis adequados de stop loss e take-profit. [ Guia de instalação | Guia de atualização | Solução de problemas | FAQ | Todos os produtos ] Detecta 19 formações harmônicas de preços diferentes Traça
Scalper Inside PRO
Alexey Minkov
4.74 (69)
Scalper Inside PRO – Since 2020. An exclusive indicator that utilizes an innovative algorithm to swiftly and accurately determine the market trend. The indicator automatically calculates opening, closing, and profit levels, providing detailed trading statistics. With these features, you can choose the most appropriate trading instrument for the current market conditions. Additionally, you can easily integrate your own arrow indicators into Scalper Inside Pro to quickly evaluate their statistics
O sistema PRO Renko é um sistema de negociação altamente preciso especialmente concebido para a negociação de gráficos RENKO. Trata-se de um sistema universal que pode ser aplicado a vários instrumentos de negociação. O sistema neutraliza eficazmente o chamado ruído de mercado, dando-lhe acesso a sinais de inversão precisos. O indicador é muito fácil de usar e tem apenas um parâmetro responsável pela geração de sinal. Você pode facilmente adaptar a ferramenta a qualquer instrumento de negocia
Quantum Breakout Indicator PRO
Bogdan Ion Puscasu
4.96 (26)
Apresentando       Quantum Breakout PRO   , o inovador Indicador MQL5 que está transformando a maneira como você negocia Breakout Zones! Desenvolvido por uma equipe de traders experientes com experiência em negociação de mais de 13 anos,   o Quantum Breakout PRO   foi projetado para impulsionar sua jornada comercial a novos patamares com sua estratégia inovadora e dinâmica de zona de rompimento. O Quantum Breakout Indicator lhe dará setas de sinal em zonas de breakout com 5 zonas-alvo de lucro
The Propfolio Master Suite is the ultimate all-in-one analytical workstation for professional traders. Combining the power of the Beat The Market Maker (BTMM) methodology, Smart Money Concepts (SND/Liquidity), and Advanced Volume Profile, this suite replaces multiple different indicators with one optimized engine. Monitor up to 14 pairs simultaneously from a single chart, instantly identify market cycles, and seamlessly map institutional footprints with the click of a button. The Command Center
Se você comprar este indicador, receberá meu Gerenciador de Operações Profissional   + EA  GRATUITAMENTE. Primeiramente, vale ressaltar que este Sistema de Trading é um Indicador Não Repintado, Não Redesenho e Não Atrasado, o que o torna ideal tanto para o trading manual quanto para o automatizado. Curso online, manual e download de predefinições. O "Sistema de Trading Inteligente MT5" é uma solução completa de trading projetada para traders novos e experientes. Ele combina mais de 10 indicador
Please send me Direct message on MQL5 CHAT after purchasing the Indicator for Training and Installation Support There are some additional files that is important to use with the Indicator . So be sure to contact me after purchasing the Indicator So that I can add you for training and support . If you find any difficulty with installation then send me Direct message here So that I can connect with you via Anydesk or Teamview for the product installation. " Smart Order Block Indicator " to find m
Sinal de tendência GoldRush Arrow O indicador Sinal de tendência GoldRush Arrow fornece uma análise precisa e em tempo real das tendências, adaptada para scalpers de alta velocidade e curto prazo em XAU/USD. Criada especificamente para o intervalo de tempo de 1 minuto, esta ferramenta exibe setas direcionais para pontos de entrada claros, permitindo que os scalpers naveguem em condições de mercado voláteis com confiança. O indicador consiste em setas de alerta PRIMÁRIAS e SECUNDÁRIAS. Os sin
Day Trader Master é um sistema de negociação completo para day traders. O sistema é composto por dois indicadores. Um indicador é um sinal de seta para comprar e vender. É o indicador de seta que você obtém. Eu fornecerei o segundo indicador gratuitamente. O segundo indicador é um indicador de tendência especialmente projetado para ser usado em conjunto com essas setas. OS INDICADORES NÃO SE REPETEM E NÃO SE ATRASAM! A utilização deste sistema é muito simples. Você só precisa seguir os sinais de
Market Makers
Mohamed Hassan
5 (4)
After purchase, contact me privately to receive 1 month of free testing with EA Forex Proton! This advanced MT4 trading robot automatically executes signals from any MT4 indicator, including Market Makers. The latest version also includes AI integration, allowing each trade signal to be analyzed using Artificial Intelligence. Live Signal with EA Forex Proton: Click here Market Makers is a powerful price action trading system designed to identify high-probability Buy and Sell opportunities based
O Apollo SR Master é um indicador de Suporte/Resistência com recursos especiais que tornam a negociação com zonas de Suporte/Resistência mais fácil e confiável. O indicador calcula as zonas de Suporte/Resistência em tempo real, sem qualquer atraso, detectando topos e fundos de preço locais. Em seguida, para confirmar a área de Suporte/Resistência recém-formada, o indicador exibe um sinal especial que indica que a zona pode ser considerada e usada como um sinal de VENDA ou COMPRA. Nesse caso, a f
PZ Trend Trading
PZ TRADING SLU
4.8 (5)
O Trend Trading é um indicador projetado para lucrar o máximo possível com as tendências que ocorrem no mercado, cronometrando retrocessos e rupturas. Ele encontra oportunidades de negociação analisando o que o preço está fazendo durante as tendências estabelecidas. [ Guia de instalação | Guia de atualização | Solução de problemas | FAQ | Todos os produtos ] Negocie mercados financeiros com confiança e eficiência Lucre com as tendências estabelecidas sem ser chicoteado Reconhecer retrocessos
GOLD Impulse with Alert
Bernhard Schweigert
4.67 (12)
Este indicador é uma super combinação dos nossos 2 produtos Advanced Currency IMPULSE with ALERT  +   Currency Strength Exotics . Funciona para todos os períodos de tempo e mostra graficamente impulso de força ou fraqueza para as 8 principais moedas mais um Símbolo! Este Indicador é especializado para mostrar a aceleração da força da moeda para quaisquer símbolos como Ouro, Pares Exóticos, Commodities, Índices ou Futuros. É o primeiro do seu género, qualquer símbolo pode ser adicionado à 9ª
Market Structure Patterns MT4
Samuel Manoel De Souza
5 (18)
Market Structure Patterns   é um indicador baseado em   smart money concepts   que apresenta elementos de   SMC/ICT   capazes de elevar suas decisões de negociação a um novo patamar. Aproveite os   alertas ,   notificações   push   e   mensagens  por  e-mail   para ser informado sobre quando um elemento se forma no gráfico, o preço cruza um nível e/ou entra em uma região delimitada por uma retângulo. Desenvolvedores podem acessar valores dos elementos do indicador por meio de   variáveis globais
Advanced Supply Demand
Bernhard Schweigert
4.91 (300)
Atualmente com 40% de desconto! A melhor solução para qualquer Trader Novato ou especialista! Este indicador é uma ferramenta de negociação exclusiva, de alta qualidade e acessível porque incorporamos uma série de recursos proprietários e uma nova fórmula. Com esta atualização, você poderá mostrar fusos horários duplos. Você não só será capaz de mostrar um TF mais alto, mas também mostrar ambos, o TF do gráfico, MAIS o TF mais alto: MOSTRANDO ZONAS ANINHADAS. Todos os traders de Oferta e Demanda
CRT Candle Range Theory HTF MT4.   Ultimate CRT Indicator: Advanced ICT Concepts and Malaysian SnR Trading System Discounted   Price   $50  !!     Secure your lifetime access   now   before it switches to   subscription-only ! Master the Market Maker's Footprints with the Most Advanced Candle Range Theory Indicator Unlock the true power of   Smart Money Concepts (SMC)   and trade precisely like the institutions with the   Ultimate CRT Indicator . Built exclusively for serious traders, this indic
Este indicador examina a estrutura de preços de fractais de diferentes períodos para determinar possíveis pontos de reversão no mercado, proporcionando tempo aos traders posicionais que já possuem um modelo de avaliação fundamental ou técnico. Diferentemente de seu irmão mais novo, Reversal Fractals , esse indicador não perde reversões por causa do período selecionado e encontra fractais de reversão em zigue-zague, ignorando as reversões que não possuem impulso suficiente para iniciar um movime
PZ Support Resistance
PZ TRADING SLU
3.33 (3)
Cansado de traçar linhas de suporte e resistência? A Resistência de suporte é um indicador de período múltiplo que detecta e plota automaticamente linhas de suporte e resistência no gráfico com um toque muito interessante: conforme os níveis de preços são testados ao longo do tempo e sua importância aumenta, as linhas se tornam mais espessas e mais escuras. [ Guia de instalação | Guia de atualização | Solução de problemas | FAQ | Todos os produtos ] Melhore sua análise técnica da noite para o d
O indicador " Dynamic Scalper System " foi desenvolvido para o método de scalping, operando dentro de ondas de tendência. Testado nos principais pares de moedas e ouro, é possível a compatibilidade com outros instrumentos de negociação. Fornece sinais para a abertura de posições de curto prazo ao longo da tendência, com suporte adicional para o movimento dos preços. O princípio do indicador: As setas grandes determinam a direção da tendência. Um algoritmo para gerar sinais de scalping sob a fo
They say history repeats itself. What if you could prove it in real-time? The Propfolio Ghost Pattern is an advanced algorithmic pattern-matching engine. It empowers you to select any current price action structure on your chart and instantly scan thousands of historical candles to find the exact moment in the past where the market did the exact same thing. Once it finds the highest probability match, it projects the historical outcome into the future as "Ghost Candles"—giving you a highly calcu
Atomic Analyst
Issam Kassas
5 (5)
Primeiramente, vale ressaltar que este Indicador de Negociação não repinta, não redesenha e não apresenta atrasos, tornando-o ideal tanto para negociação manual quanto automatizada. Manual do utilizador: configurações, entradas e estratégia. O Analista Atômico é um Indicador de Ação de Preço PA que utiliza a força e o momentum do preço para encontrar uma vantagem melhor no mercado. Equipado com filtros avançados que ajudam a remover ruídos e sinais falsos, e aumentam o potencial de negociação.
ACTUALMENTE COM 26% DE DESCONTO!! Este indicador é uma super combinação dos nossos dois principais indicadores ( Advanced Currency Strength 28   &  Advanced Currency IMPULSE with ALERT ). Mostra valores de Força da Moeda para TICK-UNITS e sinais de alerta para 28 pares de Forex. Podem ser usadas 11 Tick-Units diferentes. Estas são 1, 2, 3, 4, 5, 6, 10, 12, 15, 20, e 30 segundos. A barra de Tick-Unit na sub-janela será mostrada e deslocada para a esquerda quando houver pelo menos 1 tick dentro
KURAMA GOLD SIGNAL PRO (MT4) — Sistema Completo de Trading XAUUSD com Filtro de 7 Camadas, TP/SL Automático e Pontuação de Qualidade SEM REPINTURA. SEM REDESENHO. SEM ATRASO. Cada sinal é permanente. O que você vê é o que recebe. BÔNUS: Compre a licença vitalícia e receba AI Zone Radar (valor $59) + manual PDF completo GRÁTIS. Me envie uma mensagem após a compra. AI Zone Radar: https://www.mql5.com/en/market/product/175834 CONFIADO POR TRADERS: Já utilizado por uma comunidade ativa de trader
Entre em contato comigo após a compra para obter um EA de bônus baseado neste indicador. A Self Optimizing Double MA Strategy é uma ferramenta de trading de nível profissional projetada para eliminar a adivinhação na escolha de parâmetros. Impulsionada por um motor de auto-otimização integrado, adapta-se continuamente às mudanças nas condições do mercado, simulando milhares de combinações de parâmetros em segundo plano para manter uma vantagem estatística. Em vez de depender de configurações es
Gold Scalper Super
Aleksandr Makarov
5 (2)
Gold Scalper Super is an easy-to-use trading system. The indicator can be used as a standalone scalping system on the M1 time frame, as well as part of your existing trading system. Bonus: when purchasing an indicator, Trend Arrow Super is provided free of charge, write to us after purchase. The indicator 100% does not repaint!!! If a signal appears, it does not disappear! Unlike indicators with redrawing, which lead to the loss of a deposit, because they can show a signal and then remove it.
ACTUALMENTE COM 40% DE DESCONTO A melhor solução para qualquer novato ou comerciante especializado! Este Indicador é uma ferramenta comercial única, de alta qualidade e acessível, porque incorporámos uma série de características proprietárias e uma nova fórmula. Com apenas UM gráfico, pode ler a força da moeda para 28 pares de Forex! Imagine como a sua negociação irá melhorar porque é capaz de apontar o ponto exacto do gatilho de uma nova tendência ou oportunidade de escalada? Manual do util
Um indicador técnico que estrutura gráficos e identifica movimentos cíclicos de preços. Pode funcionar em qualquer gráfico. Vários tipos de notificações. Existem setas adicionais no próprio gráfico. Sem redesenhar a história, trabalha no fecho da vela. TF recomendado a partir de M5 e superior. Parâmetros fáceis de utilizar e configurar. Ao utilizar 2 indicadores com parâmetros diferentes, pode utilizá-los sem outros indicadores. Tem 2 parâmetros de entrada Ciclicidade e duração do sinal Estes
Mais do autor
This indicator is designed for M1 timeframe and shows: Sum of points when the price goes up (Green Histogram). Sum of points when the price goes down (Red Histogram).  In other words, by the number and ratio of bullish points to bearish ones, you can do a technical analysis of the state of the market. If the green histogram prevails over the red one, you can conclude that at the moment the buyers are stronger than the sellers, and vice versa, if the red histogram prevails over the green, the se
This Multi TimeFrame indicator is based on the "Fractals" classical indicator. 2 Inputs: TimeFrame1; TimeFrame2; You can put any available TimeFrame values (from M1 (Period_M1) to MN1 (Period_MN1)) equal or greater ( >= ) than the Period of the current Time Frame. The last Fractals will shown as color lines (Dots Line) of Support and Resistance for the Price moving.
This is a Multi-Time indicator which allows to display RSI and Stochastic indicators from upper timeframes on a single chart. As an example: a single chart EURUSD M5 and RSI (blue line) and Stochastic (yellow line) from H1. Red Histogram is representing Lower trend and Green Histogram is representing Upper trend.
When you put this Multi TimeFrame Parabolic SAR indicator on the chart it will automatically use Parabolic SAR from next available 3 timeframes. Green arrow will show the beginning of Up trend and Red arrow will show the beginning of Down trend. If AlertsEnabled = true, the indicator will show the Alert (message window) with a text like this: "Price going Down on ", Symbol(), " - ", Period(), " min", " price = ", Bid; If eMailEnabled = true the Indicator will send you an eMail with the same text
The zero line is characterized the Flat trend. V-shaped impulse indicates the entrance to the opposite direction. U-shaped impulse = entry orders in the same direction. If AlertsEnabled = true, the indicator will show the Alert (message window) with a text like this: "Price going Down on ", Symbol(), " - ", Period(), " min", " price = ", Bid; If eMailEnabled = true the indicator will send you an eMail with the same text an Alert message with subject: "Trinity-Impolse" (of course you have to chec
The indicator displays the usual Moving Average with input parameters: maPeriod_1; maMethod_1; maAppPrice_1. Then it calculates and displays MA on MA1 with input parameters: maPeriod_2; maMethod_2. Then it calculates and displays MA on MA2 with input parameters: maPeriod_3; maMethod_3. If AlertsEnabled = true the Indicator will show the Alert (message window) with a text like this: "Price going Down on ", Symbol(), " - ", Period(), " min", " price = ", Bid; If eMailEnabled = true the Indicator w
Multi TimeFrame Indicator "MTF CCI Trigger" based on the Commodity Channel Index from the upper TF (input parameter "TimeFrame") yellow line. Aqua line is representing ATR envelopes from the current TF. Green and Red arrows is triggered by CCI and represented UP and DOWN trends accordingly.
The BBImpulse indicator is based on the standard Moving Average indicator. You have MA input parameters: maPeriod - Moving Average period; maMODE - Moving Average mode (0 = MODE_SMA; 1 = MODE_EMA; 2 = MODE_SMMA; 3 = MODE_LWMA); maPRICE - Applied price (0=PRICE_CLOSE; 1=PRICE_OPEN; 2=PRICE_HIGH; 3=PRICE_LOW; 4=PRICE_MEDIAN; 5=PRICE_TYPICAL; 6=PRICE_WEIGHTED). Green Histogram is representing an UP-trend, Red Histogram is representing a Down-trend.
Multi TimeFrame indicator MTF ADX with Histogram shows ADX indicator data from the TF by your choice. You may choose a TimeFrame equal or greater than current TF. Yellow line is representing a price trend from the upper TF. Green line is representing +DI from the upper TF. Red line is representing -DI from the upper TF. Green histogram is displaying an Up-trend. Red histogram is displaying a Down-trend.
This Indicator creates 2 white lines based on Exponential Moving Averag e of High and Low prices. You can regulate how many bars will be involved in the calculation with input parameter HL_Period. Red and Blue arrows are displaying the moment to go Short and Long trades accordingly.
The most common way to interpreting the price Moving Average is to compare its dynamics to the price action. When the instrument price rises above its Moving Average, a buy signal appears, if the price falls below its moving average, what we have is a sell signal. To avoid a spontaneous entries one may use this update from Moving Average Indicator = Stepper-MA.
Envelopes technical Indicator is formed with two Moving Averages one of which is shifted upward and another one is shifted downward. Envelopes define the upper and the lower margins of the price range. Signal to sell appears when the price reaches the upper margin of the band; signal to buy appears when the price reaches the lower margin. To avoid a spontaneous entries one may use this update from Envelopes Indicator = Envelopes-Stepper.
The interpretation of the Bollinger Bands is based on the fact that the prices tend to remain in between the top and the bottom line of the bands. Abrupt changes in prices tend to happen after the band has contracted due to decrease of volatility; If prices break through the upper band, a continuation of the current trend is to be expected; If the pikes and hollows outside the band are followed by pikes and hollows inside the band, a reverse of trend may occur; The price movement that has starte
Fibonacci sequence is defined by integer sequence: 0, 1, 1, 2, 3, 5, 8, 13, 34, 55, 89, 144, ... By definition, it starts from 0 and 1, the next number is calculated as a sum of two previous numbers. Instead of the standard moving average, the indicator uses the caluclation of average price in form: Bar0 + Bar1 + Bar2 + Bar3 + Bar5 + Bar8 + Bar13 +... Input parameters:  FiboNumPeriod (15) - Fibonacci period; nAppliedPrice (0) - applied price (PRICE_CLOSE=0; PRICE_OPEN=1; PRICE_HIGH=2; PRICE_LOW=
This indicator present a main Moving Average line with input parameters maPeriod_1, maMethod_1 and maAppPrice_1. The second line will be a calculation of the Moving Average data of a first line with input parameters maPeriod_2, maMethod_2. The third line will be a calculation of the Moving Average data of a second line with input parameters maPeriod_3, maMethod_3. To avoid a spontaneous entries one may use this indicator-stepper.
This indicator (as almost all others) is based on classical Moving Averages. It shows the Average Bar under the current bar colored in aqua or over the current bar colored in orange. Input Parameters: ma_Period and ma_Method. The Average Bar maybe helpful to predict where the price will move in the nearest future. Of course, this "near future" depends of the current time frame.
Buy when the market is falling and sell when the market is rising. When the market is moving down you start observing and looking for buy signals. When the market is moving up you start looking for sell signals. This indicator points to the moments to Buy (Blue arrow) and to Sell (Orange arrow). Two input parameters: barsNumber and step for optimization (depending on symbol and Time Frame).
This indicator shows: A green light in case the price goes up; A red light in case the price goes down; A yellow light in case there are a sideways trend. A sideways trend is the horizontal price movement that occurs when the forces of supply and demand are nearly equal. This typically occurs during a period of consolidation before the price continues a prior trend or reverses into a new trend
This indicator is created for M1 timeframe. It shows how many ticks has occurred during current minute and ( after the slash) the sum of points Up (aqua color) and Down (orange color). In times of a high trading activity a grow up number of ticks Up and Down will signal of a big move of the price in the near future. In times of a high trading activity a grow up number of sum of points Up and Down will signal of a big move of the price in the near future too.
Two yellow lines. This is similar to classical Envelopes but with automatic deviation. The Envelopes indicator is   a tool that attempts to identify the upper and lower bands of a trading range. Aqua line. This is a classical Commodity Channel Index added to the Envelopes on the chart, not in a separate window. The Commodity Channel Index ( CCI ) is a technical   indicator   that measures the difference between the current price and the historical average price.
Probability deals with the likelihood of an event happening.   Forex   probability indicates a possibility at a specific time. This is because the forex market is highly volatile, and predicting future events affecting it is impossible. This indicator will show a positive number above the current High or negative number under the current Low as a probability of the trend. Higher time frames usually show a higher probability, even more then 100%.
Envelopes is an excellent indicator when the market is trending. Open Long position when the ClosePrice crossed the upper Aqua band. Close Long position when the Price crossed the upper Yellow band moving down. Open Short position when the ClosePrice crossed the lower Aqua band. Close Short position when the Price crossed the lower Yellow band moving up.
Moving Average Bars is a self-explanatory indicator with one input parameter: nPeriod. When the previous Price Close is above the previous indicator Bar, the probability to go Long is very high.   When the previous Price Close is under the previous indicator Bar, the probability to go Short is very high.
This indicator is based on the same idea as https://www.mql5.com/en/market/product/2406 , but instead of Average Bars it uses series or Fibonacci sequence. When the previous Price Close is above the previous indicator Bar, the probability to go Long is very high. When the previous Price Close is under the previous indicator Bar, the probability to go Short is very high.
This indicator is based on two ideas: Correlations between 5 main currency pairs: EURUSD, GBPUSD, USDCHF, USDJPY, USDCAD; US Dollar Index = the value of the United States dollar relative to a basket of foreign currencies. The use of the indicator is the same as classical  Commodity Channel Index  (CCI) indicator. CCI is calculated with the following formula:  (Typical Price - Simple Moving Average) / (0.015 x Mean Deviation) (Typical Price - Simple Moving Average) / (0.015 x Mean Deviation)
A  tick  is a measure of the minimum upward or downward movement in the  price  of a security. A  tick  can also refer to the change in the  price  of a security from one trade to the next trade.  This indicator will show amounts of ticks when the price goes up and down. This indicator is designed for M1 time frame and shows: Sum of points when the price goes up (Green Histogram). Sum of points when the price goes down (Red Histogram). 
This indicator is a combination of 2 classical indicators MA and RVI. The Relative Vigor Index (RVI) is a momentum indicator used in technical analysis that measures the strength of a trend by comparing a security's closing price to its trading range while smoothing the results using a simple moving average   The input parameter  counted_bars  determines how many bars the indicator's lines will be visible. The input parameter MaRviPeriod  is used for MA and RVI calculation.
This indicator is a combination of 2 classical indicators: MA and Force Index. The input parameter  counted_bars  determines on how many bars the indicator lines will be visible. The input parameter  MaForcePeriod  is used for MA and Force calculation. You may go Long if the current price crossed Up the Ribbon (HISTOGRAM)  and you may go Short if the current price crossed Down the Ribbon (HISTOGRAM)
This indicator is a combination of 2 classical indicators: MA and CCI. Two moving averages form Upper and Lower bands. The input parameter  counted_bars  determines on how many bars the indicator's lines will be visible. The input parameter  barsNum  is used for MA and CCI calculation.
This indicator is using 2 classical indicators: Commodity Channel Index from the higher TF (which you may change using input parameter TimeFrame ) and Average True Range from the current TF. The Green ribbon indicates the upper trend and the Red ribbon indicates the down trend. Buy when the Yellow line crosses the Upper bound (Aqua line). Sell when the Yellow line crossover the Lower bound (Aqua line).
Filtro:
Sem comentários
Responder ao comentário