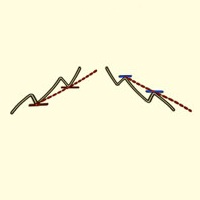
Zibi Market Structure
- Indicadores
- Versão: 5.12

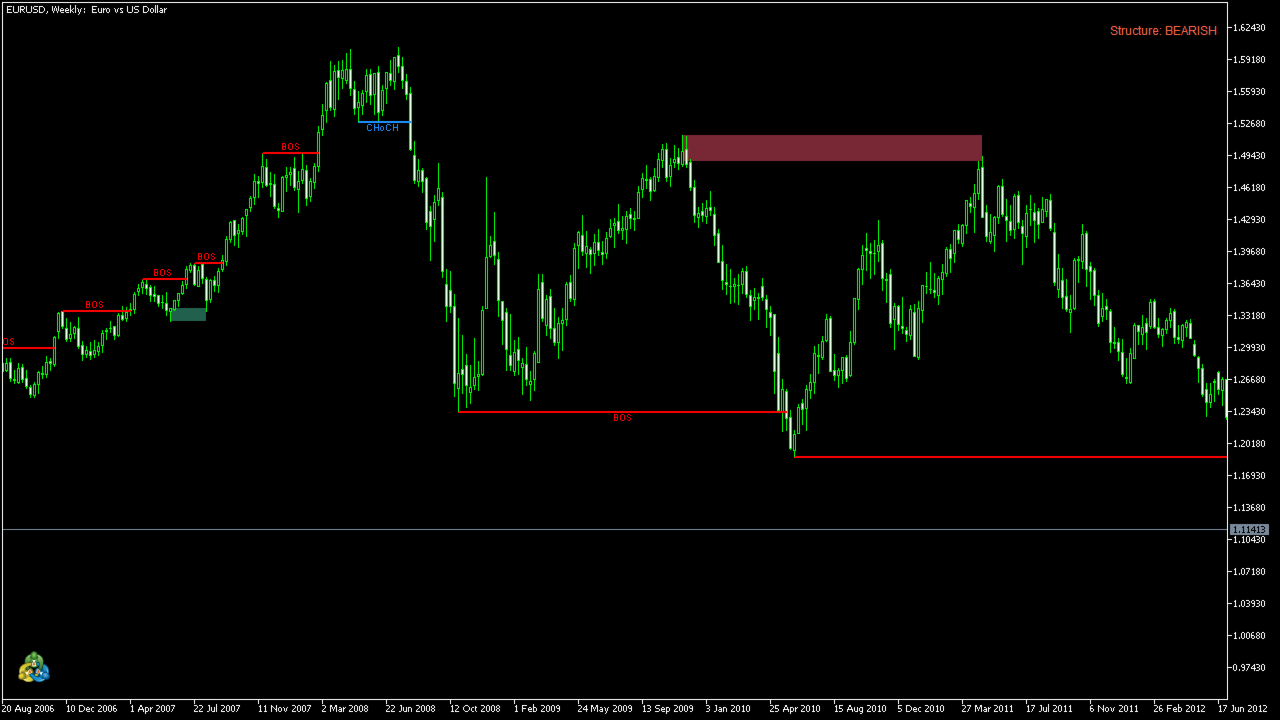
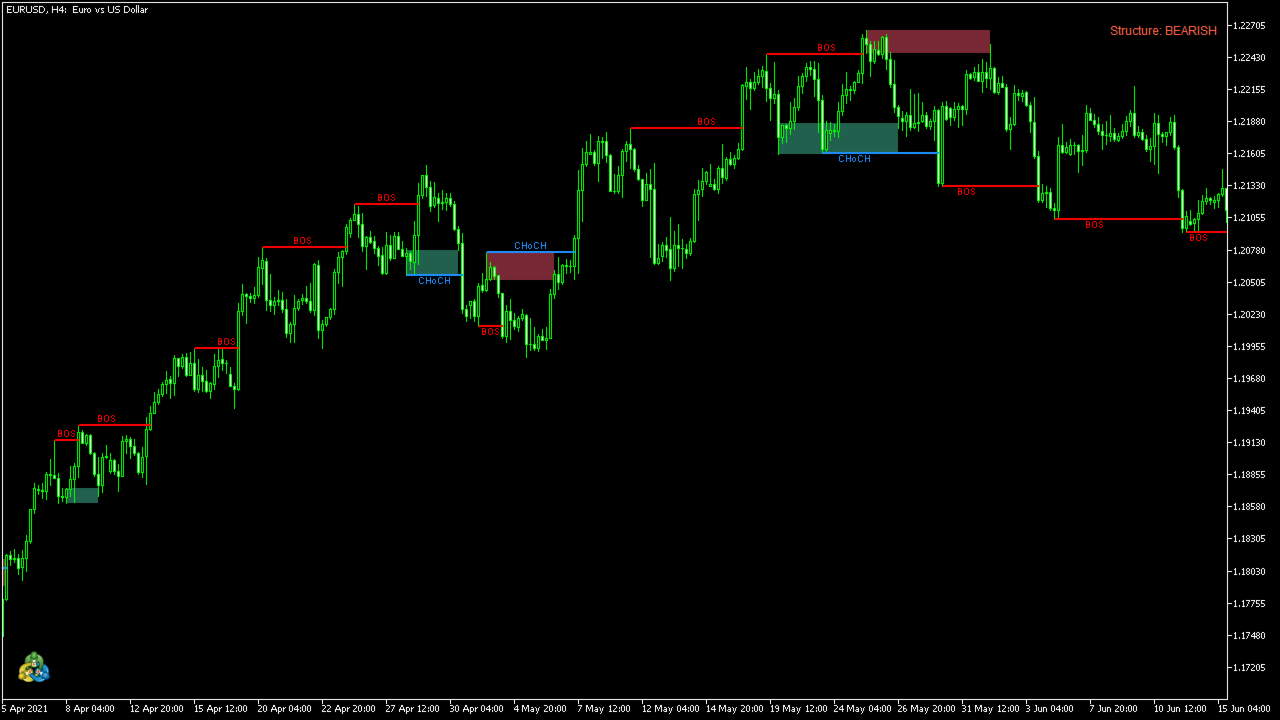
Zibi Market Structure marks market structure the way SMC traders draw it by hand: Break of Structure, Change of Character and Order Blocks.
How it works
- Swing highs and lows are confirmed with a fractal of N bars on each side (default 5).
- A break needs a candle BODY close beyond the swing. A wick alone is not a break.
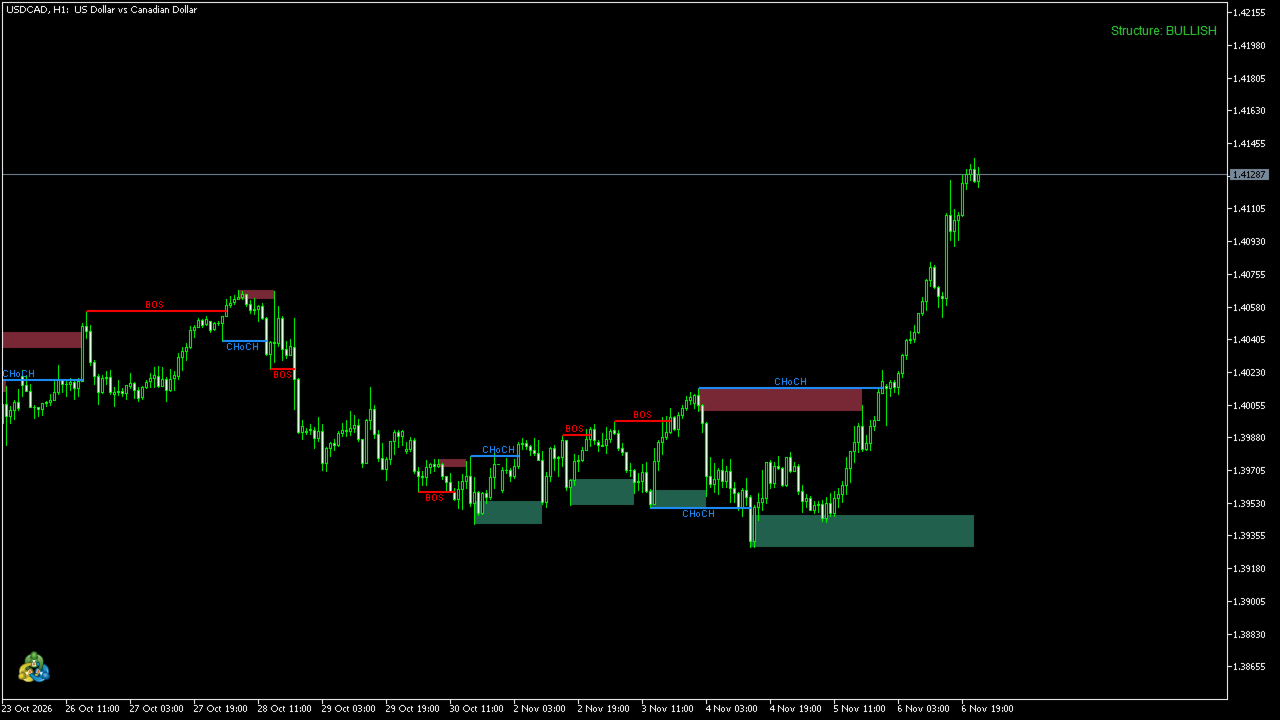
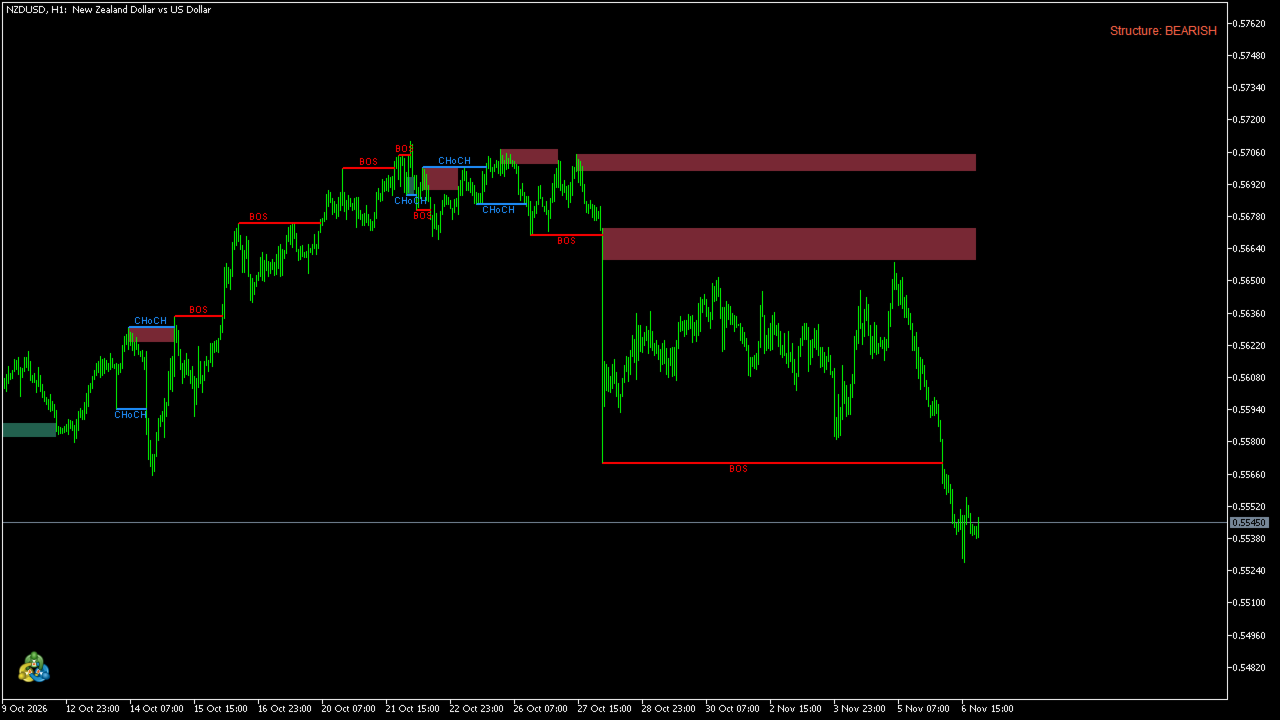
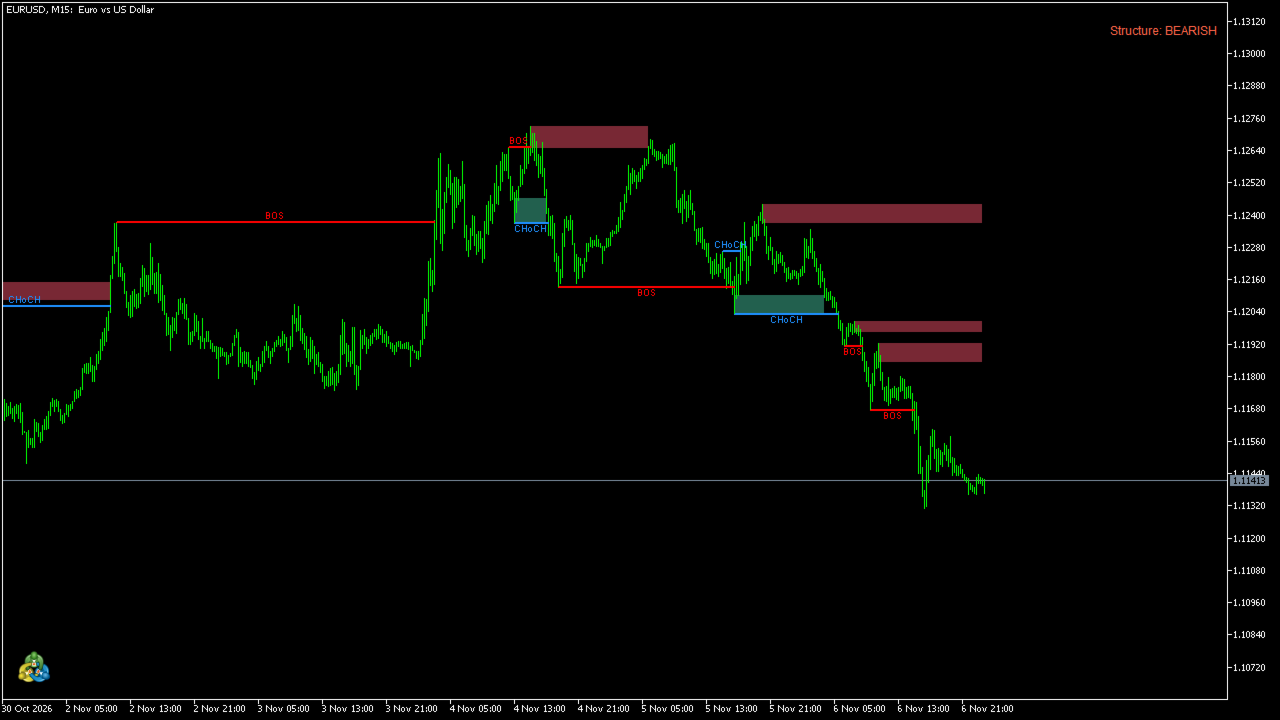
- BOS (red line): a swing is broken in the direction of the current trend.
- CHoCH (blue line): a swing is broken against the current trend, the first sign of a possible reversal.
- The line starts at the broken swing and ends at the candle that closed beyond it.
- Order Block: the extreme candle between the broken swing and the break. Bullish OB green, bearish OB red.
- After a bullish CHoCH, the first bullish OB is drawn at the origin of the move that made the CHoCH, and a new one at every following bullish BOS (bearish side: the same in reverse).
- An Order Block extends to the right until price returns into it (a wick touch counts as mitigation). The box then ends at that candle and stays on the chart.
- When the trend changes with an opposite CHoCH, all Order Blocks of the old direction that were never touched are removed. Trading them would mean trading against the new structure, so they are no longer relevant. Mitigated Order Blocks stay visible as history.
- The OB sits on the real extreme candle of the move. Its height is measured from that extreme and limited to 1 ATR, so zones stay precise even after very large candles.
- Works on any symbol: Forex, metals, indices, crypto.
- Each timeframe is calculated from its own candles. Structure on M15 is independent from structure on H4.
- On M1 and M5 only CHoCH is drawn by default to keep low timeframes clean (adjustable).
- Trend label in the chart corner shows the current structure: bullish or bearish.
No repaint
Only closed candles are used. A swing needs N bars after it to be confirmed, so a line appears N bars after the swing point. Structure lines never change once drawn. The only objects that change are untouched Order Blocks: they are removed when an opposite CHoCH invalidates them, as described above.
Inputs
- Bars to analyse / Draw objects from the last N bars
- Swing length (bars on each side)
- Break needs candle body close
- Show BOS / CHoCH, colours, line width, text labels
- Show BOS from timeframe (lower timeframes: CHoCH only)
- Show Order Blocks, bullish / bearish colours, max box length (0 = until touched), end on touch, end on close through
- Alert on BOS / CHoCH, push notification
Notes
This is a visual tool for reading structure. It does not open trades and does not predict price. Use it together with your own analysis and risk management.
Feedback and feature requests are welcome in the comments.