Currency Strength Meter with Open Formula

Currency Strength Meter MTF combines the 28 pairs of the 8 major currencies (USD, EUR, JPY, GBP, AUD, NZD, CAD, CHF) into one strength value per currency. It draws 8 lines in a subwindow and shows a ranking table for the chart timeframe, M15, H1, H4 and D1.
The full formula is published below. The indicator shows the relative strength of past price changes calculated by a fixed formula. It is an analysis aid. It does not tell you when to buy or sell, and it does not show future price movement.

FEATURES
- Strength lines: 8 lines in a subwindow, with the currency name and value at the right end.
- Multi-timeframe ranking table: rows for the chart timeframe, M15, H1, H4 and D1 (changeable), with the 8 currencies sorted from strongest to weakest.
- 28-pair difference list (off by default): "strength of the base currency - strength of the quote currency", largest difference first.
- Extra symbols (empty by default): up to 3 symbols such as gold or stock indices, shown in a separate table with the same % change. They are not used for the 8 currencies.
- Prefix / suffix: detected automatically from the chart symbol name, or set manually.
- Alerts (off by default): the 1st or the 8th currency changed; the difference between the 1st and the 8th rose above a threshold. Pop-up, sound, push notification and / or e-mail.
- Chart text, table and alerts in English or Japanese.

FORMULA
- Pair change = (close of the last closed bar / close of the closed bar N bars earlier - 1) x 100 (%). N = 20 by default.
- Currency strength = the mean of the changes of the available pairs that contain the currency.
- The sign is kept when the currency is the base currency (EUR in EURUSD) and flipped when it is the quote currency (USD in EURUSD).
- Time alignment: on each timeframe, the time T of the chart symbol's closed bar is the reference. Each pair uses the close of its last bar at or before T (the same for the bar N bars earlier).
- When a pair has no bar at that time (for example a market holiday), the value at that time (its last bar at or before T) is used as it is.
- Missing pairs are excluded and the number of pairs used is shown. When a currency has fewer than 7 pairs, the table shows the number used, for example "(6)".

WHAT CAN AND CANNOT CHANGE (please read)
- Only closed bars are used. The forming bar has no value and no line.
- Values of closed bars do not change later.
- Exception: when a pair that was not ready during the first load arrives later, the whole timeframe is recalculated to include it, and past values change at that time. The same full recalculation happens when a pair is excluded after repeated loading failures, and when the terminal reloads the chart history.
- Values appear about 10 to 60 seconds after a bar closes (the indicator waits for the bars of the other pairs to close).
- The last bar on Friday is shown only after the first tick on Monday. Over the weekend, D1 values therefore end on Thursday.

FIRST LOAD
- While the terminal loads the history of the other pairs, "Waiting for data (n/28)" is shown for up to 30 seconds, then "Calculating...".
- Many bars use much memory. In our check, 100,000 bars on M1 increased the terminal's memory by about 0.8 GB. Keep "Bars drawn in the subwindow" (5000 by default) and the terminal's "Max bars in chart" to what you need.

PREFIX AND SUFFIX
- If the chart symbol contains one of the 28 pair names, the characters before and after it are used as the prefix and suffix (for example ".x" for "EURUSD.x").
- On a chart whose symbol contains no pair name (for example gold), automatic detection is not possible. Set the prefix / suffix manually. A manual prefix / suffix has priority.
- Pairs that are not found are excluded and listed below the table as "Not available (excluded)". The list has up to 6 lines; the rest is shown as "+n more".
- When no pair is found, "No pairs (0/28). Check prefix/suffix" is shown.
- The subwindow name shows N and the number of pairs used (for example 28/28).

DISPLAY
- By default the ranking table is on the main chart, in the corner that overlaps the candles least. When the one-click trading panel is shown, a top-left table is moved below the panel.
- Table position: main chart auto or one of 4 corners, or subwindow auto or one of 4 corners.
- The 28-pair difference list is off by default.
- Extra symbols are shown in a separate table below the ranking table.
- No values in the Data Window. Values can be read with iCustom / CopyBuffer (buffers 0-7 = USD, EUR, JPY, GBP, AUD, NZD, CAD, CHF).
- Two copies can run on one chart. The second gets "#2" (numbered in load order). Two tables on the main chart are crowded, so turn the second table off or put it in the subwindow.

ALERTS
- Alerts tell you that a condition was reached. They are not buy or sell signals.
- Conditions: the 1st or the 8th currency changed; the difference between the 1st and the 8th rose above the threshold (1.0% by default). Both are off by default.
- The alert timeframe is chosen separately from the chart timeframe (H1 by default) and checked once per closed bar.
- As a guide, in our check alerts came about 10 times per day on H1. The number depends on the market and the settings.
- No alerts in the Strategy Tester.
- Push notifications and e-mail need the terminal's settings.

IMPORTANT
- Currency strength is a relative comparison of past price changes by a fixed formula. It does not show trade timing, profit or future price movement. Past charts do not guarantee future results.
- Strength depends strongly on N and the timeframe. At the same moment, the ranking can be reversed on another timeframe.
- In quiet markets the differences are small and the ranking changes often.
- If your account does not offer some pairs, fewer pairs are used.
- Objects whose names start with "CSM_<number>_" are treated as this indicator's drawings and are cleaned up. Do not use such names for your own objects.
- With an input outside its range, the indicator does not start ("invalid input parameters" in the Experts tab).

OTHER
- MetaTrader 5 only. Designed for accounts that offer the 28 pairs. It can be attached to a chart of any symbol and timeframe.
- Works with templates and after a terminal restart.
- No DLLs, no external files, no internet access.
- Support through MQL5 messages, reply within 3 business days: installation, settings and bug reports only. Questions about market views, trade decisions or how to read a result cannot be answered.

Produtos recomendados
Smart Adaptive Trend Flow MT5 Professional adaptive trend, market structure, price levels and flow analysis indicator for MetaTrader 5. Would you like to test it before purchasing? You can request a fully functional trial version by sending us a private message through the MQL5 messaging system . This allows you to evaluate the indicator and all its features before making a purchase decision. A Complete Market View in a Single Chart Smart Adaptive Trend Flow MT5 has been developed to provide a
Introducing RSIScalperPro - the revolutionary RSI-based indicator for Metatrader 5, specifically designed for scalping in the one-minute chart. With RSIScalperPro, you'll have a powerful toolkit for precise entry and exit signals to take your trading to the next level. RSIScalperPro utilizes two different RSI indicators that provide clear signals for overbought and oversold areas. You can customize the time periods and limit values of the two RSIs according to your preferences to achieve the be
This EA has been developed, tested and traded live on NASDAQ M15 TF. Everything is ready for immediate use on real account. Very SIMPLE STRATEGY with only FEW PARAMETERS.  Strategy is based on  EXPANSION ON THE DAILY CHART .   It enters if volatility raise after some time of consolidation .  It uses  STOP   pending orders with  ATR STOP LOSS.   To catch the profits is a  TRAILING PROFIT  function in the strategy.  EA has been backtested on more than 10-year long tick data with 99% quality of mo
Ranked Support & Resistance Zones – Graded Strength Scoring Automatically detects support and resistance zones and ranks each one by strength — Weak, Standard, Strong, or Mitigated — so you instantly know which levels the market actually respects.Most S/R indicators draw lines. This one tells you which lines matter. NOEL_RankedSR_Zones scans price action and builds zones automatically, then scores each one in real time based on how many times it's been tested and how cleanly price has reacted.
MTF Candlestick Patterns Detector: Seu Centro de Comando Definitivo de Price Action No mundo acelerado do trading, perder um único padrão de reversão pode ser a diferença entre uma semana lucrativa e uma oportunidade perdida. O MTF Candlestick Patterns Detector é um indicador profissional para MQL5 projetado para escanear, detectar e agregar simultaneamente mais de 24 padrões lendários de candles em todos os timeframes. Pare de caçar e adivinhar nos gráficos. Deixe que o algoritmo traga os setu
NeuroTrend Dashboard – Advanced Multi-Asset Market Intelligence NeuroTrend Dashboard is a professional-grade technical analysis suite designed to provide a high-level, "bird’s-eye view" of market momentum across multiple symbols and timeframes simultaneously. By synthesizing complex proprietary momentum, real-time currency strength, and volume flow data, NeuroTrend distills the pulse of the market into a clean, actionable interface. Stop wasting time switching between individual chart windows. N
MULTI CANDLE PATTERN MULTI FILTER SIGNALS No-Repaint Buy and Sell Arrows for MetaTrader 5 PRODUCT TYPE Type            : Technical Indicator Platform        : MetaTrader 5 Display         : Chart window arrows Markets         : Forex, Gold, Indices, Crypto, Stocks, Oil Timeframes      : All timeframes (M1 to MN) Signals         : BUY and SELL arrows after candle close Repaint         : No. Forming candle stays empty Version logic   : Multi candle pattern + opt
Quick Lines Tool: um indicador conveniente para a construção de linhas de tendência e retângulos O Quick Lines Tool é um indicador poderoso e intuitivo para o MetaTrader 4, projetado para traders que precisam de ferramentas rápidas e eficazes para análise técnica. Com este indicador, você pode facilmente criar linhas de tendência, níveis de suporte/resistência (AP/DW) e retângulos, otimizando o processo de marcação de gráficos. O indicador é ideal tanto para iniciantes quanto para traders prof
CURRENCYPOWER NAVIGATOR MT5 Currency Strength Ranking Dashboard TAGLINE See the strongest and weakest currencies before choosing the pair. PRODUCT OVERVIEW CurrencyPower Navigator MT5 is a currency-strength indicator for MetaTrader 5. Instead of focusing on one chart only, it evaluates a basket of major Forex pairs and estimates the relative strength of individual currencies. The indicator then ranks the main currencies and helps identify stronger-versus-weaker combinations that may offer
FREE
DUAL-ENGINE ANALYSIS SYSTEM: Average Tick Size Indicator : Measures bid movement strength across 6 customizable lookback periods (36, 96, 369, 500, 1000, 2000 ticks) Multi Timeframe Tick Analyzer : Calculates buy/sell pressure percentages across 6 different timeframes (100.200,300,400,500,600 ticks) REAL-TIME SIGNAL GENERATION: Combined Buy/Sell Alerts : Only triggers when BOTH analytical engines confirm the same direction Visual Arrow Signals : Clear green up arrows for buy signals, red down
Clarity Pulse Detector
Camila Bernardez Camero
Clarity Pulse Detector Clarity Pulse Detector analisa velas fechadas e suas barras de volume associadas para identificar reversões genuínas de tendência sem depender de dados futuros. O indicador calcula a força do pulso com base nos parâmetros configuráveis SSP (Signal Strength Parameter) e compara máximos e mínimos recentes para detectar pontos de rompimento. Quando as condições necessárias são atendidas em uma vela fechada, a ferramenta desenha um marcador claro de compra ou venda nessa ve
Aegis XAU Extreme Edition Overview Aegis XAU Extreme Edition is a trend-following Expert Advisor designed exclusively for XAUUSD M1 . Rather than trading throughout the entire day, it focuses only on carefully selected trading sessions identified through extensive historical testing. By avoiding statistically unfavorable hours, the EA aims to improve overall trading efficiency while maintaining consistent long-term performance. The strategy combines: EMA Trend Filter EMA Pullback Entry ADX Tr
Algo Trading Indicaor MT5 The ATC ALGO indicator has been developed to work on the MetaTrader 5 platform. It has the same specifications and zones as the MetaTrader 4 version. There may be slight lag, which we believe is due to differences in MetaTrader 5 programming. We will work on improving it, God willing. MT5 Version                    https://www.mql5.com/en/market/product/170028 MT4 Version                    https://www.mql5.com/en/market/product/88034 With this indicator , you’ll have
Range Breakout XXX Pro
Saiful Izham Bin Hassan
Range Breakout XXX Pro é um Expert Advisor de trading multi-moedas e multi-carteira baseado em lógica de ruptura de intervalo por sessão, com segmentação adaptativa de volatilidade. Anexe-o a um único gráfico, defina a sua cesta de símbolos e o EA rastreará e negociará cada instrumento de forma independente, aplicando controles de risco globais a nível de portfólio. A estratégia central identifica os níveis de preço máximo (High) e mínimo (Low) formados durante uma janela de sessão definida pe
Capital Flow Strength places the average of the 8 major currencies (USD, EUR, GBP, JPY, AUD, NZD, CAD, CHF) at a neutral-basket baseline and compares currencies, gold, oil, stock indices and Bitcoin on the same standardized (sigma) scale. From a single engine it draws three lenses - currency strength, capital flow, and risk-on/off - so you can see where money is moving at a glance. Key features Neutral-basket currency strength across all 8 majors and 28 pairs (log-return based; the sum of the 8
Zephir Breakout
Bernardo Rippe Di Dio Castagna
Zephir Power Indicator v1.30 — Breakout Signal & Statistics Tool for MetaTrader 5 Full strategy Guide on purchase - Trader with track record and 8 years of experience  EXTRA COPY FOR TRADING VIEW FOR THIS INDICATOR Zephir Power Indicator v1.30 is a high-performance breakout detection tool for MT5 that identifies precise bullish and bearish entry points based on candle body breakouts, ATR filters, and optional trend confirmation. Designed for professional traders, this indicator visuall
Inspired by the popular beat the market maker Multi MA. Now available for MT5 to be utilized. Multi Exponential Moving Average (Multi-EMA) Indicator for MT5 The Multi-EMA Indicator is designed to help traders visualize multiple exponential moving averages on one chart with precision and clarity. It plots five customizable EMA lines, each with distinct colors, making it easy to identify market trend direction, strength, and potential reversal zones at a glance. Key Features: Plots five indepen

The   Pairs Cross indicator   is a unique tool for negatively correlated trading instruments, such as EURUSD and USDCHF currency pairs. It is based on a concept called pairs trading (or spread trading). Our indicator compares the strength of two currency pairs that are inversely correlated and quickly tells you when it’s time to buy the first pair and short a second pair, and vice versa. This is a straightforward approach to trading currency pairs that works very well. How to you use the Pairs
CRV Z-Score Engine is a professional market structure indicator that transforms raw price into normalized,  multi-horizon statistical structure model   It reveals: When price is statistically stretched When the market is transitioning between regimes When a move is structurally aligned across multiple horizons This is not a lagging oscillator . It is a multi-horizon statistical structure model built for serious traders. WHAT IS Z-SCORE? Z-Score measures how far price deviates from its n
Description (English) TrendStreaks Indicator — Analyze Consecutive Bullish and Bearish Runs The   TrendStreaks   indicator provides a clear statistical overview of bullish and bearish streaks in market trends. It automatically analyzes daily and weekly price data to identify how long uptrends or downtrends typically last, how strong they are, and what their average and maximum moves are (in pips and percent). Detects and counts all   bullish   and   bearish streaks   (series of consecutive up o
FREE
Indicador Crypto_Forex "HTF Bandas de Bollinger" para MT5. - Aprimore seus métodos de negociação com o indicador profissional "HTF Bandas de Bollinger" para MT5. HTF significa - Período de Tempo Superior. - Bandas de Bollinger é um dos melhores indicadores do mercado - ferramenta perfeita para negociação. - Aproximadamente 90% da ação do preço ocorre entre as duas bandas. - O indicador HTF Bandas de Bollinger é excelente para sistemas de negociação multi-período com entradas de Ação de Preço ou
Crypto Position Size Calculator - a free position size calculator built for cryptocurrency traders. Enter your account balance, risk percentage, entry and stop-loss prices, and instantly get the exact position size for BTC, ETH and any other crypto symbol your broker offers. Crypto prices move fast and vary wildly between coins, so a fixed position size can mean wildly different risk from one trade to the next. This calculator measures the distance to your stop in the coin's own price and conver
FREE
Tele PulseProMax MT5
Abdallah Bentelkhoukh
Tele PulsePro is a professional MetaTrader 5 utility designed to seamlessly bridge your trading terminal with Telegram. It instantly captures your market actions and sends clear, formatted trade execution alerts directly to your Telegram channel or group. Launch Special Offer: Available at $49 for the first 10 subscribers only, after which the price will increase permanently! Key Features: - Fully Customizable Message Templates: Tailor your message format completely to match your brand sty
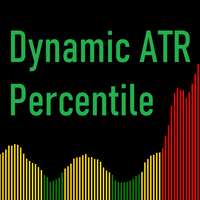
Dynamic ATR Percentile
Daniel Naranjo Morales
Percentil ATR Dinâmico Visão Geral O Percentil ATR Dinâmico é uma ferramenta de análise de volatilidade desenvolvida para ajudar os traders a avaliar objetivamente as condições atuais do mercado. A volatilidade não é estática; o que é considerado um valor "alto" de ATR para um instrumento ou timeframe pode ser "baixo" para outro. Este indicador resolve esse problema calculando zonas de volatilidade dinâmicas com base em dados históricos, fornecendo um guia visual claro e adaptável. Em vez de dep
O indicador   Accurate Gold   é uma ferramenta amigável que é   intuitiva   e   simples de usar   , independentemente do nível de experiência dos traders. Ele foi projetado para traders que buscam sinais precisos no período M5 no mercado de ouro. Este indicador emprega algoritmos matemáticos avançados para analisar movimentos de preços e dinâmica de volume, gerando sinais precisos de compra e venda. As características distintivas deste indicador, incluindo sua natureza de não repintura, fornecem
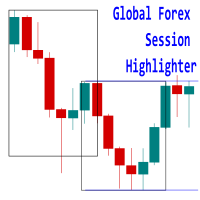
Introducing the 'Global Forex Session Highlighter' , a powerful tool designed to enhance your trading strategy by providing a visual representation of the Three major Forex trading sessions: Tokyo, London, and New York. This indicator is designed to help traders understand the dynamics of the global Forex market by highlighting the trading sessions directly on your MT5 chart. It provides a clear view of when each session starts and ends, allowing you to strategize your trades around the most act
G Channels – Efficient Adaptive Channel Indicator Introduction Channel indicators are widely used in technical analysis, offering valuable insights into price movements, trend identification, and volatility. Most channel-based indicators, such as Bollinger Bands and Keltner Channels, rely on a central tendency estimator (e.g., a moving average) combined with a volatility component to define upper and lower bands. The G Channels indicator takes this concept further by leveraging a highly efficie
Compare POC and value-area placement across Asia, London and New York sessions. BrioQuant Session Volume Profile builds a profile for the selected Asia, London or New York session, or place one profile inside every recent session window. Compare how POC and value area move, overlap or remain stable from session to session while retaining the range modes for individual chart studies. Two session workflows in addition to the range modes: Session mode: Asia, London or New York. Auto follows the act
SMC Vision
Kriangkrai Pongtiwat
SMC ProVision 2.0 — Professional Smart Money Concept Analysis Stop guessing. Start reading the market like institutions do. SMC ProVision maps the full smart money footprint directly on your chart — with a clean, minimal design that won't clutter your screen. Market Structure — BOS / CHoCH with HH・HL・LH・LL labels Order Blocks — Standard & Refined with mitigation tracking Breaker Blocks — Auto-converted from mitigated OBs Fair Value Gaps — Fill percentage & mitigation status Liquidity —
FREE
CRT + Volume Profile  Candle Range Theory levels on several timeframes, filtered by the previous session's volume profile, with lower-timeframe entries (CISD / MSS) and strips of higher-timeframe candles drawn right of price. One indicator for the whole CRT workflow: where the range is, whether the sweep happened at a level that matters, and where the entry shift is. HOW THE CRT MODEL IS DETECTED - C1 is the range candle. Its high and low become CRT H and CRT L, with the 0.5 level between the
Os compradores deste produto também adquirem
Trend Sniper X
Sarvarbek Abduvoxobov
4.86 (42)
Trend Sniper X é um indicador de acompanhamento de tendência para múltiplos tempos gráficos no MetaTrader 5 que ajuda os traders a identificar a direção da tendência e potenciais pontos de reversão com clareza e precisão. para MT4: https://www.mql5.com/en/market/product/193245 Informações sobre o preço: O preço atual é promocional e está sujeito a alterações à medida que novas atualizações e funcionalidades forem lançadas. Oferta Bônus: Para obter o Auto-Trade Assistant EA GRATUITO para este in
Smart Trend Trading System — MetaTrader 5 Após a compra, envie-me uma mensagem no MQL5 para receber Smart Universal Expert Advisor GRÁTIS, além do curso online, do manual em PDF e do acesso ao grupo privado. O STTS reúne a direção da tendência, sinais de entrada e saída, zonas de reversão e níveis de preço importantes diretamente no seu gráfico. Siga o sistema manualmente ou conecte um EA compatível separado para executar operações automaticamente com as configurações que você escolher. UM SISTE
Tenha sua vantagem no trading à vista! M5 Sniper é um novo indicador da MeanFX. Ele combina sinais de trading precisos com níveis adaptativos de TP/SL — criando, como resultado, as melhores operações estatísticas possíveis! O preço aumenta a cada 5 compras, o próximo preço é de 69$ Envie-me uma mensagem após a compra para receber dicas/guia e um EA bônus O que o faz se destacar? Desempenho estatístico comprovado no Gold XAUUSD ( funciona em praticamente todos os ativos , com foco em dominar um ú
Um novo Rei chegou à cidade - Indicador + Gestão de Ordens (TP1 + TP2 + TP3) + Enviador opcional de sinais para Telegram INCLUÍDO (GRÁTIS) (SISTEMA COMPLETO DE TRADING e SINAIS) Nosso melhor EA para Ouro: Gold Slayer Este indicador inclui uma estratégia avançada, um sistema de trading com gestão de ordens personalizável e um sistema de reversão à média que combina extensões de envelopes, apoiado por múltiplos filtros inteligentes de confirmação, como o RSI, para capturar entradas de reversão de
SMC Intraday Formula
VividMind Digital Solutions
5 (26)
Vamos ser honestos primeiro. Nenhum indicador sozinho vai te tornar lucrativo. Se alguém te disser o contrário, está te vendendo um sonho. Qualquer indicador que mostre setas perfeitas de compra/venda pode ser feito para parecer impecável — basta dar zoom na parte certa da história e tirar um print das operações vencedoras. Nós não fazemos isso.  SMC Intraday Formula é uma ferramenta. Ela lê a estrutura do mercado para você, identifica as zonas de maior probabilidade de preço e mostra exatament
Auto Optimized SpeedAngle é um sistema de vetorização de momentum de nível institucional que elimina o sobreajuste ( curve-fitting ) por meio da otimização contínua de avanço ( Walk-Forward Optimization , WFO). Em vez de depender de entradas estáticas que se degradam quando os regimes de mercado mudam, o indicador recalibra dinamicamente seus parâmetros utilizando validação fora de amostra ( Out-of-Sample , OOS), garantindo que os sinais exibidos representem vantagens estatísticas genuínas e não
SuperScalp Pro
Van Minh Nguyen
4.54 (37)
SuperScalp Pro - Professional Multi-Layer Confluence Scalping System O SuperScalp Pro é um indicador avançado de scalping que aprimora o Supertrend clássico com vários filtros inteligentes de confirmação. Ele ajuda a identificar oportunidades de Buy/Sell com maior probabilidade de sucesso, reduzindo significativamente os sinais falsos. Setas claras de Buy e Sell aparecem diretamente no gráfico, juntamente com os níveis de Stop Loss e Take Profit baseados em ATR, calculados automaticamente em tem
Boba Analysis Suite
Trade Ready Solutions LLC
5 (1)
Boba Analysis Suite O Boba Analysis Suite é um indicador de análise para o MetaTrader 5. Reúne a estrutura do mercado, as zonas de preço relevantes e o contexto geral do mercado numa única visualização do gráfico. Desenvolvido a partir da experiência prática como trader e formador de traders, apoia um processo de análise estruturado: avaliar a direção do mercado, identificar níveis importantes e analisar vários períodos gráficos em conjunto. Análise em contexto O significado de cada sinal depend
A lenda está de volta: Entry Points Pro 10. O relançamento do lendário indicador que se manteve por 3 anos no Top-3 do MQL5 Market. Centenas de avaliações entusiasmadas (589 nas duas versões), milhares de traders operam com ele todos os dias, 31.000+ downloads da versão demo   MT4+MT5 . Li cada avaliação de vocês ao longo de cinco anos — e, em vez de promessas, coloquei as respostas dentro da versão 10. Do autor que está no mercado desde 1999 e valoriza a honestidade, a própria reputação e os se
Adaptive Price Action Engine Compre um indicador, ganhe o EA de graça Análise Auto-Otimizada de Tendências e Padrões de Candlestick em Múltiplos Timeframes Os mercados estão em constante mudança, e nem todos os padrões de Price Action têm o mesmo valor em todas as condições de mercado. O Adaptive Price Action Engine foi desenvolvido para se adaptar às mudanças nas condições do mercado, combinando estrutura de tendência, análise Multi-Timeframe, padrões de candlestick e otimização estatística em
M1 Sniper MT5
Oleg Rodin
5 (7)
O   M1 SNIPER   é um sistema indicador de negociação fácil de usar. É um indicador de seta projetado para o período M1. O indicador pode ser usado como um sistema independente para scalping no período M1 e pode ser usado como parte do seu sistema de negociação existente. Embora este sistema de negociação tenha sido projetado especificamente para negociação no M1, ele também pode ser usado em outros períodos. Originalmente, desenvolvi este método para negociar XAUUSD e BTCUSD. Mas considero-o úti
ARIPoint
Temirlan Kdyrkhan
1 (4)
ARIPoint is a powerful trading companion designed to generate high-probability entry signals with dynamic TP/SL/DP levels based on volatility. Built-in performance tracking shows win/loss stats, PP1/PP2 hits, and success rates all updated live. Key Features: Buy/Sell signals with adaptive volatility bands Real-time TP/SL/DP levels based on ATR Built-in MA Filter with optional ATR/StdDev volatility Performance stats panel (Success, Profit/Loss, PP1/PP2) Alerts via popup, sound, push, or email Cu
Gann Made Easy   é um sistema de negociação Forex profissional e fácil de usar, baseado nos melhores princípios de negociação usando a teoria do sr. W. D. Gann. O indicador fornece sinais precisos de COMPRA e VENDA, incluindo níveis de Stop Loss e Take Profit. Você pode negociar mesmo em movimento usando notificações PUSH. Entre em contato comigo após a compra para receber instruções de negociação e ótimos indicadores extras gratuitamente! Provavelmente você já ouviu muitas vezes sobre os método
FiboSniper Pro
Van Minh Nguyen
5 (4)
FiboSniper Pro – Multi-Filter Fibonacci System with Auto SL/TP and Control Panel FiboSniper Pro é um indicador técnico que combina Fibonacci Envelopes dinâmicos com vários filtros de confirmação para gerar sinais seletivos de Buy e Sell. Os níveis de Fibonacci são calculados com base em Moving Average e ATR e, em seguida, filtrados por ADX, EMA, RSI, ATR, Volume, Time e estrutura das velas. O indicador exibe diretamente no gráfico os níveis automáticos de Stop Loss e Take Profit baseados em ATR,
Break and Retest Hunter
Mohamed Hassan
3.67 (3)
Break and Retest Hunter is a powerful MetaTrader 5 indicator designed to automatically identify support and resistance levels, breakout structures, and potential retest opportunities in real time. Bonus Indicator: After purchasing Break and Retest Hunter , contact me to receive Trade Indicator Assistant EA completely free as a bonus utility. $65 for the next 10 copies . Next price is $120.  Combining adaptive market analysis, clear BUY/SELL signals, Fibonacci-based profit targets, and a premiu
Apex Patterns PRO Compre o indicador - Obtenha um Expert Advisor baseado nele GRATUITAMENTE. Inteligência Auto-otimizada de Padrões e Rompimentos Os rastreadores de padrões tradicionais dependem de entradas fixas, frequentemente apresentando baixo desempenho quando a volatilidade e as estruturas do mercado mudam. O Apex Patterns PRO foi projetado para se adaptar às mudanças nas condições do mercado, combinando o reconhecimento estrutural de padrões de gráfico, filtragem de momentum e auto-otimi
Próxima Atualização — Versão 2.52 em Breve! [NOVO] Prepare-se para 4 Grandes Novos Recursos Projetados para Aprimorar sua Análise de Mercado e seu Fluxo de Trabalho de Trading Estamos levando a análise de mercado a um novo nível com 4 novos recursos desenvolvidos para atender às suas necessidades de trading. Apresentamos: 1. TRADE OVERVIEW DASHBOARD 2. CONFLUENCE AT ZONE 3. STRONG & WEAK HIGH/LOW 4. OTE 1. TRADE OVERVIEW DASHBOARD Um painel que ajuda você a compreender mais facilmente o panoram
Neuro Poseidon MT5
Daria Rezueva
4.75 (52)
Neuro Poseidon is a new indicator by Daria Rezueva. It combines precise trading signals with adaptive TP/SL levels - creating best possible trades as a result! Message me and get  Neuro Poseidon Assistant  as a gift to automize your trading process! What makes it stand out? 1. Proven profitability on all assets and timeframes 2. Only confirmed BUY and SELL signals present on the chart 3. Adaptive TP & SL levels generated by the software for each trade 4. Easy to understand - suitable for al
Trend Catcher ind mt5
Ramil Minniakhmetov
5 (18)
INDICADOR TREND CATCHER O Indicador Trend Catcher analisa os movimentos de preços do mercado, utilizando uma combinação de indicadores de análise de tendências adaptativos, proprietários e personalizados pelo autor. Identifica a verdadeira direção do mercado, filtrando o ruído de curto prazo e focando a força do momentum subjacente, a expansão da volatilidade e o comportamento da estrutura de preços. Utiliza também uma combinação de indicadores personalizados de suavização e filtragem de tendê
Unix Scalper
Issam Kassas
4 (4)
Unix Scalper — MetaTrader 5 Após a compra, envie-me uma mensagem no MQL5 para receber Smart Universal Expert Advisor GRÁTIS, além do curso online, do manual em PDF e do acesso ao grupo privado. Identifique a oportunidade. Veja o plano. Escolha como operar. O UNIX Scalper reúne análise de mercado, decisões BUY/SELL/WAIT e níveis de Entry, Stop Loss, TP1 e TP2 em um painel organizado. VEJA O SINAL E O PLANO • Decisões claras: BUY, SELL ou WAIT. • Níveis definidos: Entry, Stop Loss, TP1 e TP2. •
Advanced Supply Demand MT5
Bernhard Schweigert
4.53 (15)
Atualmente com 33% de desconto! A melhor solução para qualquer Trader Novato ou especialista! Este indicador é uma ferramenta de negociação exclusiva, de alta qualidade e acessível porque incorporamos uma série de recursos proprietários e uma nova fórmula. Com esta atualização, você poderá mostrar fusos horários duplos. Você não só será capaz de mostrar um TF mais alto, mas também mostrar ambos, o TF do gráfico, MAIS o TF mais alto: MOSTRANDO ZONAS ANINHADAS. Todos os traders de Oferta e Demanda
FX Trend MT5 NG
Daniel Stein
5 (6)
FX Trend NG: A Nova Geração de Inteligência de Tendência Multi-Mercado Visão Geral FX Trend NG é uma ferramenta profissional de análise de tendências e monitoramento de mercado em múltiplos períodos de tempo. Permite compreender a estrutura completa do mercado em segundos. Em vez de alternar entre vários gráficos, você visualiza instantaneamente quais ativos estão em tendência, onde o momentum está enfraquecendo e onde existe alinhamento forte entre diferentes timeframes. Oferta de Lançamento
Apresentando       Quantum Breakout PRO   , o inovador Indicador MQL5 que está transformando a maneira como você negocia Breakout Zones! Desenvolvido por uma equipe de traders experientes com experiência comercial de mais de 13 anos,       Quantum Breakout PRO       foi projetado para impulsionar sua jornada comercial a novos patamares com sua estratégia de zona de fuga inovadora e dinâmica. O Quantum Breakout Indicator lhe dará setas de sinal em zonas de breakout com 5 zonas-alvo de lucro e su
O Scalper Vault é um sistema de negociação poderoso e completo, projetado para traders que buscam consistência em operações intraday. Este indicador de alta precisão funciona como um sistema de negociação autônomo, oferecendo análises de nível institucional tanto para o mercado Forex quanto para Opções Binárias. ENTRE EM CONTATO COMIGO APÓS A COMPRA PARA RECEBER DICAS DE NEGOCIAÇÃO E UM BÔNUS EXCLUSIVO! Ao eliminar suposições e análises manuais complexas, o Scalper Vault permite que você foque
Volatility Master for MetaTrader is a real-time dashboard tool that scans up to  50 symbols  to identify high-volatility , trending markets instantly. With bullish/bearish signals, customizable alerts, and a user-friendly interface, it helps you avoid range-bound conditions and focus on high-probability trades. Clarity leads to confidence. Trade confidently and protect your capital effectively with this powerful dashboard. We don't offer free or bonus indicators in exchange of reviews from you.
O   SR Liquidity   é um indicador de trading projetado para revelar as zonas ocultas onde a liquidez do mercado se concentra e o preço reage com maior intensidade. Essas áreas específicas de liquidez funcionam como níveis poderosos de suporte e resistência, oferecendo um mapa claro de onde é mais provável que o mercado reverta. Em vez de traçar linhas comuns de Suporte e Resistência, o SR Liquidity analisa o comportamento real dos preços para detectar as zonas onde se acumulam pressões de compra
Precision Spike Detector
Francisco Mandomo Simbine
5 (2)
Precision Spike Detector V3 – Institutional-Grade AI Trading System Attention: The price increases by US$50 for every 10 purchases.  Final price: US$599 Precision Spike Detector V3   is a   state-of-the-art, institutional-grade market analysis system   for   MetaTrader 5 , designed to detect   high-probability market movements   in synthetic indices such as   Boom, Crash, GainX, and PainX . After purchase, send me a private message to receive the optimized configuration files,  the installation
Btmm state engine pro
Garry James Goodchild
5 (4)
BTMM State Engine Pro by G-Labs — Beat The Market Maker indicator for MetaTrader 5. Asian session range, London and New York kill zones, level progression (L1/L2/L3), peak formation detection (PFH/PFL), entry signals, and a multi-pair scanner from one chart. Stop scanning charts one pair at a time. The State Engine tracks the BTMM daily cycle automatically — Asian box, room boundaries, level blocks, peak formations, and filtered entries — while the scanner dashboard shows level, peak status, d
Power Candles MT5
Daniel Stein
4.58 (12)
Power Candles V3 - Indicador de força com auto-otimização O Power Candles V3 transforma a força da moeda e do instrumento num plano de negociação prático em todos os gráficos aos quais está associado. Em vez de se limitar a colorir as velas, executa uma otimização automática em tempo real em segundo plano e apresenta-lhe os melhores valores de Stop Loss, Take Profit e limiar de sinal para o símbolo em questão. Basta um clique para o adotar na negociação em tempo real — as linhas de entrada, Stop
Matreshka
Dimitr Trifonov
5 (2)
Matreshka self-testing and self-optimizing indicator: 1. Is an interpretation of the Elliott Wave Analysis Theory. 2. Based on the principle of the indicator type ZigZag, and the waves are based on the principle of interpretation of the theory of DeMark. 3. Filters waves in length and height. 4. Draws up to six levels of ZigZag at the same time, tracking waves of different orders. 5. Marks Pulsed and Recoil Waves. 6. Draws arrows to open positions 7. Draws three channels. 8. Notes support and re
Mais do autor
RSI AutoScale is a clean, lightweight RSI for traders who use both TradingView and MetaTrader 5 and want the two charts to look the same. WHAT IT SHOWS - RSI (Wilder smoothing): the same values as the standard RSI, with any applied price. - Signal line on the RSI: SMA, EMA, SMMA or LWMA, with its own period. - Levels: upper, middle and lower lines (70 / 50 / 30 by default). They use MT5's native levels, so they reach the right edge and their values appear on the scale. - Zone fills: the middle
FREE
Elliott Wave Auto Count labels Elliott waves automatically on four degrees at the same time: the base degree and the three degrees above it. It follows the rules and guidelines of "Elliott Wave Principle" (Frost & Prechter). For the current wave it also shows a price x time target zone and an invalidation level. This is the MetaTrader 4 version; the counting logic is the same as in the MetaTrader 5 version (sold separately). HOW IT WORKS 1. Swings: five ATR(100)-based zigzags. Each higher degr
Dow Structure MTF shows the Dow theory trend structure of five timeframes at the same time, using the pullback low / rally high approach that is common among Japanese traders. For each timeframe you see whether the trend is up, down or range, which price would change it, and how far the current price is from that level. Only closed bars are used, so a confirmed result never changes afterwards (no repaint). This is the MetaTrader 4 version; the logic, inputs, display and alerts are the same as i
Fibo Price Time Zones combines Fibonacci price levels with Fibonacci time targets and draws them on the chart as boxes (price x time zones). It helps you organize which price areas to watch and roughly when. Where boxes from several waves and from higher timeframes overlap, the area is emphasized in three levels. Base waves are built only from confirmed swings, so a confirmed box does not move afterwards (see the conditions below). This is the MetaTrader 4 version; the calculation, inputs, defa
Time Average Lines draws four averages that are measured by time, not by the number of bars. When you switch timeframes, each line still averages the same length of time. The main line (3) averages how far price had moved from the day's open at the same clock time on past days, and the rest of today is shown as a dotted path that joins those past averages. The path is a summary of the past, not a forecast. THE FOUR LINES - (1) Time MA: average close of the bars that started within the last N m
Auto Trendline Channel MTF draws trendlines, parallel channels and horizontal support / resistance automatically from confirmed swing highs and lows. For each line it records the touch count, close breaks, wick breaks and retests. A table shows, for the chart timeframe and two higher timeframes, the nearest line above and below the price, the distance to it and the Dow theory direction. Touch counts and break records describe what happened on the past chart. They do not tell whether price will
Gold Pullback EA is a simple trend-following robot for XAUUSD (gold). It waits for the daily trend, buys or sells the pullback on H4, and lets winners run with an ATR trailing stop. HOW IT TRADES - Trend filter (D1): long only when EMA50 > EMA200 and the daily close is above EMA50; short only in the opposite case. - Entry (H4): price pulls back to EMA20 within the last 3 bars, then an H4 bar closes back beyond EMA20 and beyond the previous bar's high (low for shorts). - Stop loss: below the la
Elliott Wave Auto Count labels Elliott waves automatically on four degrees at the same time: the base degree and the three degrees above it. It follows the rules and guidelines of "Elliott Wave Principle" (Frost & Prechter). For the current wave it also shows a price x time target zone and an invalidation level. HOW IT WORKS 1. Swings: five ATR(100)-based zigzags. Each higher degree uses a larger swing threshold. The finest zigzag is hidden and is used only to count the sub-waves inside each l
Dow Structure MTF shows the Dow theory trend structure of five timeframes at the same time, using the pullback low / rally high approach that is common among Japanese traders. For each timeframe you see whether the trend is up, down or range, which price would change it, and how far the current price is from that level. Only closed bars are used, so a confirmed result never changes afterwards (no repaint). WHAT YOU SEE - Table of five timeframes (M15, H1, H4, D1, W1 by default, all changeable)
Fibo Price Time Zones combines Fibonacci price levels with Fibonacci time targets and draws them on the chart as boxes (price x time zones). It helps you organize which price areas to watch and roughly when. Where boxes from several waves and from higher timeframes overlap, the area is emphasized in three levels. Base waves are built only from confirmed swings, so a confirmed box does not move afterwards (see the conditions below). WHAT IT DRAWS - Price levels: retracement 38.2 / 50 / 61.8 / 7
Time Average Lines draws four averages that are measured by time, not by the number of bars. When you switch timeframes, each line still averages the same length of time. The main line (3) averages how far price had moved from the day's open at the same clock time on past days, and the rest of today is shown as a dotted path that joins those past averages. The path is a summary of the past, not a forecast. THE FOUR LINES - (1) Time MA: average close of the bars that started within the last N m
Auto Trendline Channel MTF draws trendlines, parallel channels and horizontal support / resistance automatically from confirmed swing highs and lows. For each line it records the touch count, close breaks, wick breaks and retests. A table shows, for the chart timeframe and two higher timeframes, the nearest line above and below the price, the distance to it and the Dow theory direction. Touch counts and break records describe what happened on the past chart. They do not tell whether price will
Filtro:
Sem comentários
Responder ao comentário