AI Pivot Points Multi Type Indicator
- Indicadores
- Versão: 1.0

Five pivot point methods and three periods in one clean indicator.
How it works
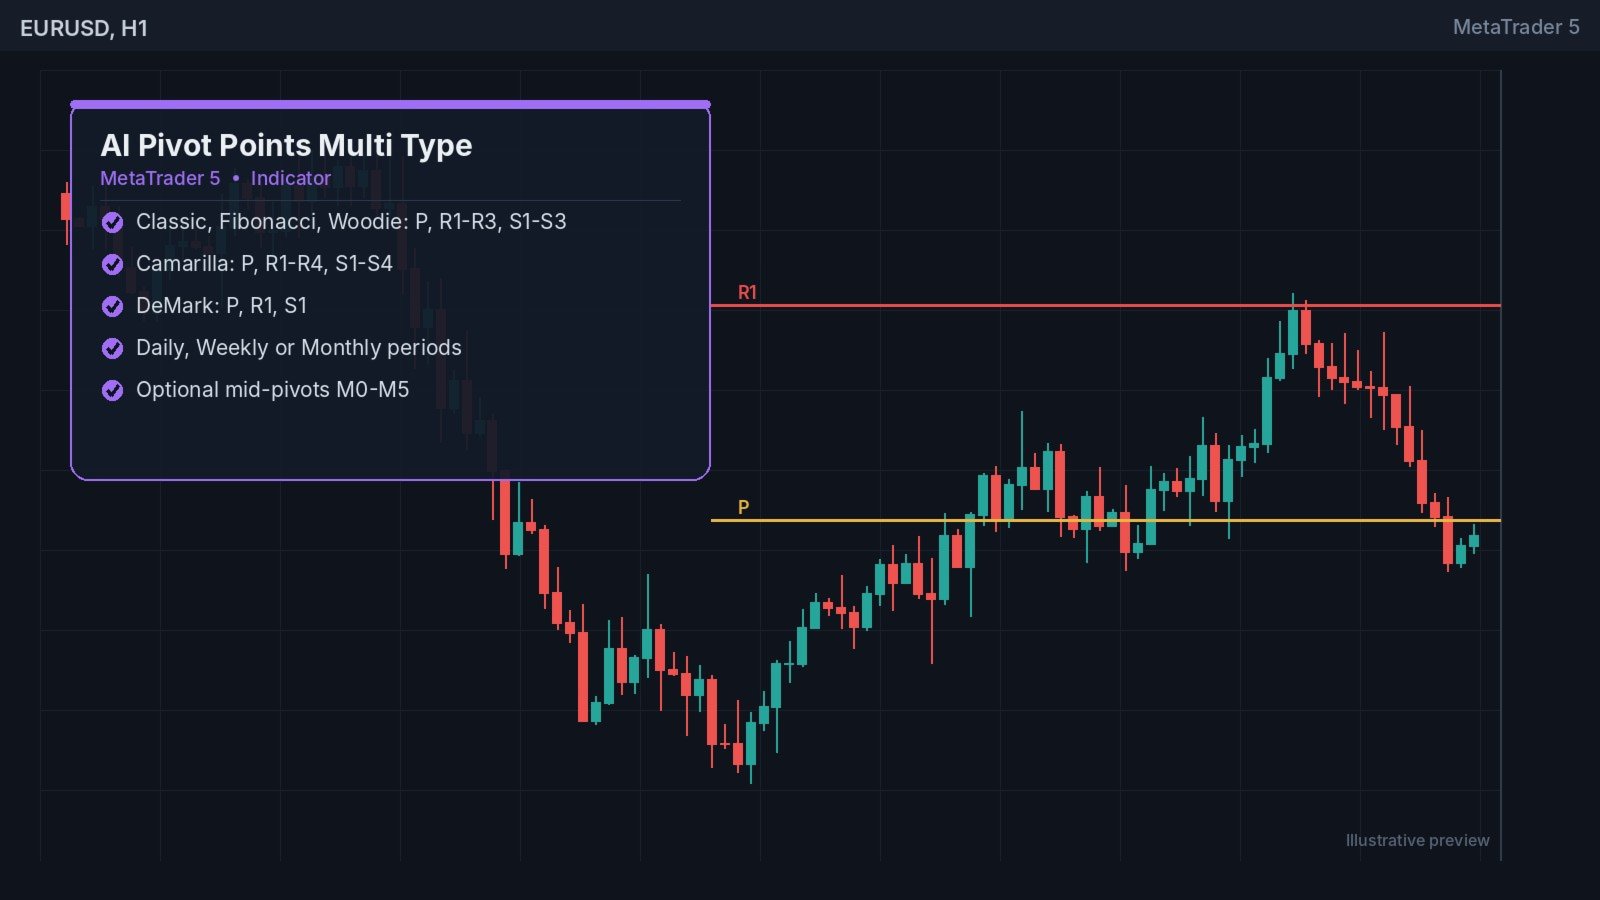
The indicator reads the high, low, close and open of the previous completed Daily, Weekly or Monthly candle and calculates the levels for the period you choose. You can pick Classic, Fibonacci, Camarilla, Woodie or DeMark. Levels are drawn as horizontal segments from the start to the end of each period, so every period keeps its own levels.
The current period gets labels with the level name and price. Previous periods can be drawn as well for context. Mid-pivots between the main levels are optional.
Key features
- Classic, Fibonacci, Woodie: P, R1-R3, S1-S3
- Camarilla: P, R1-R4, S1-S4
- DeMark: P, R1, S1
- Daily, Weekly or Monthly periods
- Optional mid-pivots M0-M5
- Current period plus a set number of previous periods as segments
- Labels with prices, separate colors for pivot, resistance, support and mid levels
- Buffers for EA use: 0 Pivot, 1 R1, 2 S1 for every bar
- Optional alert when a closed candle crosses a level
Recommended
Daily pivots on M5 to H1 charts, Weekly pivots on H1 to H4, Monthly pivots on H4 to D1. Choose a pivot period equal to or higher than the chart timeframe.
Inputs
Pivot type, pivot period, mid-pivots, number of previous periods, labels and prices, colors, line width and style, max bars to calculate and alert options.
Note
Levels come from the previous completed period, so they stay fixed for the whole current period and do not repaint.